HAL Id: hal-02269020
https://hal.univ-reunion.fr/hal-02269020
Submitted on 22 Aug 2019
HAL is a multi-disciplinary open access
archive for the deposit and dissemination of
sci-entific research documents, whether they are
pub-lished or not. The documents may come from
teaching and research institutions in France or
abroad, or from public or private research centers.
L’archive ouverte pluridisciplinaire HAL, est
destinée au dépôt et à la diffusion de documents
scientifiques de niveau recherche, publiés ou non,
émanant des établissements d’enseignement et de
recherche français ou étrangers, des laboratoires
publics ou privés.
foraging hot spots of the green sea turtle
Mayeul Dalleau, Stephanie Kramer-Schadt, Yassine Gangat, Jérôme Bourjea,
Gilles Lajoie, Volker Grimm
To cite this version:
Mayeul Dalleau, Stephanie Kramer-Schadt, Yassine Gangat, Jérôme Bourjea, Gilles Lajoie, et al..
Modeling the emergence of migratory corridors and foraging hot spots of the green sea turtle. Ecology
and Evolution, Wiley Open Access, 2019, 00, pp.1 - 26. �10.1002/ece3.5552�. �hal-02269020�
Ecology and Evolution. 2019;00:1–26. www.ecolevol.org
|
1 Received: 6 April 2019|
Revised: 22 July 2019|
Accepted: 24 July 2019DOI: 10.1002/ece3.5552
O R I G I N A L R E S E A R C H
Modeling the emergence of migratory corridors and foraging
hot spots of the green sea turtle
Mayeul Dalleau
1| Stephanie Kramer‐Schadt
2,3| Yassine Gangat
4| Jérôme Bourjea
5|
Gilles Lajoie
6| Volker Grimm
7,8,9This is an open access article under the terms of the Creative Commons Attribution License, which permits use, distribution and reproduction in any medium, provided the original work is properly cited.
© 2019 The Authors. Ecology and Evolution published by John Wiley & Sons Ltd.
1Centre d'Etude et de Découverte des Tortues Marines (CEDTM), Saint Leu/La Réunion, France 2Department of Ecological Dynamics, Leibniz Institute for Zoo and Wildlife Research, Berlin, Germany 3Department of Ecology, Technische Universität Berlin, Berlin, Germany 4LIM‐IREMIA, EA2525, University of La Réunion, PTU, Sainte‐Clotilde/La Réunion, France 5MARBEC, IRD, Institut Français de Recherche pour l'Exploitation de la Mer (Ifremer), CNRS, Université de Montpellier, Sète Cedex, France 6UMR Espace‐Dev, University of La Réunion, Saint‐Denis, France 7Department of Ecological Modelling, Helmholtz Centre for Environmental Research – UFZ, Leipzig, Germany 8Department of Plant Ecology and Nature Conservation, University of Potsdam, Potsdam‐Golm, Germany 9German Centre for Integrative Biodiversity Research (iDiv) Halle‐Jena‐Leipzig, Leipzig, Germany Correspondence Volker Grimm, Department of Ecological Modelling, Helmholtz Centre for Environmental Research – UFZ, Permoserstr. 15, 04318 Leipzig, Germany. Email: volker.grimm@ufz.de
Abstract
Environmental factors shape the spatial distribution and dynamics of populations. Understanding how these factors interact with movement behavior is critical for effi‐ cient conservation, in particular for migratory species. Adult female green sea turtles, Chelonia mydas, migrate between foraging and nesting sites that are generally sepa‐ rated by thousands of kilometers. As an emblematic endangered species, green tur‐ tles have been intensively studied, with a focus on nesting, migration, and foraging. Nevertheless, few attempts integrated these behaviors and their trade‐offs by con‐ sidering the spatial configurations of foraging and nesting grounds as well as environ‐ mental heterogeneity like oceanic currents and food distribution. We developed an individual‐based model to investigate the impact of local environmental conditions on emerging migratory corridors and reproductive output and to thereby identify conservation priority sites. The model integrates movement, nesting, and foraging behavior. Despite being largely conceptual, the model captured realistic movement patterns which confirm field studies. The spatial distribution of migratory corridors and foraging hot spots was mostly constrained by features of the regional landscape, such as nesting site locations, distribution of feeding patches, and oceanic currents. These constraints also explained the mixing patterns in regional forager communi‐ ties. By implementing alternative decision strategies of the turtles, we found that foraging site fidelity and nesting investment, two characteristics of green turtles' biology, are favorable strategies under unpredictable environmental conditions af‐ fecting their habitats. Based on our results, we propose specific guidelines for the regional conservation of green turtles as well as future research suggestions advanc‐ ing spatial ecology of sea turtles. Being implemented in an easy to learn open‐source software, our model can coevolve with the collection and analysis of new data on energy budget and movement into a generic tool for sea turtle research and conser‐ vation. Our modeling approach could also be useful for supporting the conservation of other migratory marine animals. K E Y W O R D S connectivity, corridors, individual‐based model, migration, movement, sea turtle1 | INTRODUCTION
Many species migrate to exploit resources heterogeneously distrib‐ uted in space and time (Jorgensen, Dunlop, Opdal, & Fiksen, 2008). Individuals must allocate these resources internally to growth, sur‐ vival, and reproduction in a way that maximizes their fitness (Martin, Jager, Preuss, Nisbet, & Grimm, 2013; Roff, 2002; Sibly et al., 2013; Varpe, Jørgensen, Tarling, & Fiksen, 2008). Animal migration costs must therefore be balanced by fitness benefits (Milner‐Gulland, Fryxell, & Sinclair, 2011). Consequently, even small changes, for ex‐ ample, in the quality of breeding or feeding patches can significantly influence long‐term population survival (Fiksen & Jorgensen, 2011; Taylor & Norris, 2010).The green sea turtle, Chelonia mydas, is a wide‐ranging species distributed worldwide (Plotkin, 2003; Figure 1) and classified as endangered in the IUCN red list (Seminoff, 2004). As adults, green turtles perform long‐distance migration between feeding and nest‐ ing sites, which are generally separated by thousands of kilome‐ ters (Godley et al., 2008). They exhibit strong natal philopatry (or natal homing) and tend to nest on the same site that they hatched (Jensen et al., 2019; Lohmann, Witherington, Lohmann, & Salmon, 1997). The southwest Indian Ocean (SWIO) shelters some of the world's major green turtle rookeries (Bourjea, Dalleau, et al., 2015;
Bourjea, Frappier, et al., 2007; Dalleau et al., 2012; Derville et al., 2015; Lauret‐Stepler et al., 2007; Mortimer, von Brandis, Liljevik, Chapman, & Collie, 2011) that are distributed across the entire re‐ gion on oceanic islands spread along the Mozambique Channel and the Mascarene plateau (Figure 2). Other minor nesting sites are lo‐ cated on continental islands and shores on the coast of Madagascar and East Africa (Bourjea, Ciccione, & Ratsimbazafy, 2006; Garnier et al., 2012). Seagrass beds, the main component of adult green tur‐ tle diet (Bjorndal, 1997), extend almost continuously over the east African coast from Mozambique to Somalia and over the western coast of Madagascar (Figure 2; Gullström et al., 2002), and foraging green turtles are observed in all countries of the SWIO hosting sea‐ grass beds (Ballorain et al., 2010; Fulanda et al., 2007; Muir, 2005; Okemwa, Nzuki, & Mueni, 2004; Williams, Pierce, Rohner, Fuentes, & Hamann, 2017). A tracking study (Dalleau, 2013) demonstrated that (a) the northern part of the Mozambique Channel is a major oceanic migration corridor for postnesting green turtles capable to migrate thousands of kilometers, (b) coastal grounds of East Africa and West Madagascar are important foraging sites and migration corridors, (c) turtles from the SWIO nesting sites make extensive use of available foraging habitats of the whole region, and (d) foraging grounds are used by turtles originating from different rookeries of the SWIO. Threats are highly variable in the SWIO region, which is bordered by countries and provinces of heterogeneous economic levels. The region has been identified as a specific “Regional Management Unit” for the green turtle, that is, a spatially explicit population segments defined by biogeographical data of this species (Wallace, DiMatteo, et al., 2010). Long‐term local protection at nesting sites is an import‐ ant component of sea turtle conservation (Chaloupka et al., 2008). Nevertheless, adult green turtles spend most of their lifetime on for‐ aging grounds where they are exposed to important threats such as direct exploitation of eggs, meat, and shells or fisheries interaction (Wallace, Lewison, et al., 2010), especially in the SWIO (Bourjea, 2015; Temple et al., 2018; Williams, Pierce, Fuentes, & Hamann, 2016) where for instance more than between 10,000 and 16,000 green turtles were estimated to be captured by the local artisanal fishery to be sold in local markets for consumption each year only in a portion of the south west coast of Madagascar (Humber, Godley, Ramahery, & Broderick, 2011). Thus, conservation plans can only be efficient with coordinated protection measures encompassing the whole spatial scale of sea turtle's distribution. To focus conservation efforts where they are most required and efficient, it is an urgent need to understand the factors that govern the spatial dynamics of the species and the life‐history strategies that lead to effective cy‐ cles of foraging, migration, and nesting.
Several concepts exist to describe how resource patches are most efficiently exploited by animals (Eliassen, Jorgensen, Mangel, & Giske, 2009). An example is the Marginal Value Theorem (Charnov, 1976) that predicts that a forager should leave a patch when its food intake drops below the average food intake on all other patches. As another example, the theory of Ideal Free Distribution (Fretwell & Lucas, 1970) predicts that the proportion of individuals
F I G U R E 1 The green sea turtle, Chelonia mydas (photo: J.
exploiting different given resource patches should be proportional to the patches' resource levels. Nevertheless, these two com‐ plementary concepts (and others) make the somewhat unrealis‐ tic assumption that foragers can perfectly assess resource levels and heterogeneity over an entire region and respond accordingly (Eliassen et al., 2009; Railsback & Harvey, 2013). Reality often differs from this assumption. For any species, migration toward a feeding patch requires energetically costly movements that might have lim‐ ited benefits if the target feeding patch is already depleted. It seems reasonable to assume that in the case of sea turtles, individuals have little if any information about the location of the feeding patches that are ideal at a given time. It thus remains an open question to what degree the distribution of turtles on feeding patches is deter‐ mined by the sites' accessibility, the turtle's knowledge of their loca‐ tion (foraging site fidelity), and distance to the nesting site.
In addition to feeding patch selection, heterogeneous land‐ scapes are also likely to have strong effects on animal's movement patterns and hence the resulting connectivity among feeding and nesting sites (Graf, Kramer‐Schadt, Fernandez, & Grimm, 2007; Olden, Schooley, Monroe, & Poff, 2004; Pe'er & Kramer‐Schadt, 2008; Revilla, Wiegand, Palomares, Ferreras, & Delibes, 2004). Oceanic currents often play a major role in foraging ecology of marine animals (Bost et al., 2009; Chapman et al., 2011), especially oceanographic fronts (Scales et al., 2014), and sea turtles' oceanic movements are directly affected by oceanic currents (Girard, Sudre, Benhamou, Roos, & Luschi, 2006; Luschi, Hays, & Papi, 2003). The early life stage of marine turtles (that can last decades) is oceanic, and the spatial fate is also strongly impacted by oceanic currents and may have consequences that prevail and shape the spatial dynam‐ ics of adult stages (Gaspar & Lalire, 2017). Furthermore, terrestrial areas, with the exception of nesting grounds, constitute barriers to sea turtle's migration as well as potential navigational cues (Hays, Broderick, Godley, et al., 2002). Migratory constraints might then differ drastically for islands surrounded by coastal areas like Taiwan in the China Sea (Cheng, 2000) in comparison with oceanic isolated islands like Ascension Island in the Southern Atlantic Ocean (Luschi et al., 2003). In summary, successful sea turtle conservation seems to be in‐ trinsically linked to the foraging and migration processes, with natal homing for nesting being one of the key factors driving sea turtle life history. We therefore developed a spatially explicit individual‐based model (Grimm & Railsback, 2005; Railsback & Grimm, 2019) to quali‐ tatively study the spatial dynamics of adult green turtle in the SWIO. Individual‐based modeling, in a large sense, has been used before to address various aspects of sea turtle ecology. A first kind of IBM, that was commonly implemented, concerns the spa‐ tial fate of hatchlings during their first years in the open ocean. Lagrangian modeling of passive drift trajectories has allowed predicting the spatial cycle of juvenile sea turtles (Blumenthal et al., 2009; Godley et al., 2010; Hays, Fossette, Katselidis, Mariani, & Schofield, 2010; Putman & Naro‐Maciel, 2013). Limits of pas‐ sive drift are, however, of concern, and models including active
F I G U R E 2 Overview of the SWIO landscape. Black pentagons represent nesting sites: ALD, Aldabra; EUR, Europa; IRA, Iranja; MAY, Mayotte; MOH, Mohéli; TRO, Tromelin; VAM, Vamizi. Size of nesting site is proportional to nesting number of females. Black crosses represent locations of feeding patches. Arrows indicate major oceanic currents (Schott, Xie, & McCreary, 2009): GW, Great Whirl. Red and blue levels indicate mean annual oceanic current intensities; NEMC, North Equatorial Madagascar current; SC, Somalia Current; SECC, South Equatorial Counter Current; SEMC, South Equatorial Madagascar Current; SG, Southern Gyre. In the legend of the figure, the acronyms describe the input data sources: United Nations Environment Programme—World Conservation Monitoring Centre (UNEP‐WCMC, Green & Short, 2003), Agulhas and Somali Current Large Marine Ecosystems Project (ASCLME, www.asclme.org), Geostrophic and Ekman Current Observatory (GECKO, Sudre et al., 2013)
swimming behavior were developed. Still, movement rules re‐ mained fairly simple and consisted either of random movement (Gaspar et al., 2012; Putman, Scott, Verley, Marsh, & Hays, 2012) or movement oriented along a gradient of environmental vari‐ ables or magnetic fields (Putman, Verley, Shay, & Lohmann, 2012). More recently dispersal affected by oceanic currents and habitat features was modeled for the western Pacific leatherback tur‐ tle (Gaspar & Lalire, 2017), as well as the effect of multiple cues on the homing behavior of individual green sea turtles (Painter & Plochocka, 2019). These kinds of IBMs remained focused on movement and did not consider demographic processes such as survival or reproductive output.
Contrastingly, IBMs were also used to represent population dy‐ namics of sea turtles (Mazaris, Broder, & Matsinos, 2006; Mazaris, Fiksen, & Matsinos, 2005; Mazaris & Matsinos, 2006; Piacenza, Richards, & Heppell, 2017), but in these cases, movement was not explicitly implemented. Another type of IBMs was used to study nesting population dynamics such as consequences of variable re‐ migration intervals on sea turtles' nesting numbers (Hays, 2000; Neeman, Spotila, & O'Connor, 2015) or how changes in biologi‐ cal processes can influence population recovery and assessments (Piacenza et al., 2017). Also in these models, movement was also not explicitly implemented.
Our model explicitly represents movement of thousands of sea turtles, but we do not include demographic processes and hence population dynamics. The main purpose of our model is to better un‐ derstand how the features of the regional landscape, such as nesting site locations, distribution of feeding patches, and oceanic currents, constrain the migratory and foraging patterns of green turtles and to devise implications for the conservation of the species in the region. We implemented alternative foraging and nesting strategies across the entire parameter range, expressing qualitative strategies from being risk prone to risk averse. The model then allowed assessing the influence and sensitivity of different foraging and nesting strat‐ egies in concert with feeding patch disturbance on the reproductive output of rookeries.
2 | METHODS
2.1 | Life cycle of green turtles
The green turtle's life begins in the sand of the natal beach. After emerging from the nests, sea turtles' hatchlings join oceanic waters and drift with the currents (Carr, 1986). They remain in oceanic waters for years in a stage known as oceanic juvenile stage before recruiting in neritic habitats (Musick & Limpus, 1997). Conditions of recruitment and criteria of site selection remain poorly understood but recruit‐ ment zones are often fairly distant from the natal beach (Naro‐Maciel, Becker, Lima, Marcovaldi, & DeSalle, 2007). At this stage, known as the neritic juvenile stage, green turtle's trophic status permanently changes from omnivory to herbivory (Musick & Limpus, 1997). Its main diet thenceforth consists most generally of sea grasses and possibly also of algae (Bjorndal, 1980). At sexual maturity, sea turtles exhibit strong philopatry, that is, a tendency to breed in the place they were born (Brothers & Putman, 2013; Miller, 1997). Adults consequently migrate back and forth to the natal nesting sites every few years (generally 2–4 years, Troeng & Chaloupka, 2007). The duration between two reproductive cycle, known as the “remigration interval,” varies within and among popu‐ lations (Heithaus, 2013) and may depend on population recovering status, availability of quality food, or distance to foraging ground (Troeng & Chaloupka, 2007). Green turtles are capital breeders, since they do not feed during reproduction and the reproductive cycle is based on stored energetic reserves. At nesting site, females repeatedly enter the beach shore where they lay eggs in the sand. Postnesting females then migrate to resident neritic foraging areas. For different sea turtles' species, a site fidelity to foraging areas over multiple reproductive cycles has been observed (Limpus et al., 1992; Marcovaldi et al., 2010; Schofield et al., 2010; Shaver & Rubio, 2008; Tucker, MacDonald, & Seminoff, 2014). In the Mediterranean sea, female green turtles have been tracked migrating to identical foraging locations after successive nesting events (Broderick, Coyne, Fuller, Glen, & Godley, 2007). In the Pacific Ocean, a tagging study also demonstrated foraging site fidelity of female green turtles at different spatial and temporal scale (Read et al., 2014). Nevertheless, change in foraging site has also been observed suggesting that for‐ aging site selection is a plastic behavior (Hays, Hobson, Metcalfe, Righton, & Sims, 2006; Marcovaldi et al., 2010; Shaver & Rubio, 2008). Green turtles postnesting migrations consist of oceanic and/or coastal movement to preferred foraging areas with relatively direct routes (Godley et al., 2008). Coastal sections along the way may af‐ ford foraging opportunities (Cheng, 2000; Godley et al., 2002) but coastlines may also be used to facilitate navigation (Hays, Broderick, Godley, et al., 2002). Oceanic currents constrain homing and post‐ nesting movements by moving individuals away from their course and lowering the ability to orientate (Cerritelli et al., 2018; Cheng & Wang, 2009; Girard et al., 2006).
2.2 | Model description
We describe the model following the ODD (Overview, Design con‐ cepts, and Details) protocol for individual‐based models (Grimm et al., 2006, 2010). The model was implemented in NetLogo 4.1.3 and released under NetLogo 5.3.1 (Railsback & Grimm, 2019; Wilensky, 1999). The NetLogo program and all data files required to run the model are available under https ://www.comses.net/codeb ases/69863 caa‐2f8e‐4412‐a564‐a2826 d9d38 d3/relea ses/1.0.0/.
2.2.1 | Purpose
The proximate purpose of the model is to understand how the fea‐ tures of the SWIO regional landscape, such as nesting site locations, distribution of feeding patches, and oceanic currents, constrain the migratory and foraging patterns of green turtles; its ultimate purpose is to reveal foraging and nesting sites of high conservation value. Themodel implements the processes of foraging, migration, and nest‐ ing to study how they affect the reproductive potential of the main regional rookeries. To go further, the model also explores how differ‐ ent foraging and nesting strategies may affect reproductive output and hence population survival in a heterogeneous landscape.
2.2.2 | Entities, state variables, and scales
The entities of the model are adult female green turtles, square grid cells forming a grid that covers the SWIO region (25°E–65°E; 30°S–10°N; Figure 2), and perturbations. The turtles' state variables are location (grid cell), current preferred feeding patch, nesting site, internal state (“feeding”; “prenesting,” i.e., on the way to the nest‐ ing site; “postnesting,” i.e., on the way from the nesting to a feeding patch; “nesting”; “foraging‐migration,” i.e., moving between feed‐ ing patches), energy level, foraging strategy, and nesting strategy. Each individual also has a coast avoidance direction that determines whether it will avoid the coast to the left or to the right when it is encountered. That direction is reverted depending on whether the turtle is in pre‐ or postnesting migration (Figure 3). Grid cells are characterized by their location. They can be of four different types: terrestrial, nesting site, feeding patch, or just ocean. Terrestrial cells are barriers to movement. Nesting sites represent main regional rookeries (Figure 2; Table 2). They are dispersed across the region with a higher concentration in the northwest of the map (north of the Mozambique Channel). Feeding patches, derived from telemetry mapping (Figure 2), are characterized by their resource level reflecting the availability of seagrass, the main forage for green sea turtles. The resource level of each feeding patch is constantly updated (growth or depletion) depending on the number of turtles feeding on it. Most of the feeding patches occur in larger clusters along continental shelves. Under one simulation scenario, turtle movement is affected by oceanic currents derived from climatology maps: The turtle's veloc‐ ity vector is resulting from the turtle's motor velocity vector plus the oceanic current velocity vector at turtle location. Ocean currents are represented via color coding of oceanic grid cells, in the RGB (red, green, blue) tuple: The red and blue components were used to rep‐ resent, respectively, the eastward and the northward components of the sea surface currents. Feeding patches are possibly exposed to perturbations that alter their productivity. Perturbations are rep‐ resented by a latitude coordinate and a spatial range of action. The growth rates of feeding patches located within the perturbations' spatial range are diminished with the amount of reduction depend‐ ing on the feeding patch's distance to the perturbation's latitude.
Each simulation lasts for approximately 50 years (36,500 time steps). The first two years (1,500 times steps) are considered as a burn‐in period where no model output is recorded. Grid cell dimen‐ sion is approximately 7 × 7 km; the entire model world consists of 567 × 577 grid cells, corresponding to 3,969 × 4,039 km.
2.2.3 | Process overview and scheduling
At each time step, which corresponds to half a day, first all green tur‐ tles and then all feeding patches are processed, both in randomized order and with immediate updating of their state variables. In the following, the names of submodels, which are described in detail in the ODD element “Submodels,” are given in parentheses. The task a green turtle has to perform depends on its internal state: If the internal state is “feeding,” it feeds (win‐energy) and then possibly switches its internal state to “foraging‐migration” (forag‐ ing‐migration‐start) which includes selecting another feeding patch (allocate‐new‐feeding‐patch), or possibly switches to “prenesting” (prenesting‐migration‐start); if the internal state is “prenesting,” the turtle moves toward the nesting site (move‐one‐step‐toward) if it is still outside the detection range of the nesting site, other‐ wise the internal state switches to “nesting”; if the internal state is “postnesting,” it moves toward its current preferred feeding patch (move‐one‐step‐toward) if it is still outside the detection range of the feeding patch, otherwise the state switches to “feeding”; if the internal state is “nesting,” the turtle nests (nests), which includes a possible switch to the state “postnesting”; if the internal state is “for‐ aging‐migration,” the turtle moves between feeding patches in the same way it moves on its way toward and back from its nesting site (move‐one‐step‐toward). At each time step, the turtles' energy level is updated by either gaining energy while feeding or losing energy while nesting or mi‐ grating. Individual actions rely on two decision strategies: foraging F I G U R E 3 Schematic representation of coast avoidance trajectories. Direction of coast avoidance is determined during first prenesting migration (alternatively foraging migration) by prioritizing the least turning angle (to the left, α1, which is smaller than to the right, α2, in this example). During postnesting migration individual will avoid the coast by turning in the opposite direction compared to prenesting migration (to the right in this example). An individual stops following the coast when it is able to move without obstacle in the direction of the target. This may possibly lead to different trajectories during prenesting and postnesting migration
strategy and nesting allocation strategy. The foraging strategy spec‐ ifies whether and when a turtle leaves its feeding patch for another one depending on the resource level of the actual feeding patch. The nesting strategy controls the amount of internal energy invested at each nesting event. We modeled the range of possible strategies in both processes, by a single index ranging from 0 to 1. A foraging patch fidelity strategy close to 1 leads to a “stayer strategy” while a foraging patch fidelity strategy SF close to 0 leads to a “mover strat‐ egy” (Figure 4). A nesting strategy close to 1 leads to an “investment strategy” while a nesting strategy close to 0 leads to a “conservative strategy.” We ran sets of simulations with various combinations of foraging and nesting strategies.
Movement is represented as direct movement toward a se‐ lected site, which is modified when barriers (islands, mainland) are encountered and possibly by passive drift due to oceanic cur‐ rents. Movement is energetically costly, so that swimming be‐ tween foraging patches or foraging further from the nesting site has to be balanced by a gain in foraging conditions. For the feeding patches, growth, depletion by turtles, and possibly perturbation of
the amount of seagrass are considered (seagrass‐stock‐regrowth; Figure 5). Perturbation represents potential natural or anthropo‐ genic impacts (e.g., climate change, habitat destruction, oil spill); its strength depends on latitude relative to the perturbation's location. Feeding patches that are not within the spatial range of action of the perturbation are not affected. Finally, plots and file outputs are updated. Output analyses com‐ prised spatial foraging and migrating pattern as well as reproductive output at the population scale in response to the turtle's strategies. It should be noted that the model did not include mortality or the turtles' life cycles; calculation of the population's reproductive out‐ put calculation was based on the number of nesting events and the energy individuals invested into eggs when nesting. Figure 6 summarizes the processes as implemented in the model. Figure 7 depicts the categories of behavioral strategies. Model pa‐ rameters are specified in Table 1. When possible, the model was parameterized with field data. Otherwise, parameters were deter‐ mined by inverse model fitting to the most realistic and biologically relevant observations.
F I G U R E 4 Foraging patch fidelity strategies and their functional relationships. This figure illustrates the probability Pleave,t for a turtle i to leave a patch p depending on its foraging patch fidelity strategy SF,t and patch resource level Φp,t. The x‐axis represents the resource level Φp,t
of the patch p. The y‐axis is the level of probability Pleave,t of leaving the patch at time t. Each curve depicts the probability Pleave,t of leaving the patch depending on actual level of patch resource. Turtle foraging fidelity patch strategy SF,t is fixed across a single simulation. A foraging patch fidelity strategy closed to 0 (higher curves) leads to an overall higher probability to leave the patch (mover strategy). A strategy closed to 1 (lower curves) leads to an overall smaller probability of leaving the patch (stayer strategy)
F I G U R E 5 Temporal development of patch resource level Φp,t as a function of time t and number of sea turtle feeding on patch Np.
The y‐axis represents the resource level Φp,t of the patch p. The x‐axis represents the time t. Each curve describes how the resource level
Φp,t evolves depending on the number of turtles Np. During simulations, the resource level of a patch is not likely to evolve smoothly as
2.2.4 | Design concepts
Basic principles We assume that turtles have a spatial memory of their preferred feed‐ ing patch and their nesting site. A basic energy budget of energy gains during feeding and losses during migration and egg production deter‐ mines migration patterns, reproductive output, and return intervals to the nesting sites. Preferred feeding patches will be left in the search of better patches if feeding efficiency falls below a certain threshold; this can happen because too many turtles are feeding on this patch or if regrowth of the forage, sea grass, is slow due to perturbations. EmergenceForaging (stayer or mover) or nesting (investment or conservative) strategies directly determine rookery reproductive output via individ‐ ual behavior. Intuitively, the best individual strategy would be to feed on feeding patches close to the rookery, thus reducing the cost of mi‐ gration. However, with conspecifics depleting the close patches, differ‐ ent strategies might be beneficial. The rookeries' reproductive outputs
consequently emerged from individual behavior while searching for patches and deciding on nesting energy allocation. Furthermore, the time interval between every breeding event emerged from energetic constraints, as well as the distribution of the spatial feeding patch usage that we could compare with tracking data from field surveys. Sensing At any time step, a migrating turtle could assess the direction of the migration target (its feeding patch or its nesting site) and has the ability to head toward it. In addition, a turtle could sense and avoid any coastal area located within 100 km of its actual location. Turtles did not have the ability to sense or anticipate the oceanic currents. Turtles perceived the resource level of the feeding patch where they were feeding on. The decision to leave the feeding patch was taken in response to this level. Interaction There was no direct interaction between individuals in the model. However, indirect interaction between individuals was included in‐ directly via resource competition at feeding patches. F I G U R E 6 Flow chart of the model's processes. (a) Flow chart of the turtles' nesting‐migration‐foraging cycle showing the transitions between internal states. (b) Flowchart of the processed determining the resource level of feeding patches
Stochasticity Initial feeding patches are assigned randomly according to decreasing exponential probability function of the distance to the nesting site. The initial spatial distribution of the turtle on feeding patches is therefore variable between simulations although it is impacted by the regional landscape. During the course of the simulation, foraging behavior also leads to temporal and spatial stochasticity. The decision of leaving a feeding patch for another is a probability function that relies on the foraging strategy and on the resource level of the feeding patch. Thus, individuals, although they share the same foraging strategy for a given simulation, will not leave the feeding patch simultaneously. Some indi‐ viduals will randomly leave the patch earlier, therefore causing other individuals to remain in the patch. Furthermore, the choice of the new feeding patch is also a decreasing exponential function of the distance to the patch that is left. Turtles leaving a given patch will not travel to the same feeding patch affecting the occupation of the feeding patches. The stochasticity here is implemented to reflect sources of varia‐ tions that may actually occur during foraging phases. Stochasticity in turtle's distribution over the feeding patches will affect spatial usage of the oceanic areas as migratory corridors but also reproductive output of nesting sites. Over numerous simulations, we may identify areas that are of interest for feeding or migration, despite possible sources of random variations in spatial behavior. On the other hand, we may also identify robust tendencies in reproductive output vari‐ ations between rookeries. Observation
Focusing on model purposes, model outcomes comprised spatial foraging and migration pattern as well as reproductive output at
the population scale in response to the turtle's strategies. To study foraging and migration patterns, we respectively measured feeding patch usage and mapped corresponding migration pathways. For this, we pooled for each environmental scenario the results from all combinations of the two behavioral strategies. We further observed the remigration interval as well as energy storage from which we de‐ duced a reproductive output at rookeries. This was done separately for each behavioral strategy. We studied spatial patterns of three foraging statistics: (a) time usage, that is, the sum, over all time steps, of the number of turtles present on a feeding patch at each time step, (b) number of post‐ nesting visits, that is, the number of times that a turtle arrived in a feeding patch following postnesting migration, and (c) number of foraging visits, that is, the number of times that a turtle arrived in a feeding patch following foraging migration.
In addition, we also studied the foraging patterns in relation to the preferred nesting sites of the foraging turtles. For this, we computed two additional metrics: (a) the number of nesting sites from which nesters originated in a given feeding patch and (b) the diversity index of nesting sites from which nesters originated in a given feeding patch. Diversity index calculation HP is derived from Shannon's diversity index based on the number of postnesting visits:
with rp,n is the relative proportion of postnesting visits of patch p
by turtles from nesting site n, and NN is the number of nesting sites present in the model.
Turtle's prenesting and postnesting migrations were recorded by randomly sampling individual's locations approximately every 500 time steps. Foraging migrations were not recorded. Migration path‐ ways were then studied using kernel methods for density estimation on sampled locations (Worton, 1995).
Only the six main nesting sites (Europa, Aldabra, Mayotte, Mohéli, Tromelin, Glorieuses; see Table 2 for corresponding references) were considered in the study of the reproductive parameters. For each nesting site, the three following statistics were computed: (a) the mean individual remigration interval defined as the mean duration between successive nesting phases per each individual (Figure S2); (b) the mean individual energy level at nesting defined as the mean en‐ ergy level of turtles after the nesting event; (c) the rookery overall re‐ productive output which was calculated as a function of the number of nests, the remigration intervals, and the energy level at nesting. To compute these statistics, at each time k a turtle i nested at nesting site n, we recorded the date Ti,k and the corresponding en‐ ergy level after nesting εi,k. We computed the remigration interval as
the time difference since the previous nesting event, Ti,k, − Ti,k−1. We computed the overall reproductive output ROn of each nesting site
n as directly proportional to the energy levels at nesting εi,k and the nesting investment SN: (1) Hp= ΣNNrp,n× ln(rp,n ) ln(NN) (2)
ROn= ΣiΣk𝜀i,k∕(Ti,k− Ti,k−1) SN
F I G U R E 7 Categories of behavioral strategies. The x‐axis represents the nesting allocation strategy. The y‐axis represents the foraging patch fidelity strategy. Nesting and foraging strategy are constrained between 0 and 1. A nesting allocation strategy closed to 0 leads toward a “conservative” tendency and a nesting allocation strategy closed to 0 to an “investment” tendency. A foraging patch fidelity strategy closed to 0 tends toward a “mover strategy” and a foraging patch fidelity strategy closed to 1 toward a “stayer strategy”
2.2.5 | Initialization
The landscape, in particular the number and location of nesting and feeding patches, remained identical within and between simulations and was taken from input maps. Initial resource level of the feeding
patch was either set to a random positive value sampled from a uni‐ form distribution between zero and maximum resource level Φmax or,
if no depletion by turtles was considered, to Φmax.
Most simulations were run with 7,000 turtles. At the beginning of each simulation, the turtles' nesting sites were allocated randomly
TA B L E 1 Model parameters and variables. Following values are expressed in daily units. Time step correction was taken into account
directly in model implementation
(a) State variables
Turtle NetLogo variable Abbreviation Default value
Location xcor, ycor x, y Variable
Preferred nesting site gt‐nesting‐site N0 1–14
Initial feeding patch gt‐feeding‐patch F0 1–47
Current feeding patch gt‐feeding‐patch Fi 1–47
Internal state (prenesting, nesting, postnesting, foraging) gt‐internal‐state –
Internal energy level at time step t energy‐level εi,t Variable
Coast avoidance side (left or right) gt‐avoidance‐side – −1 (left) or 1 (right)
Feeding patch
Location xcor, ycor px, py –
Feeding patch p resource level at time t feeding‐patch‐resource‐level Φp,t Variable (b) Parameters
World NetLogo variable Abbreviation Default value
Number of turtles N‐GTURTLES NT 7,000
Number of feeding patches N‐FEEDING‐PATCHES NF 47
Number of nesting sites N‐NESTING‐SITES NN 14
Perturbation latitude perturbation‐latitude σy −26°S
Perturbation range perturbation‐range dσ,max 1,000 km
Perturbation intensity perturbation‐intensity σi 0.1
Feeding patch allocation exponent feeding‐patch‐allocation‐exponent λ 20
Turtle
Foraging patch fidelity strategy foraging‐fidelity‐strategy SF (0.2, 0.4, 0.6, 0.8)
Nesting allocation strategy nesting‐allocation‐strategy SN (0.2, 0.4, 0.6, 0.8)
Prenesting threshold prenesting‐threshold εcycle Variable
Migration speed migration‐speed c 65 km/day
Energy loss per movement step during migration energy‐loss‐migration Δεi,m −1
Energy loss per nesting day energy‐loss‐nesting Δεi,n −5
Energy gain per time step while feeding energy‐gain‐feeding Δεi,p,t Variable
Proportion of intake from each patch intake‐proportion α 0.0001
Distance to nesting site distance‐from‐nesting‐site di,n Variable
Maximum number of nesting duration max‐nesting‐duration Tn,max 45 days
Feeding patch
Maximum feeding patch resource level maximum‐feeding‐patch‐resource‐level Φmax 1,000
Initial feeding patch resource level feeding‐patch‐resource‐level Φ0 [0–1,000] Regrowth rate of feeding patch patch‐regrowth‐rate β 2 · α · NT/NF Slope of reaction toward patch leaving decision feeding‐patch‐leaving‐slope a 100 Threshold of reaction toward patch resource depletion level εp feeding‐patch‐leaving‐threshold b 500
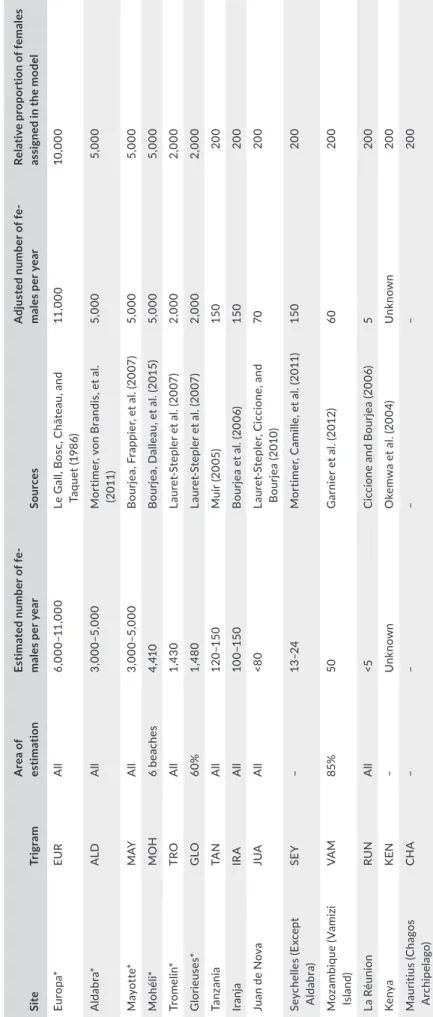
T A B LE 2 Es tim at ed n um be r o f n es tin g fe m al es fo r e ac h ne st in g si te s as av ai la bl e in th e lit er at ur e an d re la tiv e pr op or tio n of n es tin g fe m al es a ss ig ne d to e ac h ne st in g si te in th e m od el . A bs ol ut e nu m be r o f f em al es a ct ua lly a ss ig ne d to e ac h ne st in g si te in th e m od el w as c al cu la te d, in re sp ec t o f t he re la tiv e pr op or tio n in di ca te d he re , e ns ur in g th at th e to ta l n um be r o f in di vi du al s in th e m od el e qu al s N T (7 ,0 00 in di vi du al s) . T hi s da ta n ee d to b e ta ke n w ith c au tio n an d ne ed to b e ju st ifi ed b y th e pa pe rs c ite d. C om pa ris on s ne ed to b e do ne w ith c au tio n be ca us e es tim at io n m et ho ds v ar y fo r a ll si te s. (* M aj or n es tin g si te s) Si te Tr ig ra m A re a o f es tim ati on Es tima ted n umb er o f f e‐ male s p er y ea r So ur ces A dj us te d n um be r o f f e‐ male s p er y ea r Re la tiv e p ro po rt io n o f f em al es as si gn ed i n t he m od el Eu ro pa * EU R A ll 6, 000 –1 1, 000 Le G al l, B os c, C hâ te au , a nd Ta qu et (1 98 6) 11 ,000 10 ,000 Al da bra * A LD A ll 3, 000 –5 ,000 M or tim er , v on B ra nd is , e t a l. (2 011 ) 5, 000 5, 000 M ay ot te* M AY A ll 3, 000 –5 ,000 B ou rje a, F ra pp ie r, et a l. (2 00 7) 5, 000 5, 000 M ohél i* M O H 6 be ac he s 4, 41 0 B ou rje a, D al le au , e t a l. (2 01 5) 5, 000 5, 000 Tr ome lin * TRO A ll 1,4 30 La ur et ‐S te pl er e t a l. (2 00 7) 2, 000 2, 000 G lo rieu se s* G LO 60% 1,4 80 La ur et ‐S te pl er e t a l. (2 00 7) 2, 000 2, 000 Ta nz an ia TA N A ll 12 0– 15 0 M ui r ( 20 05 ) 15 0 20 0 Ir an ja IR A A ll 10 0– 15 0 B ou rje a et a l. (2 00 6) 15 0 20 0 Ju an d e N ov a JU A A ll <8 0 La ur et ‐S te pl er , C ic ci on e, a nd B ou rje a (2 01 0) 70 20 0 Se yc he lle s (E xc ep t Al da bra ) SE Y – 13 –2 4 M or tim er , C am ill e, e t a l. (2 01 1) 15 0 20 0 M oz am bi qu e (V am iz i Isl an d) VA M 85% 50 G ar ni er e t a l. (2 01 2) 60 20 0 La R éu ni on RU N A ll <5 C ic ci on e an d B ou rje a (2 00 6) 5 20 0 Ke ny a K EN – U nk no wn O ke m w a et a l. (2 00 4) U nk no wn 20 0 M au rit iu s (C ha go s A rch ip ela go ) CH A – – – – 20 0
with the constraint of ensuring that realistic proportions were dis‐ tributed over the nesting sites; that is, the distribution across nest‐ ing sites follows the known size of the nesting population (Table 2). The initial feeding patch was also assigned randomly assuming that the probability of a feeding patch to be assigned to a turtle is in‐ versely proportional to the distance separating this site from the turtle's nesting site. That is, the initial distribution over across feed‐ ing patches follows an inverse exponential distance from the nesting site. This probability was calculated in the same way as the choice of a new feeding patch during foraging (procedure “allocates‐new‐ feeding‐patch”). The preferred feeding patch may change during simulations depending on its quality. At initialization, all turtles have the internal state “feeding” and are released at the location of their feeding patch. The initial internal energy level ε0 is randomly attributed by sampling from a positive uniform distribution between 0 and the total energy required for a whole nesting cycle.
2.2.6 | Input data
Main inputs for the model are the functional habitat map (rookeries maps for nesting sites and seagrasses for feeding patches) and the map of oceanic currents. RookeriesRookery locations are mapped from local knowledge and using the latest available estimates of the number of annual nesting fe‐ males (respective studies used are cited in Table 2). We are using the upper limit field estimation of nesting female's number to com‐ pute the proportion of individuals associated with each rookery in the model. The proportion of individuals assigned to each rookery is shown in Table 2. A minimum of 45 turtles is allocated to the small‐ est rookeries. Feeding patches Locations of feeding patches were set up by combining maps from two distinct sources: the World Atlas of Seagrasses (Green & Short, 2003) and the Agulhas and Somali Current Large Marine Ecosystem project (ASCLME; www.asclme.org). Mapped seagrass beds were transformed into feeding patches (grid cells) at locations correspond‐ ing to the location of the main mapped sea grasses beds. Additional feeding patches were added along the coast of Somalia as this place is known to host vast areas of seagrass bed that are not mapped in the cited datasets (S. Andréfouët, personal communication). Oceanic currents To model oceanic currents, we are using an annual climatology map that reflects the mean current velocities in the region. This map was computed by combining GEKCO surface current daily datasets (Sudre, Maes, & Garçon, 2013). We did not consider any seasonal effect at this stage. To represent the 2D currents vector maps in the model, in the RGB (red, green, blue) tuple that is used to encode colors in NetLogo, the green component was left at zero and the
values of the red and blue component were used to represent, re‐ spectively, the eastward and the northward components of the sea surface currents (Figure 2).
2.2.7 | Submodels
Win‐energy When at time t turtle i feeds on patch p, its internal energy level εi,t is increased:with Δεi,p,t being the net gain from patch p at time t. We do not
explicitly consider metabolic costs for maintenance as this was as‐ sumed a constant variable independent from internal state. The net gain per time step Δεi,p,t depends on the resource level of the feeding
patch Φp,t:
with α being the depletion coefficient.
Foraging‐migration‐start
The probability Pleave,i for turtle i to leave the actual feeding patch for another one depends on the resource level of the actual patch Φp,t and on its own foraging patch fidelity strategy SF. The functional
relationship was modeled with a logistic curve:
where a modulates the steepness of the reaction and b is the leaving threshold. A foraging patch fidelity strategy SF close to 1 leads to a “stayer strategy.” A foraging patch fidelity strategy SF close to 0 leads to a “mover strategy” (Figure 7). Values for parameters a and b are given in Table 1. The resulting probability of leaving a feeding patch depending on foraging strategy SF and feeding patch resource level Φp,t is illustrated in Figure 4. This submodel neither takes into account travel costs nor leaving the patch when its food intake drops below the average food intake on all other patches, since the energetic cost to another feeding patch that the turtle has never visited should be unknown to a turtle. Similarly, a turtle on a patch has no knowledge of the potential level of food intake it could get from other patches as it has to be located on a patch to know that level. Therefore, the cost of foraging exploration will emerge from the model. Allocate‐new‐feeding‐patch The selection of a new feeding patch was distance‐dependent with selection probability Pselection determined by an exponential decay function:
(3)
Ei,t+1= 𝜀i,t+ Δ𝜀i,p,t
(4)
Δ𝜀i,p,t= 𝛼 ⋅ Φp,t
(5)
Pleave,i=(1 − 1∕ (1 + exp ((Φp,t+ b) ∕a))) ∕1000⋅(1−SF
)
(6)
Pselection=(1 − drelative
where drelative = d − dmin/dmax − dmin is calculated from d, the dis‐ tance between a new feeding patch and the current feeding patch, and dmin and dmax, the minimum and maximum distance between feeding patches. λ is an arbitrary exponential decay coefficient. This model assumes that choice of a new feeding patch is based rather on the turtles' better knowledge of the location of feeding patches nearby than by those feeding patch resource levels, which they can‐ not know. The minimum and maximum possible distances are not known to the turtles but used to scale the spatial scale of knowledge.
Move‐one‐step‐toward‐with/without‐currents
At each time step and for each turtle in migration, spatial loca‐ tion was updated with a fixed speed of 2.7 km/hr (65 km/day) and a heading toward the selected patch when not facing the coast. Speed value was derived from in situ satellite tracking measurement (Dalleau, 2013). Effective traveling speed and direction may, how‐ ever, be impacted by oceanic currents at the turtle's location.
During prenesting, postnesting or foraging migration, at each time step t a turtle i moves toward a selected patch p, it loses a fixed amount of energy Δεi,m (Table 1):
At each time step t, a turtle i attempts to move one step in the direction of the target, which is either its nesting site in the case of prenesting migration or its current preferred feeding patch in the case of postnesting or foraging‐migration.
For avoidance of coastal grounds, we implemented a simple wall‐ following algorithm (Figure 3). At a given time step, if moving a turtle forward causes this turtle to encounter a coastal grid cell (patch‐ ahead‐is‐coast?), its swimming direction is modified incrementally (angle‐step) up to the minimum angle that allows to move forward without encountering a terrestrial grid cell (see next paragraph re‐ garding the direction of rotation). The turtle then moves forward. At the following time step, if possible, the swimming direction is first modified incrementally (angle‐step) to a direction closer to the direc‐ tion of the target (the feeding patch or the nesting site) that allows moving forward without encountering a grid cell. If the direction of the target can be reached, the swimming direction of the turtle is set to the target's direction. Contrarily, if the swimming direction cannot be modified and if the turtle cannot moves forward, then the swim‐ ming direction is once again modified incrementally (angle‐step) by the minimum angle that allows to move forward without encounter‐ ing a terrestrial grid cell. At the next time step, the same process is repeated. This algorithm leads the turtle to follow the coast until it can freely move in the direction of the target once again. Regarding the rotation direction (to the left or to the right), the first time that a turtle encounters a coast, it corresponds to the direction that leads to the least turning angle required to avoid the coast. The rotation direction is then memorized (gt‐avoidance‐ro‐ tation‐direction) and will remain the same during the duration of a given migration. Nevertheless, the rotation direction is reverted when a turtle starts a pre‐ or a postnesting migration. This reversion is implemented to favor, at least partially, symmetrical migration
trajectories between pre‐ and postnesting migration (Figure 3). With that we ensure that an equivalent route is followed on the way to and the way back from the nesting site. In other terms, if the turtle followed the coast to the right going to the nesting site, it will follow it to the left on the way back. Additionally, the rota‐ tion direction is also reset each time that a turtle starts and stops a foraging migration since these migrations are independent from nesting migrations and since they modify the current feeding patch of the turtle. In case the effect of oceanic currents on movement is considered, migration direction is modified according to the oceanic current ve‐ locity at actual turtle position. The final velocity vector is resulting from the turtle's motor velocity vector toward the target plus the oceanic current velocity vector at turtle location. Computationally, this is simply implemented by artificially displacing the target site (feeding patch or nesting site) at each time step. The “artificial” tar‐ get site (x′, y′) is located at the location of the turtle (x, y) to which we added the vector sum of the velocity vector in the absence of current (dx, dy) and the current velocity vectors (xc, yc). It was calcu‐ lated as follows: The algorithms to move one step forward and to avoid the coastal grounds are then similar than in the absence of currents. Prenesting‐migration‐start
The decision to start prenesting migration depends on the esti‐ mated level of energy necessary to complete the entire nesting pro‐ cess, that is, the turtles stop feeding only if they gained a sufficient amount of energy to complete a round‐trip migration to the nesting site and nesting action. A turtle therefore starts prenesting migra‐ tion (from its current feeding patch to its nesting site) when its en‐ ergy level εi,t reaches approximately the total energy level needed to complete the cycle, εcycle:
where Δεi,m is the energy lost on each time during migration, di,n
the distance from the current feeding patch to the nesting site, and
c migration velocity.
Nests
Depending on the nesting strategy considered, an individual could either invest a large amount of energy into nesting (“investment strategy”—the big spender), thereby trading off between high nest‐ ing investment and low nesting frequency (Figure 7). This might possibly result in large intervals between nesting, thereby reducing fitness when considered over lifetime average. Alternatively, an in‐ dividual could invest only a limited fraction of energy for nesting (“conservative strategy”—bank saver), thereby reducing the nesting investment with lower numbers of eggs produced but shortening the interval between nesting phases.
(7)
𝜀i,t+1= 𝜀i,t− Δ𝜀i,m x�= x + dx + xc (8a) (8b)
y�= y + dy + yc
(9)
The number of time steps spent at nesting sites depends on the value of the parameter characterizing the nesting strategy SN: During nesting, at each time step t spent at a nesting site i, an individual loses Δεi,n: A nesting strategy SN close to 1 leads to an “investment strategy.” A nesting strategy SN close to 0 leads to a “conservative strategy.” After completing the nesting event, the turtle goes back to its last preferred feeding patch. Seagrass‐stock‐regrowth We considered regrowth of seagrass feeding patches based on a logistic function (Figure 5). Uptake resources by turtles was den‐ sity‐dependent (see Bjorndal, Bolten, & Chaloupka, 2000, e.g., of in situ density‐dependence); that is the individual uptake per time step decreased as the number of turtles actually foraging on the patch increased. Depending on its foraging strategy, a turtle could tolerate a low patch resource level and avoid costly forag‐ ing migration (“stayer” tendency) or could rather leave a feeding patch when its resource level is too low (“mover” tendency). At each time step t, the resource level Φp,t of the feeding patch p is updated: where ΔΦp,t is the net growth of patch p at time t which depends on depletion by Np,t turtles foraging on this patch at time t and re‐ growth according to a logistic growth model: where α is the depletion coefficient. The coefficient β was ad‐ justed to (a) maintain the amount of resources relatively constant across the simulation; (b) make the long‐term average resource level being about half of the maximum resource level common to all feed‐ ing patches, this level was chosen arbitrarily but was shared across all simulations; and (c) assuming that the turtles are evenly distrib‐ uted over the feeding patches. Mathematically, this means for all patches p: which gives the following:
The development of the resource level Φp,t of a feeding patch
depending on the number of turtles Np,t foraging on it is illustrated in Figure 5.
Perturbation
Perturbation is defined by a latitude position σy, an intensity level σi, and a maximum range of action dσ,max. The impact of perturbation on a given feeding patch depends on its relative latitude py to per‐ turbation latitude σy. Perturbation effect on feeding patch resource level is inversely proportional to the latitudinal distance dp,σ from the perturbation latitude position σy and is also depends on the regrowth rate of a feeding patch. At each time step, the patch resource level is perturbed as follow:
That is, if the feeding patch is within the perturbation range (dp,σ < dσ,max), the patch resource level for the next step (Φp,t+1) is
diminished by a certain delta (ΔΦp,t). Equation 15b details how
this delta is calculated: The diminishing delta is proportional to the perturbation intensity (σi), the relative latitude to the pertur‐
bation location (dσ,max/dp,σ). It is also a fraction of the actual patch resource level (Φp,t). The coefficient β is calculated to ensure a suf‐ ficient “global” energy level in the system (see previous paragraph Equation 14), with Equation 15c is correcting latitude effects and shows the rela‐ tive latitude of the patch to the latitude of the perturbation. Note that this will remain positive as perturbation latitude is south of the southern site.
2.3 | Simulation experiments
When possible, the model was parameterized with field data. Coastlines were simplified from General Bathymetric Chart of the Ocean (GEBCO) gridded global bathymetry data (www.gebco.net). Rookery locations are mapped using the latest available estimates of annual nesting female numbers (Table 2). Oceanic currents were derived from climatology maps (Sudre et al., 2013). Average swim‐ ming speed during migration (65 km/day) was derived from in situ satellite tracking measurement on female green turtles in the region (Dalleau, 2013). Locations of feeding patches were set up by combining maps from two distinct sources: the World Atlas of Seagrasses (Green & Short, 2003) and the Agulhas and Somali Current Large Marine Ecosystem project (ASCLME; www.asclme.org). Mapped sea‐ grass beds were transformed into feeding patches (grid cells) at locations corresponding to the location of the main mapped sea grasses beds. Additional feeding patches were added along the (10)
Tn,i= SN⋅ Tn, max
(11)
𝜀i,t+1= 𝜀i,t+ Δ𝜀i,n
(12a) Φp,t+1= Φp,t+ ΔΦp,t (12b) ΔΦp,t= 𝛽Φp,t(1 − Φp,t∕Φmax) − 𝛼Np,tΦp,t (13a) ΔΦp,t≈ 0 (13b) Φ ≈ Φmax∕2 (13c) Np,t= NT∕NF (14)
𝛽= 𝛼 ⋅ NT∕NF⋅ Φmax∕(Φmax− Φmax∕2) = 2⋅ 𝛼 ⋅ NT∕NF
(15a) if dp,𝜎< d𝜎, max:Φp,t+1= Φp,t− ΔΦp,t (15b) ΔΦp,t= 𝜎i⋅ 𝛽 ⋅ d𝜎, max∕dp,𝜎⋅ Φp,t (15c) dp,𝜎= py− 𝜎y
coast of Somalia as this place is known to host vast areas of sea‐ grass bed that are not mapped in the cited datasets (S. Andréfouët, pers. communication). Otherwise, parameters were determined by inverse model fitting to the most realistic and biologically relevant observations. For our simple energy budget model, we assumed that sea turtles' reproduc‐ tive activities are considerably more energetically costly than swim‐ ming or foraging (Williard, 2013). Here, cost of nesting compared to other activities was calibrated by aiming for a remigration interval in the model (time interval between individual nesting seasons) ranging between 2 and 7 years across all simulations. These values match the range observed worldwide (Troeng & Chaloupka, 2007). Seagrass growth and density‐dependent depletion were adjusted to maintain the amount of resources relatively constant across a simulation.
Each model simulation was run for approximately 50 years. The first two years were considered as a burn‐in period where no model output was recorded in order to avoid possible artifacts generated by the arbitrarily chosen initial state of the model en‐ tities. We ran simulations under three environmental scenarios: scenario 1, without oceanic currents; scenario 2, with oceanic currents; and scenario 3, without oceanic currents but with local perturbations (i.e., selective reduction of feeding sites' produc‐ tivity). Under environmental scenario 3, perturbations were only located in the southern feeding patches. We arbitrarily chose a single location to simplify our understanding of the effect of the perturbation in the model. Please note that we do not consider a model without oceanic currents (i.e., scenario 1) as realistic but wanted to assess their effects. Exploring unrealistic scenarios is an important element of model analysis and has been listed as part of “Robustness Analysis” (Grimm & Berger, 2016). For each scenario, we ran five repetitions for combinations of different nesting and foraging strategies, respectively, that is, conservative/investment tendencies and mover/stayer tendencies (Figure 7). Strategy ten‐ dencies were fixed and equal for all turtles throughout a single simulation. Overall, we ran a total of 240 simulations (Table 3).
2.4 | Observation and analysis of model output
Model outcomes comprised spatial foraging and migration pattern as well as reproductive output in response to the turtle's strategies. To study foraging and migration patterns, we respectively measured feeding patch usage and mapped corresponding migration pathways. We pooled, for each scenario, the results from all combinations of the behavioral strategies' tendencies. Therefore, we did not assess the spatial effects of behavioral strategies within a given scenario but rather between scenarios. However, emergent biological prop‐ erties such as remigration interval, energy storage, and reproductive output at rookeries were analyzed in the light of behavioral strate‐ gies within each scenario.
2.4.1 | Feeding patch usage
We studied spatial patterns of three foraging statistics: (a) time usage, that is, the sum, over all time steps, of the number of turtles present on a feeding patch at each time step, (b) number of post‐ nesting visits, that is, the number of times that a turtle arrived in a feeding patch following postnesting migration, and (c) number of foraging visits, that is, the number of times that a turtle arrived in a feeding patch following foraging migration from another feeding patch. In addition, we also studied the foraging patterns in relation to the nesting sites of origin for the foraging turtles. For this, we computed two additional metrics: (a) the number of nesting sites from which nest‐ ers originated in a given feeding patch and (b) a diversity index of nest‐ ing sites from which turtles originated in a given feeding patch.
2.4.2 | Migration pathways
Turtle's prenesting and postnesting migrations were recorded by randomly sampling individual's locations approximately every 500 time steps. Foraging migrations were not recorded. Migration path‐ ways were then studied using kernel methods for density estimation on sampled locations (Worton, 1995).
2.4.3 | Energy at nesting, remigration interval, and
reproductive output
Only the six main and well known nesting sites (Europa, Aldabra, Mayotte, Mohéli, Tromelin, Glorieuses; Figure 2; Table 2) were considered in the study of the reproductive parameters. For each nesting site, the three following statistics were computed: (a) the mean individual remigration interval defined as the mean duration between successive nesting phases per each individual; (b) the mean individual energy level at nesting defined as the mean energy level of turtles after the nesting event; (c) the rookery overall reproductive output which was calculated as the sum over each individual's nest‐ ing event, that is, the sum of the energy‐level ratio of each nesting turtle by the remigration interval. TA B L E 3 Model simulation experiments. Overall, we ran three scenarios, four foraging strategy tendencies, four nesting strategy tendencies, and five repetitions for each configuration leading to a total of 240 simulation runs
Scenario Oceanic current Perturbations Foraging strategy Nesting strategy Repetitions Simulations
Scenario 1 No No 4 4 5 80
Scenario 2 Yes No 4 4 5 80