Publisher’s version / Version de l'éditeur:
Science, 87, 2, pp. 75-82, 1959-04-01
READ THESE TERMS AND CONDITIONS CAREFULLY BEFORE USING THIS WEBSITE.
https://nrc-publications.canada.ca/eng/copyright
Vous avez des questions? Nous pouvons vous aider. Pour communiquer directement avec un auteur, consultez la
première page de la revue dans laquelle son article a été publié afin de trouver ses coordonnées. Si vous n’arrivez pas à les repérer, communiquez avec nous à PublicationsArchive-ArchivesPublications@nrc-cnrc.gc.ca.
Questions? Contact the NRC Publications Archive team at
PublicationsArchive-ArchivesPublications@nrc-cnrc.gc.ca. If you wish to email the authors directly, please see the first page of the publication for their contact information.
NRC Publications Archive
Archives des publications du CNRC
This publication could be one of several versions: author’s original, accepted manuscript or the publisher’s version. / La version de cette publication peut être l’une des suivantes : la version prépublication de l’auteur, la version acceptée du manuscrit ou la version de l’éditeur.
Access and use of this website and the material on it are subject to the Terms and Conditions set forth at
Heat and moisture transfer in closed systems of two granular materials
Woodside, W.; Cliffe, J. B.
https://publications-cnrc.canada.ca/fra/droits
L’accès à ce site Web et l’utilisation de son contenu sont assujettis aux conditions présentées dans le site LISEZ CES CONDITIONS ATTENTIVEMENT AVANT D’UTILISER CE SITE WEB.
NRC Publications Record / Notice d'Archives des publications de CNRC:
https://nrc-publications.canada.ca/eng/view/object/?id=7912ecde-285a-4bb0-9a46-ffaeaabfa835 https://publications-cnrc.canada.ca/fra/voir/objet/?id=7912ecde-285a-4bb0-9a46-ffaeaabfa835S e r
TH1
N2lr2no.
77
c . 2A N A L Y Z E D
NATIONAL
RESEARCH
COUNCIL
C A N A D A
DIVISION OF BUILDING RESEARCH
HEAT AND MOISTURE TRANSFER IN CLOSED SYSTEMS OF
TWO GRANULAR MATERIALS
BY
W. WOODSIDE AND J. B. CLIFFE
REPRINT F R O M S O I L SCIENCE. VOL. 87. NO. 2
F E B R U A R Y 1959. P. 75 - 82
R E S E A R C H P A P E R N O . 7 7
O F T H E
DIVISION OF BUILDING RESEARCH
OTTAWA APRIL 1959
This p u b l i c a t i o n
i s
being d i s t r i b u t e d b y
t h e Division of Building Research of t h e N a t i o n a l
Research Council a s a c o n t r i b u t i o n towards b e t t e r
b u i l d i n g i n Canada.
I t
should not b e reproduced
i n whole o r i n p a r t , without permission of t h e o r i -
g i n a l p u b l i s h e r .
The D i v i s i o n would be glad t o b e
of a s s i s t a n c e i n o b t a i n i n g such permission,
F u b l i c a t i o n s of t h e Division of Building
Research may be obtained by m a i l i n g t h e a p p r o p r i a t e
r e m i t t a n c e ,
( a Dank, Express, o r Post Office Money
Order o r a cheque made payable a t p a r i n Ottawa,
t o t h e Receiver General of Canada, c r e d i t N a t i o n a l
Research c o u n c i l ) t o t h e N a t i o r a l Research Council,
Ottawa.
Stamps a r e not a c c e p t a b l e .
A
coupon system has been introduced t o
make payments f o r p u b l i c a t ions r e l a t i v e l y simple.
Coupons a r e a v a i l a b l e i n denominations of
5, 25,
and
!Klc e n t s ,
and may be obtained by making a
re-
m i t t a n c e a s i n d i c a t e d above.
These coupons may b e
used f o r t h e purchase of
a l l N a t i o n a l Research
Council p u b l i c a t i o n s i n c l u d i n g s p e c i f i c a t i o n s
of
Reprinted from SOIL SCIENCE
Vol. 87, No. 2, February, 1959
Printed in U.S.A.
ANALYZED
HEAT AND MOISTURE TRANSFER I N CLOSED SYSTEMS OF TWO
GRANULAR MATERIALS
W. WOODSIDE AND J. B. CLIFFE
National Research Council, Canada1
I
Received for publicntion April 3, 1958I
Many engineering problems require calcula-!
tions of heat flow through the ground. Such prob- lems as (a) performing a heating load calculation for a basementless house, (b) estimating the heat exchange between the ground and a cold storage building, (c) calculating the currentrcarrying capacitv of buried cables, and (d) determining
For sandy soils, above 32"F.,
k = (0.7 log M
+
0.4) 1O.OlD (1) For sandy soils, below 32"F.,k = (0.011
x
1 0 . 0 ~ ~ ~ ~ )+
(0.026 X 10,O1uD)M (la)-
" . . -heat losses from underground steam pipes or hot
water lines, require a knowledge of the thermal For silt and clay soils, above 32"F., conductivity of the soil for their solution. Yet, k = (0.9 log M
-
0.2) 10.UDdespite the need for accurate thermal conduc-
($1
tivity data and the wide use of existing data, the For silt and clay soils, below 32"F., mechanisms by which heat is transferred through
soils, especially when moist, are not completely = X 10.0214D)
understood. Nor is there agreement as to the
+
1M(.025 X 10.014D) (2a)most appropriate method by which the soil con- ductivity should be measured.
In order to understand more clearly the heat transfer mechanisms in moist soils, and also to verify accepted data with similar apparatus, the experiments described herein were performed.
where k = thermal conductivity of soil, B.t.u.
in./hr. sq. ft.OF.; 1M = soil moisture content, per cent of dry weight; and D = dry density of soil, lb./cu. ft. Kersten concluded t h a t for most conditions these empirical relationships should enable the calculation of soil thermal conduc-
REVIEW OF PREVIOUS WORK tivities to within 25 per cent.
More recently, transient heat flow methods
ICersten (5) made a extensive series of have been used to determine the thermal proper- measurements, using a steady-state cylindrical ties of soils. D~ vries (2) made measurements of heat flow method, by Jvhich he determined the the thermal conductivity
of sand at different
dependence of the of l9 temp,atures and moisture contents, using the
soils on mean temperature, density, and moisture transient thermal conductivity probe (or
content. His data are the most widely used a t method. The probe method appears to
present in mabing ground heat calculations, be the most common for the measurement of soil although it is not known whether these tests were thermal resistivity along proposed buried electric allowed to continue long enough to reach corn- cable routes, since measurements with the probe plete steady state. For calculating the thermal are fast (testing time about 15 minutes) and may conductivity of a soil, Kersten divided soils into be performed in situ.
two general classes: sandy soils, and silt and clay vries (2) also of the formulas
soils. He summarized his experimental results by by which the conductivity of a soil might be esti-
the following empirical For the mated from a knowledge of the volume fractions
sandy soils, M
z
1 and for the silt and clay soils, and thermal conductivities of its constituents.f i f >, 7, for these be applicable. An equation derived by Maxwell and
,
Division of Building Research. The senior Lord Rayleigh for the calculation of electrical author is now at Gulf Research and Development cond'-lctivity, and later used by Eucken (3) for Co., Pittsburgh, Pa.; the junior author is at Nova thermal conductivity, was used. For a two-phaseScotia Technical College, Halifax. medium, for example, dry soil containing solid
76 WOODSIDE AND CLIFFE particles and air, the equation reads:
k = ka va
+
ks F (3) , 6.0 - - u,+
US F P where t: 5.5 - - e 1 1-=.
andC
g, = 1 5.0 - =gc
1+
(lc./ka+
1) g. = +k, k, and k, are the thermal conductivities of the dry soil, air, and solid particles respectively; v, is the volume fraction of air (porosity) and v, 4.0 the volume fraction of solid particles (1 -
$
porosity) in the soil; g,, gb, and gc are particle 9A 3.5 - shape factors. For example, g, = gb = gc = % 2
corresponds to spherical particles. For the appli-
cation of this equation to dry soils, De Vries 3'0
-
-
selected g, = gb = 0.125, g, = 0.75, ~vhich
,"
corresponds to particles having the shape of an2
2.5 ellipsoid of revolution. Equation (3) may also be-
-applied to the calculation of the thermal conduc- 9 2.0
-
tivity of a saturated soil, if for lc, the thermalconductivity of water is substituted, and for v,
the saturation moisture content expressed as a 30 40 50 60 70 80 90 100 110 120 130 I S 0 I50 160 170 T E M P E R A T U R E ( O F )
volume fraction. De Vries found that when dry
soil thermal conductivities calculated from equa- FIG. Variation of of
quartz, water, and dry air with temperature tion (3) were multiplied by a correction factor of [according to De Vries
(2)1.
1.25 they agreed fairly well mith the experimental
data of Smith and Byers (8) on dry soils. is provided. Two lucite frames of outside dimen-
TRANSFER O F I-IEbT THROUGH MOIST SOILS sions 12 by 12 by 2 inches and of %-inch thick-
nesses were fitted between the hot and cold
Sand tests plates and then filled from the top with the sand
A series of tests was performed on a gradecl specimen, the joints in the assembly being waxed quartz sand having following properties: to prevent gain or loss of moisture in the test soil designation, 20130
ottawa
sand; particle size specimens. A sheet of polythene film was inter- range, 0 . ~ 7 7 to 0.84 mm.; specific gravity of posed betlveen liot plate surface and specimen to quartz, 2.58; specific surface, 2.4 mZ/g. (deter- keep the air gap between test area and guard ringmined from moisture adsorption isotherm) ; and free of soil. Cold and hot plate temperatures were lidry vapor permeability, 21.9 perm. maintained a t 60" and 90°F., respectively, pro-
in. viding a temperature gradient of 15"F./in. across
Tests \vere performed on the sand at a dry the sand at a mean temperature of 75°F. The density of 100 lb./cu. ft. and at the following following results and observations are given for moisture contents expressed as a percentage of each test in turn.
dry weight: zero (dry), 2 per cent, per cent, Dry sand. Equilibrium conditions were reached
and 24 per cent (saturated). in approximately 60 hours and the thermal con-
~h~ apparatus used for these tests was the ductivity was found t o be 1.83 B.t.u. in./hr. sq. 12- by l>inch guarded hot (ASTM C177), ft."F. Kersten's empirical equation (1) cannot be which is mounted vertically so that the heat flow applied at Zero moisture content, but De Vries' is in the horizontal direction. The test area of equation (3) may be applied. Figure 1 shows the this apparatus, across which the heat flow is variation of the thernlal conductivity of quartz metered, is the central 6- by 6-inch square of the water, and dry air with mean temperature. For hot plate. Thus a square guard ring 3 inches wide sand a t 100 lb. cu. ft., the calculated porosity is
H E A T AND M O I S T U R E T R A N S F E R 0.378. Thus a t 75°F. k, = 0.18, v, = 0.378,
k, = 59, and v, = 0.622. Using De Vries' values
for g, = gi, = 0.125, g, = 0.75, P then equals:
lirith these data, De Vries' equation (3) predicts
a thermal conductivity of 1.82 13.t.u. in./hr. sq.ft."F., which agrees very well with the meas- ured value without a correction factor.
Saturated sand (24 per cent moisture content by weight). The saturated moisture content was based upon the calculated porosity. With 24 per cent water in the sand sample, a free water sur- face existed a t the top, indicating that slightly more water than necessary was present to satu- rate the sand. It was assumed however, that the sand in the test region of the apparatus was saturated.
Equilibrium conditions were reached in 48 hours, and the thermal conductivity was found to be 19.2 B.t.u. in./hr. sq.ft."F. Icersten's em- pirical equation (1) predicts k = 13.7 for this density and moisture content. De Vries' equa- tion may be applied as above, except that the thermal concluctivity of water is now substituted for k,; this results in a conductivity for the satu- rated sand of 21.8.
From these first two tests it may be seen that saturated sand possesses a conductivity of the order of ten times that of dry sand, and also that De Vries' formula without correction factors pre- dicts conductivities for dry and saturated sand in good agreement with the measured conductivi- ties.
ilfoist sand (2 per cent moisture content by weight). Equilibrium 1vas reached in 200 hours and the measured thermal conductivity was 3.9 13.t.u. in./hr. sq.ft."F. Kersten's empirical equa- tion (1) preclicts a value of 6.1.
iLIoisture contents were determined a t the completion of the test by the removal of samples in the test region a t various space intervals across the thickness of the specimens, and by consequent drying to constant weight. Four samples were removed from each specimen a t distances of x 6 ,
%, 154, and
l l M 6
inches from the hot plate. Each sample had dinlensions of % inch diailleter by approximately If.$ inch long, and since weighings were made on a balance sensitive toDISTANCE ( I N C H E S )
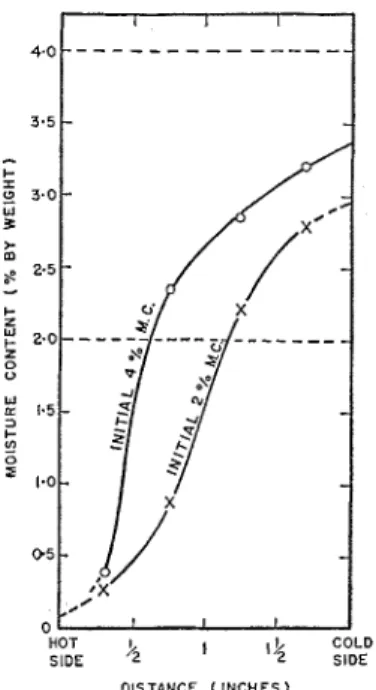
FIG. 2. Equilibrium moisture distribution: initial 2% and 4% moist Ottawa sand; 100 lb./ft.3 dry density; mean temperature, 75'F.; average temperature gradient, IBoF./in., determined by hot plate apparatus.
g., the moisture contents could be deter- mined very accurately. The average equilibrium moisture distribution of the two specimens is shown in figure 2.
It is evident t h a t gravity effects are important even a t this low initial moisture content of 2 per cent with an applied temperature gradient of 15"F./in. By drawing the horizontal clashed line a t 2 per cent moisture content (fig. 2), the aver- age ~noisture content in the test region is seen to be less than 2 per cent. Under the action of a temperature gradient, moisture moves from hot to cool regions (4, 7, 9). Thus the nloisture con- tent a t the cold side probably attained a value large enough to permit gravity drainage out of the test region, leaving an average moisture content in the test region of approximately 1.5 per cent. ilfoist sand (4 per cent moisture content bg
weight). Equilibrium mas reached in approxi- mately 170 hours, ailcl the measured thermal con- ductivity was 7.2 I3.t.u. in./llr. sq.ft."F. Kersten measured a conductivity of 10, ivllile his empirical formula gives k = 8.2 B.t.u. in./hr. sq.ft."F.
At equilibrium, gravity had caused a pro- nounced observable increase in moisture content
78
WOODSIDE AND CLIFFE a t the bottom of the specimens in the guard ringsection. The average equilibrium moisture distri- bution for the two specimens is plotted on figure 2. The moisture content a t the bottom of the specimens was found to be 19.8 per cent, a value approaching the saturation moisture content. Also from figure 2, it is evident that the moisture content in the test region is substantially lower than the initial 4 per cent even a t the cold side, the average moisture content being approxi- mately 2.25 per cent. Thus gravity effects were even more pronounced than in the previous test. An attempt was made to determine the mini- nlum moisture content of the sand a t which gravity effects become noticeable. This was done by allowing sand a t different initially uniform moisture contents to stand vertically for a con- siderable time in sealed test tubes. Aftcr a 2- month period no gravity effects were observable in a sand column with an initial moisture content of 2.95 per cent, but they were observable a t a moisture content of 3.62 per cent. These observa- tions check with the measured cold-side moisture contents in the hot plate tests.
The determination of a thermal conductivity by thc conventional vertical guarded hot plate apparatus would seem of little value for a moist material in the moisture content range in which gravity effects are no longer negligible. The measured values will obviously depend upon the temperature difference applied, the thickness of the specimens, and the relative dimensions of the test and guard sections of the apparatus.
EFFECT O F GRAVITY AND TEhIPERATURE DIFFERENCE ON MEASURED
CONDUCTIVITY
T o study in more detail the effect of gravity on the measured thermal conductivity of the sand a t 4 per cent moisture content, the 8-inch uniflow apparatus was used. This consists of four 8- by 8-inch plates-two heater plates and two cold plates-mounted horizontally, one above
T E M P DIFFERENCE (OF)
FIG. 3 . Conductivity of 4% moisture content Ottawa sand at various temperature gradients and heat flow directions determined by 8-inch uni- flow apparatus with 1-inch thick specimen; density 102 lbJft.3, mean temperature 74.j°F. top cold plate. Constant temperature liquid is circulated through the two cold plates in parallel, and the power input to the heater plates is auto- matically controlled so that the test areas and guard rings of the two heater plates are all main- tained a t the same temperature. Consequently, a t steady state each of the heater plates pro- duces a heat flow in only one direction (uniflow), that is, downwards through the bottom speci- men, and upwards through the top specimen.
Tests were performed with different tempera- ture differences being applied to the specimens.
A constant mean teniperature was retained, however, in order to study the effect of tempera- ture difference on measured conductivity.
No attempt was made to obtain the equilibrium moisture content distributions in these tests due to the thinness of the specimens.
Tests were performed with temperature dif- ferences between hot and cold plates of approsi- mately 10, 20, and 30°F. The results are show11 in figure 3.
DISCUSSION
the other, so that the heat flows in the vertical The conductivities measured in
the uniflow direction. Two identical 1-inch thick specimens tests are all higher than the 7,2 B.t.u. in,/llr. of the 4 per cent moisture content sand were in- ft.2 OF. measured in the vertical hot plate ap- stalled in the apparatus, in 8- by 8- by l-inch paratus a t the same initial nloisture content. I n lucite frames with polythene film covers- The the horizontal arrangement, all the moisture in order in which the components of the assembly the specimens was contributing to the heat trans- occur is as follows: bottom cold plate, bottom fer in the test region, whereas in the vertical posi- specimen, bottom heater plate, >$-in. fiberboard tion the test region lost part of its moisture to insulation, top heater plate, top specimen, and the bottom guard section.
H E A T AND MOISTURE TRANSFER
% MOISTURE CONTENT
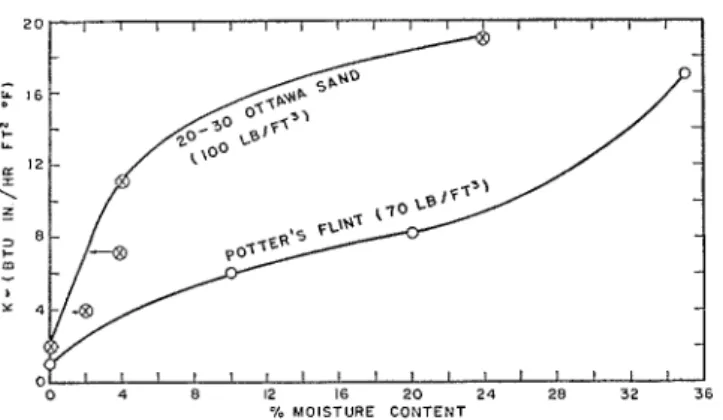
FIG. 4. Conductivities of Ottawa sand and potter's flint determined by guarded hot plate apparatus; mean temperature, 75'F., temperature gradient 15'F./in.
I n all instances a higher measured conduc- tivity was obtained for the top specimen than for the bottom specimen. The difference between the measured conductivity of the top and bottom specimens was 13.1, 17.5, and 22.3 per cent of the mean conductivity a t temperature differences of 10, 20, and 30°F., respectively.
The effect of applied temperature clifference on measured conductivity is also appreciable, the lower the temperature difference the higher the conductivities obtained. The common point on the curves showing measured conductivity versus temperature difference (fig. 3) was obtained by measuring the slope at the origin of the corre- sponding heat flow versus temperature gradient curves. This would be the limiting thermal con- ductivity k toward which the measured conduc- tivity would tend as the appliecl temperature difference is progressively reduced, and hence represents the thermal conductivity when the moisture is very nearly uniformly distributed. I t is this extrapolated conductivity which is plotted in figure 4, showing the variation of k with mois- ture content for the sand. In the test on the initial 4 per cent moisture content sand, the average equilibrium moisture content in the test region was approximately 2.3 per cent (fig. 2). I t is to this equilibrium moisture content that the measured thermal conductivity applies. This cor- rection has been denoted in figure 4 by an arrow, the corrected point being a t the point of the arrow. The point (fig. 4) corresponding to the test on the initial 2 per cent moisture content sand has been corrected in a similar fashion.
When a temperature difference is applied to a porous material containing moisture, the mois- ture is transferred in the direction of hot to cold
by a process of vapor diffusion. If the boundaries of the material are sealed, as in the experiments described, the moisture content must decrease at the hot side and increase at the cold side. A
moisture content gradient is therefore set up in the direction of cold to hot, and liquid moisture may be returned to the hot side by capillary forces. Under steady-state conditions, a dynamic equilibrium exists between the two opposing processes, and the moisture is no longer uni- formly distributed in the material (4, 7, 9).
If the true thermal conductivity k of a moist material is defined as the conductivity of the material when the moisture is uniformly clis- tributed, then k cannot, in general, be deter- mined by a single steady-state test. What is measured is some sort of average conductivity
5 over a non-uniform moisture content clistribu-
tion.The variation of k with moisture content 7n for
the sand (fig. 4) is represented by a convex curve. Thus the rate of increase of k with m is larger at low moisture contents than at high moisture contents (that is, d2k/dm2
<
0). In a specimen with initially uniform moisture con- tent, the hot region during test loses moisture to the cold region although the total moisture con- tent does not change. The thermal conductivity of the hot region decreases, however, by an amount greater than the increase in conductivity of the cold region. Thus the overall conductivity of the specimen, which is the quantity measured, is less than if the moisture had remained uni- formly distributed. This effect becomes greater the greater the moisture redistribution, and there- fore explains the observed decrease in measured80 WOODSIDE AND CLIFFE
conductivity with increasing temperature dif- But the heat flux Q, is also given by ference (fig. 3).
This effect also explains the effect of gravity on Q, = - k, dT
-
the measured conductivities in the uniflow tests. dx
I n the top specimen, the heat flowed upwards
setting up a downward moisture content gradi- where k, is the component of thermal con- ent. Thus gravity assisted the capillary forces in ductivity due to vapor flow. Therefore:
mlon, pro- returning liquid moisture to the hot re,'
ducing a more uniform moisture distribution and, therefore, a higher measured conductivity than in the bottom specimen where gravity and capillary forces were opposed.
The effects of gravity and applied temperature difference will be opposite to those just described in the case of a material for which the k versus m curve is concave (d2k/dm2
>
0).The results indicate that thermal conductivity measurements by steady-state methods should be performed with as small temperature gradients as possible. (In the ground, natural temperature gradients are generally of the order of 1°F./ft. or smaller, compared with the gradients ranging between 5 and 20°F./in. normally used for laboratory measurements).
CALCULATION O F HEAT TRANSFER DUE
T O VAPOR D ~ F U S I O N
It is of interest to make an approximate calcu- lation of the contribution made by water vapor diffusion to the total heat transfer in wet sand. The vapor flux F is given by
The water vapor permeability p, of the sand was measured by a dry cup technique (1) and found to be 21.9 perm. in. (perm. in. is an ab- breviation of the unit: grains in./hr. ft.2 in Hg). The dry cup method involves a gravirnetric measurement of the steady state water vapor transmission through a layer of the test material under isothermal conditions (73°F.) with a relative humidity of 0 per cent maintained on one side (by means of a dessicant) and a relative humidity of 50 per cent maintained on the other. The moisture content of the sand sample, under the above boundary conditions, was very low, and therefore the vapor permeability measured was probably maximal, since at higher moisture contents, the pore space available for vapor diffusion decreases.
At 75"F., assuming saturation water vapor pressures in the pore spaces of the wet sand, dp/dT = 0.030 in Hg/"F. Since L = 1050 B.t.u./lb. = 0.15 B.t.u./grain, k , is given by
k, = 21.9
x
0.15x
0.03 = 0.10 B.t.u. in./hr. ft2. O F .Thus water vapor diffusion makes only a minor contribution t o the heat transfer in wet where p, is the vapor permeability (diffusion sand.
coefficient) of the sand and dpldx is the vapor 1, general, using pemanjs (6) enlpirical
Pressure gradient, which also be written as relationship between vapor permeability and
dp d T porosity P for dry and moist soils
dpldx = -
-
d T dx /L = 0.66 Ppuir
where dT/dz is the temperature gradient. Each the for the component of thermal
unit of mass of diffusing vapor absorbs L units conductivity due to vapor flow becomes of heat a t the evaporation plane and releases i t
a t the condensation plane, L being the latent k, = 0.66 P pair L d~ -
heat of vaporisation of water. Thus the vapor d T ( 5 )
diffusion acts as a parallel heat transfer mech-
anism, producing a heat flux Q, where where pair is the diffusion coefficient for water vapor through air. I t appears that for most soils,
dp
ap
d~Q v - - p L - = - p L - - - the contribution of vapor d'iusion t o the total
Flint tests
HEAT AND MOISTURE TRANSFER
A series of tests was also performed with the 12-inch guarded hot plate apparatus on material described as follows: designation, potter's flint; particle size range, 0.005 to 0.05 mm.; specific gravity of particles (quartz), 2.58; specific surface (from water vapor adsorption), 8.85 m2/g.; and "dry cup" water vapor permeability, 29.1 perm. in. This material is not a naturally oc- curring soil but is a fine white quartz powder similar in particle size to a silt soil.
Tests were performed on this material a t the following moisture contents: zero (dry), 10 per cent, 20 per cent, and 35 per cent (saturated). Test conditions were similar to those described for the sand tests in the l2inch hot plate. It
was impossible, however, to maintain the same dry density for all tests. The results are described as follows.
Dry Jint. Equilibrium was attained in 100 hours, and the measured conductivity was 0.986 B.t.u. in./hr. sq. ft."F. a t a dry density of 70 lb./cu. ft. The calculated porosity a t this density is v, = 0.565 and De Vries' equation (3) gives a conductivity of 0.951 B.t.u. in./hr. sq. ft."F. Saturated Jlint (35 per cent moisture content). The dry density in this test was 82.2 lb./cu. ft., leading to a calculated porosity of v, = 0.489 and hence a calculated saturation moisture content of 37.1 per cent of dry weight. At a moisture content of 35 per cent, however, a free water surface existed a t the top of the specimens.
The measured thermal conductivity mas 17.0 B.t.u. in./hr. sq. ft."F., a conductivity of the order of 20 times that of dry flint. Kersten's empirical formula predicts k = 7.9, and De Vries' formula predicts k = 16.9.
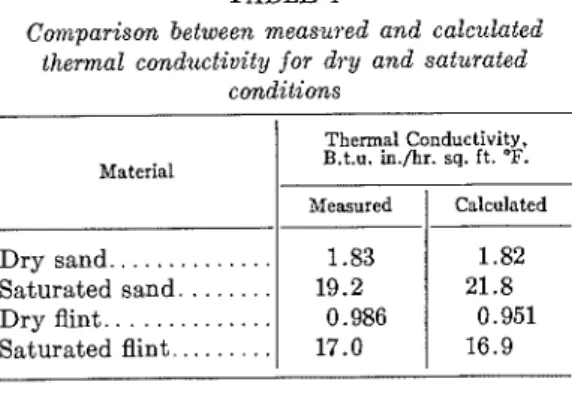
TABLE 1
Comparison between measured and calculated thermal condz~ctivity for dry and saturated
conditions Thermal Conductivity. B.t.u. in./hr. sq. ft. 9. Material
I
MeasuredI
Calculated DISTANCE ( INCHES Dry sand.. . . Saturated sand. . . Dry flint.. . . Saturated flint.. . .FIG. 5. Equilibrium moisture distribution: initial 10% and 20% moist potter's flint; 70lb./ft.a dry density; average temperature gradient, 15OF./ in., determined in hot plate apparatus.
1.83 19.2
0.986 17.0
The comparison between measured thermal conductivity values and those calculated from De Vries' formula for dry and saturated sand and flint, is shown in table I. De Vries' formula gives conductivity values in good agreement with the measured values without the appli- cation of the correction factor 1.25.
Moist Jlint (10 per cent moisture content). Equilibrium conditions were reached in 60 hours, and the measured thermal conductivity was 6.01 a t a dry density of 65.2 lb./cu. ft. Kersten's empirical formula gives k = 3.14. The final moisture distribution is plotted in figure 5. Moist Jlint (20 per cent moisture content). Equilibrium was reached in 80 hours, and the measured conductivity was 8.2 a t a dry density of 69.5 lb./cu. ft. Kersten's formula gives k = 4.8. The equilibrium moisture distribution is shown in figure 5.
Since such a uniform final moisture distribu- tion suggests that capillary effects are occurring across the entire specimen thickness, it cannot be concluded that an applied temperature gradient produces a pronounced moisture con- tent gradient in all enclosed moist granular materials.
Gravity effects were not observed during the flint tests and consequently no tests were per- formed with the uniflow apparatus. A separate 1.82
21.8 0.951 16.9
82 WOODSIDE AND CLIFFE test showed that gravity movement of water
would begin a t a moisture content of between
25 and 27 per cent. I n this material also, vapor diffusion makes only a minor contribution to heat transfer.
The relationship between measured con- ductivity and moisture content for this material is shown in figure 4.
CONCLUSIONS
(a) De Vries' formula for the thermal con- ductivity of a dry or saturated soil enabled conductivity values t o be calculated that are in good agreement with the measured values for the two materials tested. No correction factor was required.
(b) For the two materials tested thermal conductivity values calculated from Kersten's empirical formulas differ in most cases from the measured values by more than 25 per cent.
(c) The measurement of thermal conduc-
tivity by the conventional vertical guarded hot plate (horizontal heat flow) appears to be of limited value for a moist sand in the moisture I
content range in which gravity effects pre-
,
dominate.(d) I n the case of vertical heat flow in the sand a t a moisture content in the range where gravity effects are important, measured con- ductivities were higher for heat flow upwards than for heat flow downwards, the difference increasing as the applied temperature difference was increased.
( e ) The measured thermal conductivity of
the sand varied with the applied temperature difference, higher conductivities being obtained the lower the temperature difference.
Cf)
Water vapor diffusion, with its associated latent heat transfer, contributes only in a minorway to the total heat transfer in the two ma- terials studied.
(g) Gravity effects were not observed during the tests on potter's fint. Since the steady-state moisture distribution was more uniform than in the sand, it is expected that temperature differ- ence effects would also be less pronounced.
REFERENCES
(I) AMERICAN SOCIETY FOR TESTING MATERIALS,
Designation E96 - 53T. 1955 Measuring water vapor transmission of materials in sheet form. ASTM Standards, part 7, pp. 1587-1593.
(2) DE VRIES, D. A. 1952 The thermal conduc- tivity of soil. ~Mcdedclingen van de Landbouwhogeshool te Wagcninigcn 52(1): 1-73.
(3) EUCKEN, A. 1932 VDI Forschungshcjt No.
363.
(4) GURR, C. G., MARSHALL, T. J., AND HUTTON,
J. T. 1952 Movement of water in soil due to a temperature gradient. Soil Sci. 74: 335- 345.
(5) KERSTEN, M. S. 1949 Thermal properties of soils. Univ. oj Minnesota, Eng. Ezpt. Sta. Bull. 28.
( 6 ) PENMAN, H. L. 1940 Gas and vapor move- ment in soil. J. Agr. Sci. 30: 43W62, 570- 581.
(7) PHILIP, J. R., AND DE VRIES, D. A. 1957
Moisture movement in porous materials under temperature gradients. Trans. Am. Geophys. Union 38: 22Z232.
( 8 ) SMITH, W. O., A N D BYERS, H. G. 1938 The
thermal conductivity of dry soils of certain of the great soil groups. Soil Sci. Soc. Amer. Proc. 3: 13-19.
(9) TAYLOR, S. A., A N D CAVAZZA, L. 1954 The
movement of soil moisture in response to temperature gradients. Soil Sci. Soc. Amer. Proc. 18: 351-358.