Publisher’s version / Version de l'éditeur:
Vous avez des questions? Nous pouvons vous aider. Pour communiquer directement avec un auteur, consultez la première page de la revue dans laquelle son article a été publié afin de trouver ses coordonnées. Si vous n’arrivez Questions? Contact the NRC Publications Archive team at
PublicationsArchive-ArchivesPublications@nrc-cnrc.gc.ca. If you wish to email the authors directly, please see the first page of the publication for their contact information.
https://publications-cnrc.canada.ca/fra/droits
L’accès à ce site Web et l’utilisation de son contenu sont assujettis aux conditions présentées dans le site LISEZ CES CONDITIONS ATTENTIVEMENT AVANT D’UTILISER CE SITE WEB.
Research Report (National Research Council of Canada. Institute for Research in Construction), 2008-09-12
READ THESE TERMS AND CONDITIONS CAREFULLY BEFORE USING THIS WEBSITE.
https://nrc-publications.canada.ca/eng/copyright
NRC Publications Archive Record / Notice des Archives des publications du CNRC :
https://nrc-publications.canada.ca/eng/view/object/?id=b02b5fe1-7f79-4096-ad06-f4141c05c6e2 https://publications-cnrc.canada.ca/fra/voir/objet/?id=b02b5fe1-7f79-4096-ad06-f4141c05c6e2
NRC Publications Archive
Archives des publications du CNRC
For the publisher’s version, please access the DOI link below./ Pour consulter la version de l’éditeur, utilisez le lien DOI ci-dessous.
https://doi.org/10.4224/20374072
Access and use of this website and the material on it are subject to the Terms and Conditions set forth at International Road Tunnel Fire Detection Research Project - Phase II Task 7: Full-Scale Ventilated Fire Tests in a Laboratory Tunnel for Study of Fire Detection Technologies
Liu, Z. G.; Crampton, G. P.; Kashef, A.; Lougheed, G. D.; Gibbs, E.; Muradori, S.
http://irc.nrc-cnrc.gc.ca
I nt e r na t iona l Roa d Tunne l Fire De t e c t ion Re se a rch Proje c t
- Pha se I I Ta sk 7 : Full-Sc a le Ve nt ilat e d Fire Te st s in a
La borat or y Tunne l for St udy of Fire De t e c t ion Te c hnologie s
R R - 2 7 3
L i u , Z . G . ; C r a m p t o n , G . P . ; K a s h e f , A . ; L o u g h e e d , G . D . ; G i b b s , E . ; M u r a d o r i , S .
Sept. 12, 2008
The material in this document is covered by the provisions of the Copyright Act, by Canadian laws, policies, regulations and international agreements. Such provisions serve to identify the information source and, in specific instances, to prohibit reproduction of materials without written permission. For more information visit http://laws.justice.gc.ca/en/showtdm/cs/C-42
Les renseignements dans ce document sont protégés par la Loi sur le droit d'auteur, par les lois, les politiques et les règlements du Canada et des accords internationaux. Ces dispositions permettent d'identifier la source de l'information et, dans certains cas, d'interdire la copie de documents sans permission écrite. Pour obtenir de plus amples renseignements : http://lois.justice.gc.ca/fr/showtdm/cs/C-42
International Road Tunnel Fire Detection Research Project – Phase II
TASK 7: FULL-SCALE VENTILATED FIRE TESTS IN A
LABORATORY TUNNEL FOR STUDY OF FIRE
DETECTION TECHNOLOGIES
Prepared by
Z. G. Liu, G. Crampton, A. Kashef, G. Lougheed, E. Gibbs and S. Muradori
Fire Research Program
Institute for Research in Construction
International Road Tunnel Fire Detection Research Project – Phase II
Project Technical Panel
Frank Gallo, Port Authority of New York and New Jersey Harry Capers, New Jersey DOT
Alexandre Debs, Ministry of Transportation of Quebec Jesus Rohena, Federal Highway Administration
Paul Patty, Underwriters Laboratories Inc. Volker Wetzig, Versuchs Stollen Hagerbach AG Art Bendelius, A & G Consultants
Bill Connell, Parsons Brinckerhoff
Margaret Simonson, Swedish National Testing and Research Institute Gary English, Seattle Fire Department
Peter Johnson, ARUP Fire Risk & Security Jim Lake, NFPA staff liaison
Principal Sponsors
Ministry of Transportation of British Columbia Ministry of Transportation of Ontario
Ministry of Transportation of Quebec
The City of Edmonton, Transportation Department, Transit Projects Branch AxonX LLC
Siemens Building Technologies Tyco Fire Products
VisionUSA
Sureland Industrial Fire Safety
United Technologies Research Corporation
Contributing Sponsors
National Research Council of Canada
Port Authority of New York and New Jersey A & G Consultants
PB Foundation Micropack, Inc.
J-Power Systems and Sumitomo Electric U.S.A., Inc. Honeywell Inc.
EXECUTIVE SUMMARY
Fire incidents can occur in road tunnels with longitudinal airflow. The longitudinal airflow can be produced naturally due to meteorological conditions (e.g. wind effects) or as a result of the normal operation of the ventilation system. The longitudinal airflow can affect fire behaviour (fire growth rate, heat release rate, shape and tilt of fire plume, etc.) and smoke spread and hot gas distribution in the tunnel, which in turn affect the response of fire detectors/detection systems to a fire incident.
This report provides the results of Task 7 of the International Road Tunnel Fire Detection Research Project (Phase II): Full-Scale Ventilated Fire Tests in a Laboratory Tunnel. The objective of Task 7 were:
• To study fire behaviour under longitudinal airflow conditions.
• To investigate the effect of longitudinal airflow on the performance of fire detectors/detection systems.
Nine fire detectors/detection systems that represented five types of fire detection technologies were evaluated in the test series. These detection systems included: two linear heat detection systems, one optical flame detector, three video imaging detection (VID) systems, one smoke detection system and two spot heat detectors. The setup and location of these detectors/detection systems in the tunnel were the same as used in Task 2 of the project under non-ventilated conditions.
The fire scenarios used in the test series were selected from those used in Task 2 of the project. The fire scenarios included: three pool fire sizes located underneath a simulated vehicle, two pool fire sizes located behind a large simulated vehicle, and a passenger compartment fire in a simulated stationary vehicle. The fuel types used in the tests included gasoline, wood crib and plastic foam.
The fire source was located near an open end of the test tunnel, simulating a fire incident at either the entrance or exit of tunnel. The airflow was provided by running a fan system mounted on the test tunnel. The longitudinal airflow in the tunnel was towards the fire detectors that were mounted on the wall of the tunnel. The airflow speeds in the test series were 0 m/s, 1.5 m/s and 3 m/s.
The performances of the fire detectors/detection systems under airflow conditions, including their response times, and their ability to locate and monitor a fire in the tunnel, were evaluated. The fire characteristics produced in the various fire scenarios, including fuel burning time, fire growth rate, temperatures and smoke spread in the tunnel, were measured.
Test results showed that the longitudinal airflow in the tunnel had a significant effect on fire behaviour and the performance of the fire detectors/detection systems. The response times of detectors/detection systems to a fire in the tunnel could be delayed or shortened under airflow conditions, depending on fuel type, fire size, location and growth rate of the fire, airflow speed as well as the detection method.
With airflow, the fire plume was tilted toward the downstream side of the fire source. The angle of the fire plume to the ground decreased with an increase in airflow speed. In some cases, the fire plume decreased in length and became unstable at high airflow speeds. The effect of the airflow on the fire plume decreased with an increase in fire size.
The duration of the passenger compartment fire was decreased under longitudinal airflow conditions. Temperature and smoke optical density near the ceiling of the tunnel were lower than those produced under non-ventilated conditions. Generally, the response times of fire detection systems to the passenger compartment fire in the stationary vehicle were delayed or in some cases there was no response under airflow conditions.
The performance of the heat detection systems for the fire scenarios with the pool fires located under a simulated vehicle and behind a large vehicle is summarized as follows:
• The change in the fire plume under longitudinal airflow conditions resulted in a shift of the ceiling hot spot from vertically above the fire source. The distance of the shift was dependent on the fire size, location, fuel type, fire scenario, and airflow speed. The maximum distance observed in the tests was approximately 6-8 m. As a result, the hot spot identified by heat detection systems (linear and spot) under longitudinal airflow conditions would not reflect the real fire location.
• The ceiling temperatures produced by small fires located underneath a vehicle, and open pool fires located behind a vehicle, were lower than those produced under non-ventilated conditions. These temperatures were further decreased with the increase in airflow velocity. The response times of heat detection systems to these fires, generally, increased with the increase in airflow speed.
• Ceiling temperatures produced by large pool fires located underneath a vehicle with an airflow velocity of 1.5 m/s were higher than those produced under non-ventilated conditions. The increased temperature was due to the increased burning rate of the fire compared with tests with minimal airflow in the tunnel. However, the ceiling temperatures were lower in the tests with an airflow velocity of 3 m/s. Therefore, the response times of heat detection systems to large pool fires located under a vehicle were shorter for tests with an airflow velocity of 1.5 m/s than those in tests with minimal airflow velocity as well as for the higher airflow velocity tests.
The performance of the VID systems for the fire scenarios with the pool fires located under a simulated vehicle and behind a large vehicle is summarized as follows:
• The burning rate of the fuel increased with an increase in airflow speed. There was a significant change in burning rate between the tests with minimal airflow and the tests
with a 1.5 m/s airflow velocity. The results also indicated there was a further small increase in burning rate for tests with an airflow velocity of 3 m/s. However, the effect of airflow on the burning rate was, generally, reduced with the increase in fire size. It was also dependent on the fire scenario and fuel type. Under airflow conditions, smoke production was increased and its spread in the tunnel was more rapid. As a result, the period of time available for the VID systems to detect and monitor the fire decreased with the increase in airflow speed as well as fire size. • The response times of VID D-4C1 to the fires, generally, increased with the increase
in airflow speed. While, it detected the 1 m2 gasoline pool fire located behind a simulated vehicle, it was unable to detect the 2 m2 gasoline pool fire. In this case, the visibility in the tunnel was quickly lost. VID D-5C2 did not respond to large fires located behind a vehicle at an airflow speed of 1.5 m/s but detected them at an airflow speed of 3 m/s.
• Both VIDs D-4C1 and D-5C2 were, generally, able to detect fires located underneath the vehicle. VID D-5C2 detected small fires located underneath a vehicle at the three airflow velocities. The response time decreased with an increase in fire size but was not affected by a change in airflow speed (for small fires, smoke was the main parameter that controlled the response time). On the other hand, the response times of D-4C1 decreased with an increase in airflow speed.
• It was difficult for VID D-6C3 to detect fires located underneath a vehicle and behind a large vehicle under longitudinal airflow conditions, as the fire plume was titled and shielded behind the obstacles. The detector only responded to a 1 m2 gasoline pool fire located underneath the vehicle at an airflow speed of 1.5 m/s but did not respond to the other scenarios with pool fires.
The performance of the optical flame detector, D-3F1, for the fire scenarios with the pool fires located under a simulated vehicle and behind a large vehicle is summarized as follows:
• The detector with a medium sensitivity level did not respond to a small fire located underneath a vehicle at an airflow speed of 1.5 m/s. However, it detected the same fire at an airflow speed of 3 m/s.
• It was difficult for the detector with medium sensitivity to respond to a fire located behind a large simulated vehicle for tests with longitudinal airflow. The detector responded to the fires at an airflow speed of 1.5 m/s but did not respond at an airflow speed of 3 m/s.
• The response time of the detector with a medium sensitivity to a 1 m2 pool fire located underneath a vehicle increased with an increase in airflow speed. However, the effect of airflow on detection time for a 2 m2 pool fire located underneath the vehicle was limited.
• The sensitivity of the optical flame detector was reduced for the tests with longitudinal airflow as a result of the environmental tests conducted in the Lincoln
tunnel. A second detector with the high sensitivity level used in Task 2 was also included in the Task 7 tests. This detector was able to detect all the fires.
The performance of the smoke detector system for the three fires scenarios is summarized as follows:
• The response times of the smoke detection system to a 0.36 m2 gasoline pool fire located underneath a vehicle increased with the increase in airflow speed. However, the response time for the open pool fires located behind the vehicle under airflow conditions were shorter or comparable to those under non-ventilated conditions, as more smoke was produced in the tests with airflow.
• For large pool fires located underneath a vehicle, the smoke optical densities produced with an airflow velocity of 1.5 m/s were higher than those produced under non-ventilated conditions due to the increased burning rate of the fire. However, smoke optical density near the ceiling of the tunnel decreased in the tests with an airflow velocity of 3 m/s. Therefore, the response times of smoke systems to these fires were shorter for tests with an airflow velocity of 1.5 m/s than those in tests with minimal and higher airflow velocities.
ACKNOWLEDGEMENTS
The project was conducted under the auspices of the Fire Protection Research Foundation (FPRF). The full-scale fire tests were conducted in a laboratory tunnel of Carleton University. The authors would like to acknowledge the support of the Technical Panel, Sponsors as well as many NRCC staff to this project. A special acknowledgement is noted to Kathleen Almand of the FPRF for her contribution in managing the project.
TABLE OF CONTENTS
1. Introduction ...9
2. Test Tunnel ...10
3. Fire Detection Systems and Test Setups ...12
4. Instrumentation ...14
5. Test Procedure ...18
6. Ventilation Setup and Air Flow Measurement ...19
7. Fire Tests and Results ...25
7.1 Pool Fires Located Underneath Vehicle ...26
7.1.1 Impact of Airflow on Fire Growth...29
7.1.2 Impact of Airflow on Fire Plume...32
7.1.3 Impact of Airflow on Production and Spread of Smoke...36
7.1.4 Impact of Airflow on Visual View of Detectors...42
7.1.5 Impact of Airflow on Temperatures Produced by Fires ...43
7.1.6 Impact of Airflow on Response of Fire Detection Systems ...51
7.2 Open Pool Fires located behind A Large Vehicle ...57
7.2.1 Impact of Airflow on Fire Growth...60
7.2.2 Impact of Airflow on Fire Plume...62
7.2.3 Impact of Airflow on Production and Spread of Smoke...65
7.2.4 Impact of Airflow on Visual View of Detectors...68
7.2.5 Impact of Airflow on Temperatures Produced by Fires ...69
7.2.6 Impact of Airflow on Response of Fire Detection Systems ...75
7.3 Stationary Vehicle Fires...79
7.3.1 Impact of Airflow on Fire Characteristics ...82
7.3.2 Impact of Airflow on Response of Fire Detection Systems ...88
8. Summary ...90
1. INTRODUCTION
Fire incidents can occur in road tunnels with longitudinal airflow. The longitudinal airflow can be produced naturally due to meteorological conditions (e.g. wind effects) or as a result of the normal operation of the ventilation system. The longitudinal airflow can affect fire behaviour (fire growth rate, heat release rate, shape and tilt of fire plume, etc.) and smoke spread and hot gas distribution in the tunnel, which in turn affect the response of fire detectors/detection systems to a fire incident.
Most recent research on fires in tunnels has focused on the use of emergency ventilation systems for fire and smoke control [1-5]. Few test programs have been conducted to study the effect of airflow on the performance of tunnel fire detectors/detection systems. As a result, the effect of airflow on the response of fire detection systems was identified as an important issue to be investigated in Phase I of the International Road Tunnel Fire Detection Research Project [6].
This report provides the results of Task 7 of the International Road Tunnel Fire Detection Research Project (Phase II): Full-Scale Ventilated Fire Tests in a Laboratory Tunnel. The objective of Task 7 was to investigate the effect of longitudinal airflow on the performance of fire detectors/detection systems. It was assumed the fire detector/detection system would respond to a fire under normal tunnel ventilation conditions before the emergency ventilation system is operated. The other objective of the work was to study the fire behaviour, smoke spread and hot gas distribution produced under normal tunnel ventilation conditions. Longitudinal airflow is common in road tunnels. It can be produced by meteorological conditions, by traffic flow, or by the operation of the tunnel mechanical ventilation system to maintain air quality in the tunnel [7].
Nine fire detectors/detection systems that represented five types of fire detection technologies were evaluated in the test series under longitudinal airflow conditions in a laboratory research tunnel. These detection systems included: two linear heat detection systems, one optical flame detector, three video image detection (VID) systems, one smoke detection system and two spot heat detectors.
Information on the test tunnel, fire scenarios, fire detectors/detection systems and test instrumentation is provided. The fire characteristics produced under longitudinal airflow conditions, such as the fire growth rate, heat flux, temperature and smoke spread in the tunnel, are presented. The impact of airflow on the performance of the fire detectors/detection systems, including their response times, and their ability to locate and monitor a fire, is also reported.
2. TEST
TUNNEL
The full-scale fire tests were carried out in a new Carleton University laboratory research tunnel that is located at the site of the National Research Council (NRC) full-scale fire test facilities. The tunnel facility was 37.5 m long, 10 m wide and 5.5 m high. It has two end doors, one large side door that connected the tunnel to an adjacent burn hall at the West end of the tunnel, two side louvers at the East end of the tunnel, and a number of observation windows. It also has five ceiling openings located near the West end of the tunnel. They allow the air and smoke to vent through ducts and the fan system. A 3D view of the tunnel is shown in Figure 2.1. A detailed description of the tunnel was provided in the report for Task 2 of the project [8].
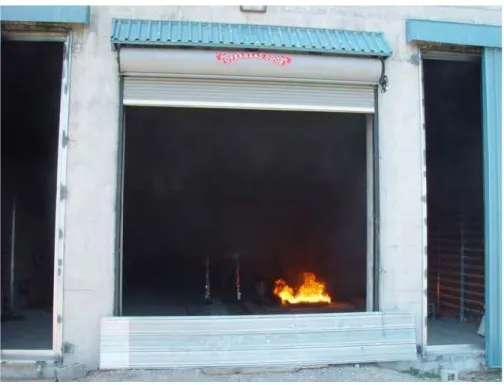
The door at the West end of the tunnel was closed. The door at the East end of the tunnel was open during the tests. The fire source was located near this open door in the test tunnel, simulating a fire incident at either the entrance or exit of the tunnel. This location presented a challenge for the visual-based detectors since the daylight outside the tunnel could affect the recognition of the fire in the tunnel. The large side door that was located far from the fire source was partially open with an opening width of 0.4 m to allow observation of the fire and access to the tunnel during the tests. Figure 2.2 shows the East end of the tunnel.
The mechanical fan system for the tunnel was operated during the tests. The air entered the tunnel through the open door at the East end of the tunnel and vented out the tunnel through the five ceiling openings near the West end of the tunnel. This provided a longitudinal airflow in the tunnel during the tests. Various air velocities were provided using the variable speed fan system. The maximum airflow speed near the fire source was approximately 3 m/s in the tests with full operation of the tunnel fan system. The distribution of air velocity in the tunnel was measured. The measurements and results are presented in Section 6 of this report.
Figure 3.1. Schematic of detector/detection system setup in the test tunnel
3.
FIRE DETECTION SYSTEMS AND TEST SETUP
Nine fire detectors/detection systems were evaluated in the test series. They were: two linear heat detection systems, one optical flame detector, three VID systems, one smoke detection system and two spot heat detectors.
The sensing cables of the two linear heat detection systems were installed on the ceiling of the tunnel to form a loop. The optical flame detector and three VID systems were installed on the North wall of the tunnel. Two types of spot heat detectors were installed along the center of the tunnel ceiling. The sampling pipe for the smoke detection system was also installed along the center of the tunnel ceiling. A schematic showing the setup of the detectors/detection systems in the tunnel is shown in Figure 3.1. [8].
East
Fiber optical cable (System D-1L1) and coaxial cable (System D-2L2) Flame detector (System D-3F1)
VID flame and smoke detector (System D-4C1) VID flame detector (System D-5C2)
VID flame detector (System D-6C3) Spot heat detector (System D-7H1)
Rate-anticipation heat detector (System D-8H2) Smoke detection system (System D-9S1)
The sensitivity levels of five fire detectors/detection systems in the test series were the same as used in Task 2 of the project. However, the sensitivity levels of the linear heat detection system D-2L2, the optical flame detector D-3F1, the flame/smoke VID D-4C1, and the function of VID D-5C2 were modified by the system suppliers, based on their performance in the environmental tests conducted in the Lincoln Tunnel and the results of Task 2.
The fixed fire alarm temperature of the linear heat detection system D-2L2 remained at 70oC. Its rate of temperature rise criteria for fire alarm was lowered to 7oC/min from the 10oC/min used in Task 2 of the project.
The sensitivity level of the optical flame detector D-3F1 was decreased to medium level from the high level used in Task 2 of the project. In order to determine the effect of the change in sensitivity level on the detection performance of the detector, a detector with a high sensitivity level was also installed and used in the tests. The response times to the same test fire were recorded and are listed in the report.
The sensitivity level of the flame/smoke VID D-4C1 was not changed during the tests, but a 30 s pre-alarm period was added prior to an alarm, once a fire signal was received by the system. The pre-alarm period was used to validate if the signal was a real fire alarm or a nuisance alarm.
The system supplier added a new fire detection function, based on smoke characteristics produced by fires, to VID D-5C2. System D-5C2 was converted to be a flame and smoke VID system from the flame detection system used in Task 2 of the project. It responded to a fire incident, once the characteristics of flame and smoke produced in a fire incident were identified.
General information on the detectors and systems used in the tests is summarized in Table 3.1.
Table 3.1. Fire Detection Systems in Test Program
Technology System no.
System information Alarm threshold Detector
location
D-1L1 Fiber optic linear heat detection
Level 1: 50oC, 10oC/min; Level 2: 100oC, 15oC/min;
Two parallel cables in the tunnel, 2.5 m from the wall Linear heat
D-2L2 Analogue (co-axial cable) linear heat detection system
Fixed Temp: 70oC, Rate of rise: 7oC/min;
Two parallel cables in the tunnel, 2.5 m from the wall Flame D-3F1 IR3 flame detector Sensitivity: medium (0.3 m
x 0.3 m n-heptane fire at 30.5 m on-axis).
30 m from the fire source and 4.3 m from ground D-4C1 Visual flame and smoke
detector
Flame: low (25%); Offsite: 50% Smoke: normal Pre-alarm period: 30 s
30 m from the fire source and 4.8 m from ground D-5C2 Visual flame and smoke
detector
Intensity: 60 Mean crossing: 4
Inten. standard deviation: 16 Flicker mask counter: 16
30 m from the fire source and 4.6 m from ground VID
D-6C3 Visual flame detector Sensitivity: 10 kW fire at 30m.
30 m from the fire source and 4.2 m from ground D-7H1 Heat detector with a fixed
temperature
79.5oC fast response bulbs 3 m spacing at the center of tunnel ceiling
Spot heat
D-8H2 Rate-anticipation heat detector
Fixed Temp: 57.2oC 15.2 m spacing at the center of tunnel ceiling
Smoke D-9S1 Air sampling system Fire threshold: 0.203%/m Air sampling line at the center of tunnel ceiling
4. INSTRUMENTATION
The same instrumentation used in Task 2 of the project was used in Task 7. The instrumentation used in the tests included thermocouples, heat flux meters, smoke meters, velocity meters and video cameras, as shown in Figure 4.1. The location of each device in the tunnel is shown in Figure 4.2. A detailed description of the instrumentation was provided in the report for Task 2 [8].
Fifty-five thermocouples were distributed at the ceiling of the tunnel and two thermocouple trees were located in the tunnel: one near the fire location and the other at the center of the tunnel. Five heat flux meters were distributed in the tunnel to monitor fire development. Three smoke meters were located at the center of the tunnel: one smoke meter was positioned near the tunnel ceiling and two smoke meters were used to measure the smoke optical density at the middle and lower portion of the tunnel. A hand held velocity meter was used to measure the air velocity in the tunnel. A video camera was located inside the tunnel near the position of the VID systems. It was used to monitor fire conditions in the tunnel. A video camera was located outside the tunnel viewing the tunnel through one of the observation windows. It was used to monitor the fire conditions and provided a side view of the fire.
The location of the instrumentation was not changed in the test series. The test data together with outputs of the detectors/detection systems were collected at 1 s intervals by a data acquisition system (Figure 4.1c). The response of the second optical flame detector D-3F1 with high sensitivity was collected separately using an OM-DAQPRO-5300 Portable Handheld Data logger due to limitations of the main data acquisition system.
Figure 4.1a). Velocity meter Figure 4.1b). Heat flux
Figure 4.1c). Data Collection system
Figure 4.1d). Smoke meters
Figure 4.1e). Video Camera Figure 4.1f). Thermocouple
5. TEST
PROCEDURE
The general test procedure used in the test series was as follows:
• Set up the test;
• Checked instrumentation and each detection system prior to the test; • Activated fan systems;
• Measured air velocities around the mock-up;
• Started the data acquisition system and video recorders for a 60-s baseline; • Ignited the fire
•
Terminated the test once the fuel in the pan was burnt out and the fire was self extinguished;•
Checked each detection system to determine if they still functioned properly after the fire test.Figure 6.1. The setup of the door and the two side louvers at air velocity of 1.5 m/s
6.
VENTILATION SETUP AND AIR FLOW MEASUREMENT
The longitudinal airflow in the tunnel was produced by operating the fan system mounted in the tunnel facility with appropriate setup of the tunnel openings. The tunnel intakes were modified during the tests to ensure the airflow was uniform in the tunnel and the targeted air velocity was achieved. The air velocity and its distribution in the tunnel were measured in a series of non-fire tests.
For the targeted air speed of 1.5 m/s in the tunnel, the door at the East end of the tunnel was partially opened. A section of the opening was blocked with a 1 m wide by 5 m long steel plate, which produced more airflow in the upper section of the tunnel. The opening area of the door was 3.8 m wide by 2.67 m high. The two side louvers next to the door were open during the tests. The setup of the East door and the side louvers for the tests with the 1.5 m/s air speed is shown in Figure 6.1.
In order to achieve the targeted air velocity of approximately 3 m/s at the fire source, the side louver at the south side of the door was closed. The setup of the door and the side louver at the north side of the door were the same as the 1.5 m/s air speed.
The airflow distribution in the tunnel was measured using an air velocity measuring tree (Figure 6.2). There were seven meters on the tree spaced at 0.6 m intervals starting 0.8 m above the ground. Each air velocity meter was calibrated in an air tunnel prior to the tests. An OM-DAQPRO-5300 Portable Handheld Data logger collected the data at a 1 s interval. A detailed description of the air velocity measuring tree will be published separately.
The measurements of the air velocity in the tunnel were conducted by placing the air velocity measuring tree at the thirty-nine predetermined points in the tunnel shown in Figure 6.3.
5 m 8.75 m 1.23 m 1.23 m 9.38 m 2.5 m 37.5 m 10 m NW SW NE SE Measuring point
Air Velocity (m/s) 0.0 0.5 1.0 1.5 2.0 T u nn el E le v atio n (m ) 0 1 2 3 4 5
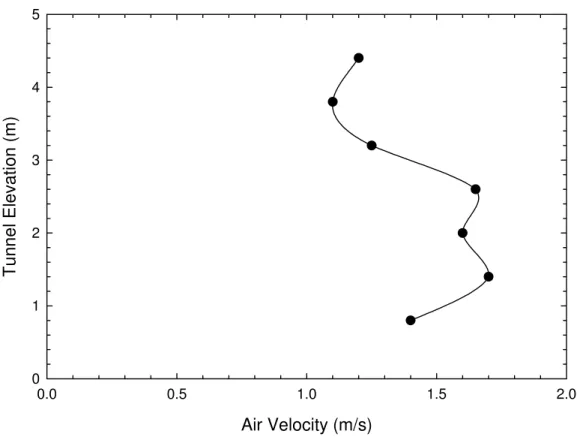
Figure 6.4. Variation of air velocity with elevation near the fire location, when targeted velocity in the tunnel was 1.5 m/s.
Figure 6.4 shows the variation in air velocity with elevation near the fire location, when the air velocity in the tunnel was targeted at 1.5 m/s. Test results demonstrated that the air velocity was approximately 1.4 m/s near the ground and was 1.6 m/s at the mid-height of the tunnel. The air velocity in the upper portion of the tunnel was lower than in the lower portion of the tunnel. The average air velocity near the fire location was approximately 1.5 m/s.
Figures 6.5 and 6.6 show the distribution of air velocity across the tunnel near the fire location and along the centreline of the tunnel, when the air velocity in the tunnel was targeted at 1.5 m/s. Test results suggested that the airflow was distributed relatively uniformly in the tunnel. The air velocity in the North section of the tunnel where the fire source was placed was slightly higher than in the South section of the tunnel. The air velocity did not change significantly along the centerline of the tunnel. The variation of air velocity across the tunnel at different locations in the tunnel was similar to that near the fire location.
Figure 6.5. Air velocities across the tunnel near the fire location
Figure 6.6. Air velocities along the centerline of the tunnel
Tunnel distance from north wall of tunnel (m)
0 2 4 6 8 10 Air Ve loc ity ( m /s ) 0.0 0.5 1.0 1.5 2.0 2.5 3.0 0.8 m 2.6 m 4.4 m measuring point above ground
Tunnel distance from east end of tunnel (m)
0 5 10 15 20 25 30 35 Air Velocit y (m/ s ) 0.0 0.5 1.0 1.5 2.0 2.5 3.0 0.8 m 2.6 m 4.4 m measuring point above ground
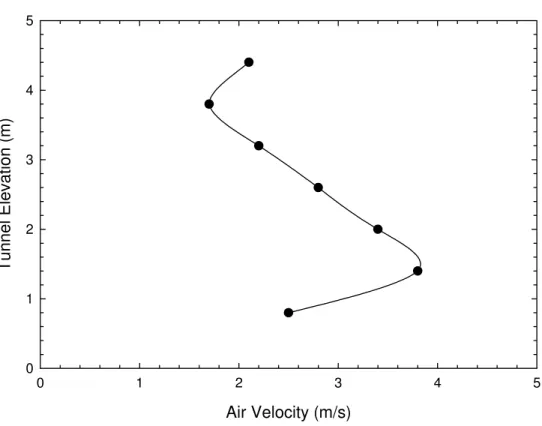
Figure 6.7. Variation of air velocity with elevation near the fire location, when the targeted velocity in the tunnel was 3 m/s.
Figure 6.7 shows the variation in air velocity with elevation near the fire location, when the air velocity in the tunnel was targeted at 3.0 m/s. The air velocity was close to 3 m/s near the ground. In the lower portion of the tunnel, the airflow velocity increased with an increase in elevation. The air velocity in the upper portion of the tunnel was lower than 3 m/s and it decreased with an increase in elevation.
With the limited length of the test facility, it was necessary to locate the fire near the entrance where there was considerable disturbance in the airflow into the tunnel due to the shape of the entrance. Limited efforts were made to limit the effects of the turbulent airflow on the airflow distribution in the tunnel.
Test results also suggested that the distribution of the airflow and its velocity in the tunnel was affected by the weather conditions and wind direction outside the tunnel. In order to ensure that the targeted air velocity in the tunnel was achieved in the test, the air velocity around the fire source was measured prior to the start of each fire test and adjustments to the tunnel openings was made, if required.
Air Velocity (m/s) 0 1 2 3 4 5 T u nn el E leva tio n (m ) 0 1 2 3 4 5
7.
FIRE TESTS AND RESULTS
Fifteen full-scale fire tests were conducted in the laboratory tunnel. Three types of tunnel fire scenarios were selected and used in the test series, based on the non-ventilated tests with minimal airflow conducted in Task 2 of the project. The fire scenarios included gasoline pool fires located underneath a simulated vehicle, gasoline pool fires located behind a simulated large vehicle, and a fire with a wood crib and polyurethane foam located inside the passenger compartment of a simulated stationary vehicle. The fire sizes varied from approximately 650 kW to 3,400 kW when measured using a calorimeter with natural airflow. The setup of the fire scenarios in the test series were the same as used in Task 2 of the project. A detailed description of the fire scenarios and their setup were provided in the report for Task 2 [8].
The targeted air velocities in the tunnel were: 0 m/s, 1.5 m/s and 3 m/s. The air velocity at the fire source was measured prior to the start of each fire test.
The location of the fire source in the tunnel was the same as that used in Task 2 of the project. It was 6.5 m from the East end of the tunnel and 2.5 m from the North wall of the tunnel. At this location, the fire source was located below the sensing cables of Systems D-1L1 and D-2L2, 30 m from the optical flame detector and VID systems (Systems D-3F1 to D-6C3), approximately 3 m from the nearest sprinkler of System D-7H1, approximately 7.5 m from the nearest spot heat detector of System D-8H2 and approximately 4 m from the nearest sampling hole of System D-9S1.
The fire size, location, growth rate and airflow speed and direction used in the test series presented a challenge to the fire detectors/detection systems. The effect of airflow on the fire behaviour, such as the fire growth rate, temperature and smoke spread in the tunnel, were investigated. The response time of each detector/detection system under various airflow conditions were recorded. The capability of the detection systems to locate and monitor the fire incident was also evaluated.
Due to the delay in the arrival of the test equipment, System D-1L1 missed Test V1 to Test V9, and System D-2L2 missed Test V1 to Test V4. However, an additional three tests (Tests V13 to V15) were conducted for these systems.
7.1. Pool Fires Located underneath Vehicle
The pool fires located underneath a simulated vehicle were designed to simulate a fire incident in which two vehicles crashed and fuel leaked from one of the vehicles and formed a pool fire underneath the vehicle. The setup of the fire scenario for a pool fire located underneath a vehicle is shown in Figure 7.1. A fuel pan was placed underneath a simulated vehicle. The mockup had the same footprint (1.5 m wide by 2.4 m long) as the bottom area of a standard passenger vehicle. The gap between the bottom of the simulated vehicle and the ground was 0.3 m. A plate with a size of 1.5 m wide by 1.2 m high, simulating a crashed car located between the fire source and the wall-mounted detectors, was placed 1.5 m in front of the fire source and 0.3 m above the ground. The setup of the fire scenario was the same as used in Task 2 of the project [8]. Results from Task 2 showed that it was a challenge for fire detectors/detection systems to detect the fire located underneath the vehicle, and the vehicle body located above the pool fire had a substantial impact on the combustion during the fire.
Five fire tests with three airflow speeds of 0 m/s, 1.5 m/s, 3 m/s were conducted using a 0.36 m2 gasoline pool fire located underneath the vehicle. Test V-1 with an airflow speed of 0 m/s was a repeat of a test conducted in Task 2 [8], in which the door at the East end of the tunnel was closed and minimal airflow was maintained in the tunnel. The other two tests, V-2 and V-3, were conducted at two different airflow velocities and the door at the East end of the tunnel was open. Tests V-13 and V-14 were duplicates of Tests V-2 and V-3 conducted for Systems D-1L1 and D-2L2. The other detectors/detection systems were not used in these two tests.
Tests with a 1.0 m2 gasoline pool fires located underneath a simulated vehicle were conducted using an average airflow speeds of 1.5 m/s and 3 m/s in the tunnel. Similar tests were conducted using a 2.0 m2 gasoline pool fire.
The air velocities around the simulated vehicle were measured prior to each test. For the targeted air velocity of 1.5 m/s in the tunnel, the air velocity varied from 1.4 m/s to 1.7 m/s upstream of the vehicle and 0.9 m/s to 1.1 m/s downstream of the simulated vehicle due to blockage by the vehicle body. For the targeted air velocity of 3 m/s in the tunnel, the air velocity varied from 2.8 m/s to 3.3 m/s upstream of the vehicle and 1.9 m/s to 2.1 m/s downstream of the simulated vehicle.
The test conditions and results with the fire located underneath the vehicle are listed in Table 7.1. The heat release rates listed in the table were measured using an open calorimeter facility [8]. The actual heat release rates produced in the tests could be different, because of the existence of the vehicle body above the fuel and ventilation conditions.
RESPONSE TIME OF DETECTORS/DETECTION SYSTEMS D-3F1 (s) FIRE SCENARIO TEST NO FUEL PAN (M) FUEL TYPE HEAT RELEASE RATE (kW) AIRFLOW SPEED (m/s) D-1L1 (s) D-2L2 (s) H* M* D-4C1 (s) D-5C2 (s) D-6C3 (s) D-7H1 (s) D-8H2 (S) D-9S1 (S) V-1 0.6 x 0.6 Gasoline ~ 650 0 N/P* N/P* 9 46 46 44 N/R* N/R* N/R* 51 V-2 0.6 x 0.6 Gasoline ~ 650 ~ 1.5 N/P N/P 13 N/R 103 45 N/R N/R N/R 147 V-3 0.6 x 0.6 Gasoline ~ 650 ~ 3.0 N/P N/P 11 88 N/A* 40 N/R N/R N/R 156 V-4 1.0 x 1.0 Gasoline ~ 1700 ~ 1.5 N/P N/P 6 15 50 31 N/R 40 27 39 V-5 1.0 x 1.0 Gasoline ~ 1700 ~ 3.0 NP N/P 4 50 48 18 24 100 33 45 V-12 1.0 x 2.0 Gasoline ~ 3400 ~ 1.5 23 18 7 13 45 18 N/R 57 35 52 V-10 1.0 x 2.0 Gasoline ~ 3400 ~ 3.0 N/P 17 7 12 42 17 N/R 88 38 43 V-13 0.6 x 0.6 Gasoline ~ 650 ~ 1.5 64 51 N/P N/P N/P N/P N/P N/P N/P N/P Pool fires under the vehicle V-14 0.6 x 0.6 Gasoline ~ 650 ~ 3.0 118 64 N/P N/P N/P N/P N/P N/P N/P N/P Note:
• N/P*: no participation in the test • N/R*: no response in the test
• N/A*: no data available in the test due to malfunction of the device • H*: optical flame detector D-3F1 with very high sensitivity
• M*: optical flame detector D-3F1 with medium sensitivity • The systems listed in the table are:
1) D-1L1: Linear fiber optic heat detection system 2) D-2L2: Linear analogue heat detection system 3) D-3F1: Optical flame detector
4) D-4C1: VID flame/smoke detector 5) D-5C2: VID flame/smoke detector 6) D-6C3: VID flame detector
7) D-7H1: Spot heat detector 8) D-8H2: Spot heat detector 9) D-9S1: Smoke detection system
7.1.1 Impact of Tunnel Airflow on Fire Growth
Table 7.2 lists the burning time of the fuel for the tests with a pool fire located underneath a simulated vehicle. The burning time, defined as the time interval from ignition to the extinction of the fire in the pan, was determined using the video records for the tests.
Test results showed that for the same amount of fuel in the pan, the burning time was reduced with an increase in the airflow speed in the tunnel. The burning time of 5 L of gasoline in the 0.36 m2 pan was approximately 344 s under non-ventilated condition. It was reduced to 290 s with an airflow speed of 1.5 m/s and to 260 s with an airflow speed of 3 m/s. The fuel burning time of 40 L of gasoline in the 2.0 m2 pan was 305 s with an airflow velocity of 3 m/s and 315 s with an airflow velocity of 1.5 m/s. The impact of airflow on the fuel burning time decreased with an increase in the pool size.
Table 7.2. Burning Time of Fuel in Tests with Fire Located underneath Vehicle
Test No Pan Size (m) Fuel in Pan (L) Airflow Speed
(m/s) Burning Time (s) V-1 0.6 x 0.6 5 0 344 V-2 0.6 x 0.6 5 ~ 1.5 290 V-3 0.6 x 0.6 5 ~ 3.0 260 V-4 1.0 x 1.0 25 ~ 1.5 205 V-5 1.0 x 1.0 25 ~ 3.0 200 V-12 1.0 x 2.0 40 ~ 1.5 315 V-10 1.0 x 2.0 40 ~ 3.0 305
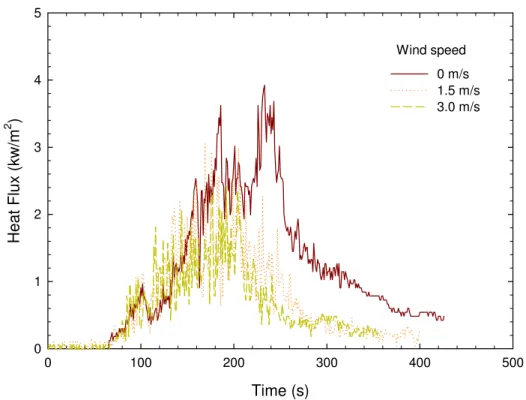
Figures 7.2 through 7.4 show the impact of airflow velocity on the heat flux produced by three fires of different sizes located underneath the vehicle. The heat flux was measured 1 m from the fire source. The heat fluxes produced by two large fires located underneath the vehicle were also compared with those produced under non-ventilation conditions in tests conducted in Task 2.
Test results showed that the heat fluxes produced by a 0.36 m2 fire measured 1 m from the fire source decreased with an increase in airflow speed in the tunnel. This may be attributed to the fact that the airflow tilted the flames away from the heat flux meter. The heat fluxes produced by the two larger fires with a 1.5 m/s longitudinal airflow, particularly by the 2 m2 fires, were higher than those produced under non-ventilated conditions. The heat fluxes decreased with the airflow speed at 3 m/s. For large fires, an airflow velocity higher than 1.5 m/s was required to tilt the flames. The fuel burning times, as shown in Figures 7.3 and 7.4, were shorter than those under non-ventilated conditions. This suggests that the longitudinal airflow enhanced the burning rate for the large fires located underneath the vehicle, resulting in an increase in fire growth rate and fire size.
Time (s) 0 50 100 150 200 250 300 350 400 450 H eat Flux (k w /m 2 ) 0 5 10 15 20 25 30 0 m/s (data of Task 2) 1.5 m/s 3 m/s Air velocity
Figure 7.2. Heat flux measured at 1 m from a 0.36 m2 fire located underneath a vehicle at different airflow velocities
Figure 7.3. Heat flux measured at 1 m from a 1.0 m2 fire located underneath a vehicle
Time (s) 0 100 200 300 400 500 Heat Flux (k w /m 2 ) 0 1 2 3 4 5 0 m/s 1.5 m/s 3.0 m/s Wind speed
Time (s) 0 50 100 150 200 250 300 350 400 450 Heat Flux (kw /m 2 ) 0 10 20 30 40 50 0 m/s (data of Task 2) 1.5 m/s 3 m/s Air velocity
Figure 7.4. Heat flux measured at 1 m from a 2.0 m2 fire located underneath a vehicle at different airflow velocities
7.1.2 Impact of Tunnel Airflow on Fire Plume
Figures 7.5 to 7.11 show photos from three pool fire tests with the fire located underneath the vehicle with different airflow speeds. The photos were taken from the side and front of the fire. The photos show that the effect of airflow velocity on the fire development and smoke spread was dependent on the airflow speed and the fire size.
When there was no airflow in the tunnel, the fire plume produced from a 0.36 m2 fire plume was vertical at the front and two sides of the vehicle (Figure 7.5a), and the tip of the flame could be observed from the front of the obstacle (Figure 7.5b) in Test V-1. With airflow in the tunnel, the fire plume was blown towards the downstream end of the vehicle. The fire plume was enlarged with the airflow speed at 1.5 m/s compared with 0 m/s, as shown in Figures 7.5 and 7.6. When the airflow speed was 3 m/s, the fire plume became unstable and short, as shown in Figure 7.7.
The flames and smoke produced by the 0.36 m2 fire located underneath the vehicle was difficult to see from the front of the fire under longitudinal airflow conditions, as shown in Figures 7.6b and 7.7b, since the fire plume was tilted and shielded by the obstacle. The daylight outside the tunnel also reduced visibility. This scenario presented a challenge for those detectors that responded to the fire based on the visual characteristics of flame and smoke.
The fire plumes produced by 1.0 and 2.0 m2 fires located underneath the vehicle were much larger than those produced by a 0.36 m2 fire (Figures 7.8 to 7.11). The plume was tilted towards the ground by the airflow. The fire plume became unstable at high airflow speeds. However, the impact of airflow on the fire plume was reduced with an increase in fire size. As shown in Figures 7.6a, 7.8a and 7.10a at the same airflow speed in the tunnel, the angle of the fire plume relative to the ground increased with an increase in the fire size.
The size of the fire plume and smoke optical density also increased with an increase in fire size located underneath the vehicle. The flames and smoke produced by large pool fires could be clearly identified from the front of the obstacle, as shown in Figures 7.8 to 7.11. The light from outside the tunnel did not affect visibility.
Figure 7.5. A 0.36 m2 gasoline pool fire located underneath the vehicle with 0 m/s airflow velocity
Figure 7.6. A 0.36 m2 gasoline pool fire located underneath the vehicle with 1.5 m/s airflow velocity
Figure 7.7. A 0.36 m2 gasoline pool fire located underneath the vehicle with 3 m/s airflow velocity
a. side view b. front view
b. front view a. side view
Figure 7.8. A 1.0 m2 gasoline pool fire located underneath the vehicle with 1.5 m/s airflow velocity
Figure 7.9. A 1.0 m2 gasoline pool fire located underneath the vehicle with 3 m/s airflow velocity a. side view
a. side view b. front view
Figure 7.10. A 2.0 m2 gasoline pool fire located underneath the vehicle with 1.5 m/s airflow velocity
Figure 7.11. A 2.0 m2 gasoline pool fire located underneath the vehicle with 3 m/s airflow velocity a. side view
a. side view
b. front view
Figure 7.12. Smoke density measured at the middle of the tunnel for a 0.36 m2 fire located underneath a vehicle with minimal airflow.
7.1.3 Impact of Tunnel Airflow on Production and Spread of Smoke
During the tests with the pool fires located underneath the vehicle, smoke optical densities were measured at the middle of the tunnel at three elevations.As shown in Figures 7.12 and 7.13, the longitudinal airflow had a significant impact on the smoke production and its distribution in the tunnel for a 0.36 m2 fire located underneath the vehicle. Under non-ventilated conditions, the smoke optical density near the ceiling of the tunnel quickly increased with time but the smoke in the lower portion of the tunnel accumulated much later as the hot smoke layer gradually descended (Figure 7.12). With longitudinal airflow in the tunnel, the spread of smoke in the tunnel was changed. The smoke was blown down the tunnel and quickly filled the entire tunnel downstream of the fire. The smoke accumulated in the upper and lower portions of the tunnel at the same time (Figure 7.13).
Figure 7.14 compares the variation in smoke optical density 150 mm below the ceiling produced by the 0.36 m2 fire at three airflow speeds. The smoke optical density near the ceiling of the tunnel decreased with an increase in airflow speed.
Time (s) 0 100 200 300 400 500 Smok e De ns ity ( O D/m ) 0.0 0.2 0.4 0.6 0.8 1.87 m 2.5 m 5.35 m
Figure 7.13. Smoke optical density measured at the middle of the tunnel for a 0.36 m2 fire located underneath a vehicle with an airflow speed of 1.5 m/s
Figure 7.14. Smoke density measured 150 mm below the tunnel ceiling for a 0.36 m2 fire located underneath a vehicle at three airflow speeds.
Time (s)
0 100 200 300 400 500
S
m
oke Density (OD/m
) 0.00 0.02 0.04 0.06 0.08 0.10 0.12 0.14 0.16 1.87 m 2.5 m 5.35 m Measuring point from ground
Time (s) 0 100 200 300 400 500 Smok e D e n s ity (O D/m) 0.0 0.2 0.4 0.6 0.8 0 m/s 1.5 m/s 3 m/s air velocity
Figure 7.15. Smoke density measured at the middle of the tunnel for a 1.0 m2 fire located underneath a vehicle with an airflow speed of 1.5 m/s
Figure 7.15 shows the smoke optical density produced by a 1.0 m2 fire located underneath the vehicle at an airflow speed of 1.5 m/s. Compared to the smoke optical density produced by a 0.36 m2 fire with the same airflow speed (Figure 7.13), the smoke in the upper and lower portions of the tunnel accumulated at almost the same time but the smoke optical density near the ceiling was higher than in the lower portion of the tunnel. The results indicate that the impact of the airflow on smoke spread was reduced with an increase in fire size. This was consistent with the changes in fire plume under airflow conditions.
Figure 7.16 compares the smoke optical density measured 150 mm below the ceiling produced by a 1.0 m2 fire at three airflow speeds. It shows not only that the fuel burning time under airflow conditions was much shorter than that under non-ventilated conditions, but also the smoke optical density near the ceiling under airflow conditions was higher than that under non-ventilated conditions, as the burning rate of the fire located underneath the vehicle was increased.
Time (s) 0 50 100 150 200 250 300 350 Smok e D e n s ity (O D/m) 0.0 0.2 0.4 0.6 0.8 1.0 1.2 1.87 m 2.5 m 5.35 m
Figure 7.16. Smoke density measured 150 mm below the tunnel ceiling for a 1.0 m2 fire located underneath a vehicle at three airflow speeds.
Time (s) 0 100 200 300 400 500 S m oke De nsi ty ( O D /m) 0.0 0.2 0.4 0.6 0.8 1.0 1.2 1.4 1.6 0 m/s (data of Task 2) 1.5 m/s 3 m/s Air velocity
Time (s) 0 50 100 150 200 250 300 350 400 450 Smok e De ns ity ( O D/m) 0.0 0.2 0.4 0.6 0.8 1.0 1.2 1.4 1.6 1.8 2.0 1.87 m 2.5 m 5.35 m
Measuring point from ground
ignition
Figure 7.17. Smoke optical density measured at the middle of the tunnel for a 2.0 m2 fire located underneath a vehicle at an airflow speed of 1.5 m/s
Figure 7.17 shows the smoke optical density produced by a 2.0 m2 fire located underneath the vehicle at an airflow speed of 1.5 m/s. The development of the smoke in the tunnel was similar to that produced by a 1.0 m2 fire, but there was a larger difference in the smoke optical density in the upper and lower portions of the tunnel with the 2.0 m2 fire.
Figure 7.18 also shows that the smoke optical density produced by a 2.0 m2 fire under airflow conditions was much higher than that under non-ventilated conditions. The increase in the smoke optical density, however, was limited when the air velocity was increased to 3 m/s. These results were consistent with the changes in heat fluxes produced by the fires.
Time (s) 0 50 100 150 200 250 300 350 400 450 500 Smoke D ensi ty ( OD /m) 0.0 0.5 1.0 1.5 2.0 2.5 0 m/s (data of Task 2) 1.5 m/s 3 m/s Air velocity ignition
Figure 7.18. Smoke optical density measured 150 mm below the tunnel ceiling for a 2.0 m2 fire located underneath a vehicle with three airflow speeds.
7.1.4 Impact of Tunnel Airflow on Visual View of Detectors
The smoke produced by the fire under the longitudinal airflow conditions used in the tests was directly blown toward the fire detectors mounted on the sidewall of the tunnel. As a result, the visibility of the fire from the detector location could be obscured. The available visibility time for the wall mounted detectors was defined as the time interval from the ignition to the time when the visibility of the fire was totally lost, as a result of the spread of smoke in the tunnel. The visibility time was determined, based on visual images provided from the VID D-5C2 mounted at the North wall of the tunnel. The available times at different airflow speeds are listed in Table 7.3.
Table 7.3. Available Visibility Time in Tests with Fire Located underneath Vehicle
Test No Pan Size (m) Fuel in Pan (L) Airflow Speed
(m/s)
Visibility Time (s)
V-1 0.6 x 0.6 5 0 Available in entire test
V-2 0.6 x 0.6 5 ~ 1.5 Available in entire test
V-3 0.6 x 0.6 5 ~ 3.0 Available in entire test
V-4 1.0 x 1.0 25 ~ 1.5 ~122
V-5 1.0 x 1.0 25 ~ 3.0 ~70
V-12 1.0 x 2.0 40 ~ 1.5 ~98
V-10 1.0 x 2.0 40 ~ 3.0 ~70
Test results showed that the visibility for the detectors for a 0.36 m2 fire in the tunnel decreased under longitudinal airflow conditions but there was still sufficient visibility for the detectors to monitor the fire during the entire test at all airflow speeds. The smoke produced by the small fire was limited and was quickly vented from the tunnel through the openings in the ceiling.
When the fire size was increased to a 1.0 m2 fire, the visibility in the tunnel was quickly lost. The available time with visibility decreased with a further increase in fire size as well as with an increase in airflow speed. As listed in Table 7.3, the visibility time decreased to 98 s from 122 s with an increase in fire size from a 1.0 m2 pan to a 2.0 m2 pan with an airflow speed of 1.5 m/s. When the airflow speed increased to 3 m/s from 1.5 m/s, the visibility time for a 1.0 m2 fire located underneath the vehicle was reduced to 70 s. The rapid decrease in visibility under airflow conditions presented a challenge for the detectors that responded to the fire based on visual flame and smoke images.
Figure 7.19. Ceiling temperatures measured at Thermocouple #33 at center of the tunnel ceiling with a 0.36 m2 gasoline pan fire at three airflow velocities
7.1.5 Impact of Tunnel Airflow on Temperatures Produced by Fires
Figures 7.19 to 7.21 show the variation in ceiling temperature produced by three sizes of pool fires located underneath the vehicle at three different airflow velocities. The ceiling temperature was measured by thermocouple #33 that was located at the center of the tunnel and approximately 3 m away from the fire source (see Figure 4.2).Test results showed that the ceiling temperature produced by the small 0.36 m2 fire decreased with an increase in airflow velocity in the tunnel (Figure 7.19). The maximum ceiling temperature measured by thermocouple #33 for the 0.36 m2 fire was reduced to 45oC from 63oC when the airflow velocity was increased from 0 m/s to 3 m/s. The initial increase in the ceiling temperature was also delayed with an increase in airflow velocity.
The ceiling temperatures produced by the two large pool fires showed different trends than the small pool fire under airflow conditions (Figures 7.20 and 21). The ceiling temperatures produced by the 1.0 m2 fire at 1.5 m/s and by the 2.0 m2 fire with airflow velocities of 1.5 m/s and 3 m/s were higher than those produced under non-ventilated conditions as the burning rate of the fire increased. However, the ceiling temperatures decreased when the airflow velocity was increased to 3 m/s. In addition, the time to reach the maximum ceiling temperature under airflow conditions was shorter than those under non-ventilated conditions.
Time (s) 0 100 200 300 400 500 Ce iling T e mp eratu re ( o C) 20 30 40 50 60 70 80 0 m/s 1.5 m/s 3.0 m/s fire ignition Air Velocity
Figure 7.21. Ceiling temperatures measured at Thermocouple #33 at center of the tunnel Time (s) 0 100 200 300 400 500 Te mpe ratur e ( o C) 0 50 100 150 200 0 m/s (data of task 2) 1.5 m/s 3 m/s Ignition air velocity
Figure 7.20. Ceiling temperatures measured at Thermocouple #33 at center of the tunnel with a 1.0 m2 gasoline pan fire at three airflow velocities
Time (s) 0 100 200 300 400 500 T e mper atur e ( o C) 0 20 40 60 80 100 120 140 160 180 0 m/s (data of task 2) 1.5 m/s 3 m/s Ignition air velocity
Figure 7.22. Maximum ceiling temperatures measured at the center of the tunnel with a 0.36 m2 gasoline pan fire with three airflow velocities
Figure 7.22 shows the variation in the maximum ceiling temperatures along the centerline of the tunnel that was produced by a 0.36 m2 pool fire located underneath the vehicle at three airflow velocities. It shows that the ceiling temperatures decreased with an increase in airflow speed. The drop in ceiling temperature upstream of the fire source was significant. The hot spot at the ceiling was also shifted downstream of the fire source under longitudinal airflow conditions. The shift of the hot spot was approximately 5 m at an airflow speed of 1.5 m/s, but did not shift further downstream when the airflow speed was 3 m/s. This was consistent with experimental observations that indicated the fire plume produced by a 0.36 m2 pool fire became short and unstable, and was pushed down very close to the ground at high airflow speeds.
Distance from east end of the tunnel (m)
0 5 10 15 20 25 30 C e ili ng Te mp er atu re ( o C) 10 20 30 40 50 60 70 80 0.0 1.5 3.0 Air velocity (m/s) fire location
Figure 7.23. Maximum ceiling temperatures measured at the center of the tunnel with a 1.0 m2 gasoline pan fire with three airflow velocities
Figure 7.23 shows the maximum ceiling temperatures along the centerline of the tunnel at three airflow velocities for a 1.0 m2 pool fire located underneath the vehicle. The ceiling temperatures upstream of the fire decreased with an increase in airflow velocity. However, the ceiling temperatures downstream of the fire source produced at an airflow velocity of 1.5 m/s were higher than those under non-ventilated conditions, as the burning rate of the fire was increased. When the airflow speed was further increased to 3 m/s, the ceiling temperature decreased and was lower than under non-ventilated conditions.
The hot spot at the ceiling was shifted downstream of the fire source under airflow conditions. The hot spot shifted from the fire location with an increase in airflow speed. The maximum distance that the hot spot was shifted at an airflow velocity of 3 m/s was approximately 6 m.
Distance from East end of the tunnel (m)
0 5 10 15 20 25 30 Ceilin g T em pera ture ( o C) 0 20 40 60 80 100 120 140 160
0 m/s* (data from Task 2) 1.5 m/s
3 m/s Air speed
Distance from East end of the tunnel (m) 0 5 10 15 20 25 30 Ceiling Temperatur e ( o C) 0 20 40 60 80 100 120 140 160 180 200
0 m/s* (data from Task 2) 1.5 m/s
3 m/s Air speed
fire location
Figure 7.24. Maximum ceiling temperatures measured at the center of the tunnel with a 2.0 m2 gasoline pan fire with three air velocities
The ceiling temperatures produced by a 2 m2 fire located underneath the vehicle also demonstrated a different trend than for the small fires. As shown in Figure 7.24, the ceiling temperatures produced by the fire at both airflow speeds were much higher than those produced under non-ventilated conditions, as the airflow in the tunnel increased the fire size. The increase in airflow velocity from 1.5 m/s to 3 m/s also resulted in a decrease in the ceiling temperature. The hot spot shifted from the fire location with an increase in airflow velocity. However, the shift was less than those with small fires, since the impact of airflow on the fire plume was reduced with an increase in fire size. The distance the hot spot was shifted at an airflow speed of 3 m/s was approximately 4 m.
Figure 7.25. Maximum ceiling temperatures across the tunnel 3 m downstream of the fire with three pool fires and two airflow velocities
Figure 7.25 shows the variation of the maximum ceiling temperatures across the tunnel produced by three sizes of pool fires located underneath the vehicle at two airflow velocities. The temperatures were measured approximately 3 m downstream of the fire location. The ceiling temperatures decreased with an increase in airflow velocity. The ceiling temperatures in the North section of the tunnel where the fire source was located were generally higher than those in the South portion of the tunnel.
Distance from north wall of tunnel (m)
1 2 3 4 5 6 7 8 9 Ceilin g temper atur e ( o C) 20 40 60 80 100 120 140 160 180 200 220 240 0.36 m2, 1.5 m/s 1.0 m2, 1.5 m/s 2.0 m2, 1.5 m/s 0.36 m2, 3.0 m/s 1.0 m2, 3.0 m/s 2.0 m2, 3.0 m/s
Figure 7.26. Maximum temperatures with elevation at the middle of the tunnel with a 0.36 m2 gasoline pan fire with three air velocities
Figure 7.26 shows the variation in the maximum air temperature with elevation produced by a 0.36 m2 pool fire at three airflow velocities. The temperatures were measured at the middle of the tunnel. The results show that with an increase in airflow velocity, the temperatures decreased in the upper portion of the tunnel but increased in the lower portion of the tunnel.
Temperature (oC) 20 25 30 35 40 45 50 55 Ele v atio n of t unnel ( m ) 0 1 2 3 4 5 6 0.0 m/s 1.5 m/s 3.0 m/s Air velocity
Figure 7.27. Maximum temperatures with elevation at the middle of the tunnel with three gasoline pan fires with two airflow velocities
Figure 7.27 shows the variation of the maximum air temperature with elevation produced by three sizes of pool fires at two airflow velocities. The temperatures were measured at the middle of the tunnel. The temperatures in the upper portion of the tunnel decreased with an increase in airflow velocity. However, air temperatures in the lower portion of the tunnel with large pool fires showed a different trend from those produced by small fires. The temperatures in the lower portion of the tunnel only slightly increased with an increase in air velocity.
Temperature (oC) 20 40 60 80 100 120 Ele v atio n of t unnel ( m ) 0 1 2 3 4 5 6 0.36 m2, 1.5 m/s 0.36 m2, 3.0 m/s 1.0 m2, 1.5 m/s 1.0 m2, 3.0 m/s 2.0 m2, 1.5 m/s 2.0 m2, 3 m/s
7.1.6 Impact of Tunnel Airflow on Response of Fire Detection Systems
Figure 7.28 summarizes the response times of fire detector/detection systems for a 0.36 m2 fire located underneath the vehicle at three air velocities. Generally, the response times of the two linear heat detection systems D-1L1 and D-2L2, VID flame/smoke system D-4C1, and the smoke detection system D-9S1 to a small fire, increased with an increase in air velocity in the tunnel, as the ceiling temperature and smoke optical density decreased and the fire plume was tilted towards the ground. The VID flame system D-6C3 did not respond to the fire at any of the airflow velocities in the tunnel. The two spot heat detectors D-7H1 and D-8H2 also did not respond to the fire with the three airflow velocities, as the ceiling temperature was below the response temperature. The response of the other detectors to the small fire located underneath the vehicle was dependent on the type of detector and the airflow velocity in the tunnel.The response time of the two linear heat detection systems D-1L1 and D-2L2 increased from 64 s and 51 s at 1.5 m/s to 118 s and 64 s at 3 m/s, respectively.
The flame detector D-3F1 with a medium sensitivity level detected the small fire at 46 s under non-ventilated conditions. It had no response to the fire scenario with an airflow velocity of 1.5 m/s but detected the fire at 88 s for the test with an airflow velocity of 3 m/s. Test results also indicated that the detector with a high sensitivity level detected the fire at all three airflow speeds and responded to the fire more quickly than the detector with a medium sensitivity level, as shown in Table 7.1.
The response time of the VID flame/smoke system D-4C1 increased from 46 s at 0 m/s to 103 s at 1.5 m/s. There was no data available for the detector with an airflow speed of 3 m/s, because of a malfunction of the detector.
The VID flame/smoke system D-5C2 was able to detect the fire at all three airflow velocities at 40 to 45 s. The changes in airflow speed had a limited impact on the performance with a 0.36 m2 fire located underneath the vehicle.
The response of the smoke detection system D-9S1 to the fire was delayed from 51 s for an airflow of 0 m/s to 147 s for an airflow of 1.5 m/s. The further increase in air velocity from 1.5 m/s to 3 m/s resulted in a slight increase in the response time to 156 s.
Figure 7.28. Response times of fire detectors/detection systems to a 0.36 m2 fire located underneath the vehicle at three airflow velocities
De te ctin g Time (s) 0 50 100 150 200 0 m/s 1.5 m/s 3 m/s D-1L1 D-2L2 D-3F1 D-4C1 D-6C3 D-7H1 D-8H2 D-9S1 Detectors/Detection Systems D-5C2 no response
The response time of fire detector/detection systems to a 1.0 m2 fire located underneath the vehicle at three air velocities are shown in Figure 7.29. Their performances under non-ventilated conditions in Task 2 are also shown in the figure. There are no results for the two linear heat detection systems D-1L1 and D-2L2, since they were not included in the fire tests because the equipment arrived late.
The response time of flame detector D-3F1 with a medium sensitivity level increased with an increase in air velocity. The response time was 15 s for airflow velocity of 1.5 m/s and increased to 50 s for a 3 m/s velocity.
The response time of the VID flame/smoke system D-4C1 at two airflow velocities were slightly longer than that under non-ventilated conditions. The response time was 50 s for an airflow velocity of 1.5 m/s and 48 s for a 3 m/s velocity. An increase in airflow velocity had a limited impact on the detection time for a 1.0 m2 fire located underneath the vehicle.
The VID flame/smoke system D-5C2 detected the fire at the two air velocities. The response time decreased from 31 s for an airflow velocity of 1.5 m/s to 18 s for a 3 m/s velocity.
The VID flame detector D-6C3 responded to the fire at 28 s under non-ventilated conditions, but it could not detect the fire when the airflow velocity in the tunnel was 1.5 m/s. The detector responded to the fire at 24 s in the test with an airflow velocity of 3 m/s.
Both spot heat detectors D-7H1 and D-8H2 responded to the fire at the three airflow velocities. The response times under longitudinal airflow conditions were shorter than those under non-ventilated conditions, as the fire size was increased by the airflow. However, the response times were longer at the airflow velocity of 3 m/s than at 1.5 m/s. This was consistent with the change in ceiling temperature produced by the fire in the tests. The response time of the detector D-7H1 at the three airflow velocities was 231 s, 40 s and 100 s, respectively. The response time of detector D-8H2 at the three airflow velocities was 125 s, 27 s and 33 s, respectively.
The smoke detection system D-9S1 also detected the fire at the three airflow velocities. The detection times under longitudinal airflow conditions were shorter than under non-ventilated conditions. The response times of the smoke detection system at the three air velocities were 47 s, 39 s and 45 s, respectively. The change in response time was consistent with the smoke optical density produced by the fire under airflow conditions.
Figure 7.29. Response times of fire detectors/detection systems to a 1.0 m2 fire located underneath the vehicle at three airflow velocities
D e tec ting Time ( s ) 0 50 100 150 200 250
0 m/s* (data from Task 2) 1.5 m/s 3 m/s D-1L1 D-2L2 D-3F1 D-4C1 D-6C3 D-7H1 D-8H2 D-9S1 Detectors/Detection Systems D-5C2 no response