O
pen
A
rchive
T
OULOUSE
A
rchive
O
uverte (
OATAO
)
OATAO is an open access repository that collects the work of Toulouse researchers and
makes it freely available over the web where possible.
This is an author-deposited version published in :
http://oatao.univ-toulouse.fr/
Eprints ID : 16112
To cite this version : Gourbil, Ange and Duru, Paul and Fichot,
Florian and Quintard, Michel and Prat, Marc Experimental study of
boiling in porous media: effect of the void fraction on the critical heat
flux. (2016) In: 9th International Symposium on Heat Transfer
ISHT-9, 15 August 2016 - 19 August 2016 (Beijing, China)
Any correspondence concerning this service should be sent to the repository
administrator:
staff-oatao@listes-diff.inp-toulouse.fr
EXPERIMENTAL STUDY OF BOILING IN POROUS MEDIA: EFFECT OF THE VOID FRACTION
ON THE CRITICAL HEAT FLUX
A. Gourbil
Institut de Mécanique des Fluides de Toulouse (IMFT) - Université de Toulouse,
CNRS-INPT-UPS, Toulouse FRANCE
P. Duru
Institut de Mécanique des Fluides de Toulouse (IMFT) - Université de Toulouse,
CNRS-INPT-UPS, Toulouse FRANCE
F. Fichot
Institut de Radioprotection et de Sûreté Nucléaire (IRSN), BP3 13115 St Paul lez Durance
FRANCE
M. Quintard
Institut de Mécanique des Fluides de Toulouse (IMFT) -
Université de Toulouse, CNRS-INPT-UPS, Toulouse
FRANCE
M. Prat
Institut de Mécanique des Fluides de Toulouse (IMFT) -
Université de Toulouse, CNRS-INPT-UPS, Toulouse
FRANCE
ABSTRACT
Forced-convection boiling is experimentally studied in a two-dimensional heat-generating model porous medium. Visualizations of the two-phase flow and thermal measurements inside the test section are performed. Boiling curves show that the critical heat flux on a specific heating element decreases as the global thermal power released by the porous medium increases. Also, visualizations show that the void fraction in the test section increases with the global heating power. An image processing program was developed to measure the void fraction, in order to investigate its influence on the critical heat flux. Such a measurement is validated using a second test section where air is injected at a known flow rate inside the device, in isothermal conditions, and where flow regimes comparable to those observed in the boiling experiment are obtained.
NOMENCLATURE
qCHF Critical heat flux (W/m2)
Tcylinder Wall temperature of the cylinder under study (°C)
Tinlet Liquid inlet temperature (°C)
y Height in the test section (m) ROI Region of interest
INTRODUCTION
Reflooding during a reactor severe accident is an important topic in nuclear safety studies. Following a loss of coolant
accident in a pressurized water reactor, the materials of the core can crumble and form a porous, hot debris bed that must be efficiently cooled. This is done by reflooding the debris bed with water. However, this operation can cause hazardous oxidization reactions between water steam and zircaloy contained in the fuel cladding [1], and its success to cool the core by extracting the nuclear residual power is not guaranteed because dry-out phenomena can occur. Since the seventies, many studies have been made to investigate the coolability of a hot debris bed, [1-8] to cite a few. They are reviewed and discussed by Fichot et al. [9]. Many of them tried to determine the dry-out conditions of a reflooded debris bed, and to define a dry-out critical heat flux. Indeed, because of the low thermal conductivity of the vapor, a dry zone in the debris bed may heat up to a point where particles can melt and form a mixture called corium. Thus, the dry-out heat flux is considered to be the highest thermal flux that water can extract from a debris bed [3, 10].
At the French Institute for Radiation Protection and Nuclear Safety (IRSN), the ICARE/CATHARE code used to simulate reflooding is based on a thermal-hydraulic two-phase flow model in porous media [9, 11-13]. To validate and improve this model, an experimental research program has been set up. Two test facilities have been made, called PRELUDE and PEARL. These experiments consist in reflooding with water a packing of steel beads heated by an induction coil [14]. They allow to test the model used, providing data such as steam production rate, pressure drop, temperature at different points in the test section. Yet, these are essentially macroscopic data, and
local information about the flow at the pore scale is also needed to improve the model [15].
Thus, a collaboration has been undertaken between IRSN and the Fluid Mechanics Institute of Toulouse (IMFT) in order to characterize boiling phenomena at the pore scale. A nearly two-dimensional heat-generating model porous medium has been set up [16], which allows the monitoring of the thermal power released by the heating elements, the measurement of their temperature, and visualizations of the flow patterns. This experimental device is introduced in a first part of this paper and then, the results of typical boiling experiments are detailed. An important finding is that the critical heat flux on a given heating element decreases as the global thermal power released by the porous medium increases. Also, visualizations show that the void fraction around the heating element under study has a great influence on the critical heat flux. Finally, an image processing method aiming at estimating the void fraction in the test section is presented.
EXPERIMENTAL SETUP
The experimental setup is fully described in [15]. The test cell is composed of 392 cylinders positioned between two ceramic plates, one of which is transparent, allowing direct flow visualizations (see Fig. 1). The staggered arrangement of the 2 mm diameter cylinders is slightly randomly disturbed. The spacing between the plates is 3 mm. The cylinders are Pt-100 resistance temperature detectors (RTD) heated by Joule effect. They perform a dual function: they are used as both temperature probes and heating elements. It is the main original feature of this experimental device, which gives the possibility of heating the porous medium while controlling the thermal power released by the heating elements and measuring their temperature.
The heat flux applied to each cylinder is controlled by a microelectronic servo-control system. The test section is held vertically, the liquid is injected at the bottom at a controlled flow rate, pressure, and inlet temperature. The working fluid is the HFE-7000, which boils at 34°C at atmospheric pressure. It was chosen because of its low saturation temperature, which allows to study all the boiling regimes, in particular film boiling, while keeping the thermal constraints in the setup at a relatively low level. The size of the cylinders has been calculated so that the ratio of their diameter to the capillary length of the HFE-7000 is the same as the ratio of the steel beads diameter to the capillary length of water in the PRELUDE experiment: thus, bubble size distribution and confinement effects are comparable in both experiments.
EXPERIMENTAL RESULTS
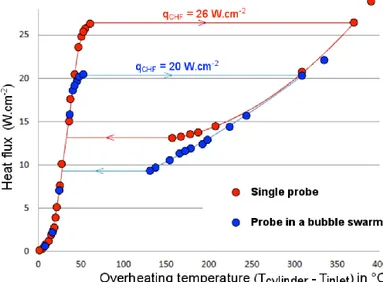
In the present paper we only present some results obtained in steady-state boiling regimes. Results in transient, reflooding experiments can be found in Sapin et al. [15]. Forced-convection boiling curves, later on referred as Nukiyama curves [17] have been established for a particular heating element, while all the others dissipated a fixed, controlled thermal power. Figure 2 displays the heating configuration of the model porous medium. Initially, the test section is saturated by the liquid, flowing upward at a flow rate fixed by a gear pump (the filtration velocity is 3.6 mm/s), while a constant thermal power is applied to the whole bundle of heating cylinders, except one. The cylinder under study is then progressively heated so that all boiling regimes are obtained at its surface, from nucleate to film boiling. A steady-state cylinder temperature is measured for the different heating powers. On Fig. 3, we compare two boiling curves obtained in two different configurations. In a first reference case, labeled “single probe” in Fig. 3, only the cylinder under study is heated. Then in another second case, labeled “probe in a bubble swarm”, the Nukiyama curve for the cylinder under study is obtained while a fixed heat flux is applied to the surrounding cylinders.
Both curves display the typical shape of a Nukiyama curve: the evolution of the heat flux applied as a function of the cylinder wall temperature in forced-convection boiling in porous media is similar to the one obtained in pool boiling. However, we note that the critical heat flux qCHF at which the
boiling crisis occurs is lower when the cylinder under study is within the vapor bubbles swarm generated by boiling at the surface of the others heating elements. Values of critical heat FIG. 1. Sketch of the test section. Each cylinder is a Pt100 resistance temperature detector.
fluxes obtained on a given cylinder for different thermal powers applied to the surrounding cylinders are reported in Fig 4: the critical heat flux decreases as the heating of the porous matrix increases.
In addition to thermal measurements, high-speed camera visualizations show that the presence of bubbles in the vicinity of the heating cylinder under study favors the formation of a vapor film around it, thus triggering the transition to the film boiling regime at lower imposed heating flux, compared to the situation without bubble swarm. To discuss this point quantitatively, we are currently looking at determining by image processing the void fraction in the test section, as a function of the thermal power released by the heated cylinders. This is detailed in the next section.
IMAGE PROCESSING: TOWARDS AN ESTIMATION OF THE VOID FRACTION
Direct visualizations
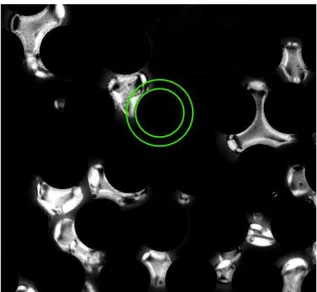
Two kinds of direct visualizations by video image recording have been performed, in three different steady-state forced-convection boiling cases where one, two, or three consecutive horizontal lines of cylinders are heated, see Fig. 2. Each cylinder dissipates a 400 mW power, the fluid filtration velocity and pressure being held constant (at 3.6 mm/s and 1.23 bar respectively). In both cases, images were first processed by subtracting a background image obtained while a one-phase liquid flow was set in the test section. Consequently, the bubbles are displayed in the clearest grey levels on the obtained images, as shown on Fig. 5.
FIG. 2. Heating configuration of the model porous medium. Nukiyama boiling curves: the cylinder under study is highlighted in red, the surrounding heating cylinders in green. Image processing: L1, L2 and L3 are the heated cylinders lines.
FIG. 4. Critical heat flux of the heating cylinder under study as a function of the fixed power applied to each of the others heating elements of the matrix.
FIG. 3. Nukiyama boiling curves: heat flux applied to a given cylinder as a function of its temperature. Red circles: only one cylinder is heated; blue circles: the same cylinder is heated while all the others dissipate a fixed, constant power, generating a bubble swarm in the test section.
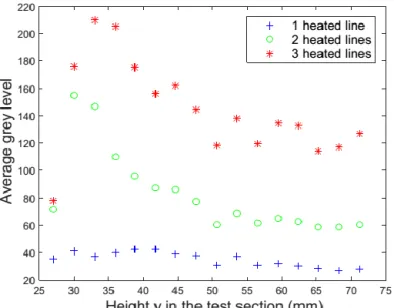
First, image sequences were obtained by high-speed visualization with a Dimax PCO camera. The acquisition frequency was then 500 frames per second, with a 35.5 pixels per millimeter spatial resolution. An annular region of interest (ROI) is defined around a given cylinder, as shown on Fig 4 and the mean grey level (i.e. the average on all the pixels contained in the ROI) is computed for each image. This mean value is close to zero when no bubbles are present in the ROI and increases sharply when one or more bubbles are located in the ROI. A typical time-resolved signal is shown in Fig. 6: each spike corresponds to one or many bubbles passing through the ROI. The mean value of this signal, integrated over the observation period, is therefore an increasing function of the time-averaged void fraction inside the ROI. Such a void fraction indicator has been calculated around each of the 232 cylinders downstream the heated lines, for each boiling configuration studied, over a 2 seconds period. Averaging the indicator over a given line of cylinders allows one to plot this mean value as a function of the height in the test section, as well as a function of the number of heated lines, see Fig. 7. The results displayed in Fig. 7 clearly show that the largest the number of heated lines is, the larger the time-averaged void fraction is, as expected. More interestingly, they also suggest that the bubble size distributions reach a steady state beyond a certain height, as the indicator mean values seem to converge. We are currently looking to calibrate this indicator value against the void fraction.
Second, images were acquired at a 0.5 Hz frequency with a Sensicam camera. Whatever the boiling regime is, a bubble takes less than 1 second to travel through the whole test section, from bottom to top. Taking pictures every 2 seconds ensure that we obtain a statistically meaningful set of images, in order to perform ensemble averaging. Three sets of 1500 images were then processed, heating respectively one, two, and finally three lines of cylinders. For each set, a mean image was calculated, see Fig. 8.
FIG. 5. Close-up on a typical image obtained after background subtraction. A region of interest around a given cylinder is highlighted in green.
FIG. 7. Void fraction indicator as a function of the location in the test section.
FIG. 6. Typical temporal evolution of the mean grey level in a Region Of Interest (10 pixels wide ring, displayed in green in Figure 4) located around a given cylinder.
On such an image, the mean grey level over horizontal stripes was calculated as a function of the height in the test section. The results, plotted on Fig 9, show the same trend as the one presented in Fig 7. This shows that, as far as void fraction evolution with height is concerned, the pieces of information brought by time-resolved fast speed imaging and ensemble averaging over uncorrelated images are the same. In this last case, a calibration of the mean grey level as a function of the void fraction must also be done. First steps in that direction are presented below.
Void fraction measurement
To our knowledge, the actual state of the art concerning two-phase flow quantitative visualization in porous media is limited to finely dispersed bubbly flows, where bubble size is smaller than the throats of the pore space [18, 19]. In our case, intense boiling regimes with greater bubble sizes are investigated. As already seen on Figure 5, bubbles shapes are often complex, with contours displaying convex and concave parts due to the bubbles confinement between the neighboring cylinders. Also, the contrast between the bubbles and the test section ceramic back-plate is quite low. Moreover, contours of bubbles as well as their interiors display light and dark areas, because of the many reflections due to the surrounding cylinders. For all these reasons, processing such images is particularly challenging.
The main steps of the image processing algorithm are listed below:
- Subtraction of the background image - Application of a mask to hide the cylinders - Thresholding to binarize the image
- Dilatation-erosion operations to smooth the bubbles edges - Labeling: allocation of a unique number for each identified bubble
To perform these image processing steps, specific Matlab scripts have been written. The two key steps affecting the final results are the thresholding and dilatation-erosion operations. The binarization threshold value and then the size of the structuring element applied are operator dependent because there is no quantitative criterion to fix them. The dilatation-erosion operation is essential to smooth the bubble edges after the thresholding. As shown in Fig. 10, it consists in scanning the bubble edges with a “structuring element”, a circle in our case, which successively enlarge the contours (dilatation) and then shrink them (erosion). This can result, according to the circle radius, into a more or less pronounced smoothing of the edges, and even in a numerical coalescence of some neighboring bubbles. The threshold value and the structuring element size are estimated on a few images by trial and errors and visual inspection with a naked eye.
FIG. 10. a) Close-up on a binarized image just after thresholding; b) c) d) Same close-up after dilatation-erosion operation performed with different radii R of the circular structuring element.
FIG. 9. Mean grey level as a function of the location along the test section height.
FIG. 8. Mean image obtained after averaging 1500 uncorrelated images, when 3 lines of cylinders are heated.
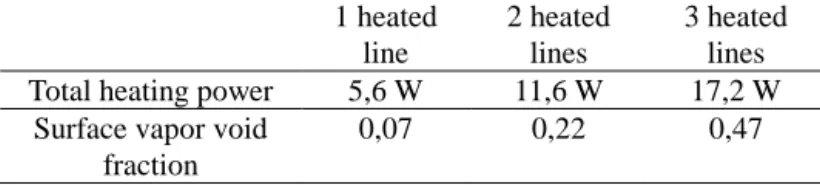
Once the images have been processed as explained above, a projected bubble area is easily determined, allowing to calculate the ratio of the total surface of all the bubbles to the pore-space projected area. This surface fraction can be considered as a first indicator of the order of magnitude of the void fraction in the test section, as proposed by Jo and Revankar [19], see Table1.
TABLE 1. Surface void fraction as a function of the total heating power. 1 heated line 2 heated lines 3 heated lines Total heating power 5,6 W 11,6 W 17,2 W
Surface vapor void fraction
0,07 0,22 0,47
To estimate a real mean void fraction corresponding to the vapor volume fraction in the test section, bubbles volumes, and not only projected areas, have to be estimated. For this purpose, we plan to classify bubbles into three categories depending on their projected areas. A small bubble will be considered to be spherical and its volume will be estimated from the determination of an equivalent radius based on its projected area. A large bubble, extending over two or more pores, will be assumed to be in contact with the test section front and back plates. A major difficulty will lie in the determination of the volume of the intermediate size bubbles.
In order to calibrate the volume bubble estimation and to evaluate the uncertainty, a test section with the same geometry as the heating model has been 3D printed. It was designed to permit air to be injected downstream the section at a known flow rate, in isothermal configuration, while a HFE-7000 flow is imposed from bottom to top. Bubbling tests have been performed to check that two-phase flow patterns similar to those obtained with the boiling experiment are recovered. The translucent test section allows to use a backlight, offering a good contrast between the bubbles and the porous medium and thus easier image processing. Images from the isothermal experiment are currently being processed with the same algorithm that the one used for the boiling experiment. The idea is to recover the imposed air flow rate from image processing, in order to validate the parameters used in the algorithms to estimate the bubbles volumes (grey level threshold, structuring element size, and bubble classification in three main types according to their size). This methodology will also allow us to estimate rigorously the uncertainty on the volume void fraction measurement.
CONCLUSION
A nearly two-dimensional heat-generating model porous medium was used to conduct forced convection boiling experiments. The decrease of the critical heat flux around a
given element due to the increase of the surrounding porous matrix heating has been experimentally demonstrated. The ongoing objective is to link this critical heat flux variation to the void fraction, using two-phase flow visualizations. So far, image processing is limited to the estimation of indicators linked to the local time-averaged void fraction, and to the calculation of the surface void fraction based upon the projection of the bubble areas into a vertical plane. Work is in progress to refine the analysis in order to estimate the volume void fraction. To this purpose, a calibration of the various parameters used in the image processing algorithm is being performed thanks to isothermal bubbling experiment visualizations for which the injected gas flow rate is known. When such a calibration will be performed, the influence of the void fraction on the critical heat flux will be quantified and investigated. These results will have to be taken into account in the reflooding numerical simulation tools used at the IRSN, where critical heat fluxes are so far estimated by using correlations established for convective boiling around one single heating tube [20, 21] and not in a bundle of heating tubes.
ACKNOWLEDGMENTS
This work was supported in part by Electricité de France (EDF). Authors are also grateful to Ruddy Soeparno and Hervé Ayroles for their contribution to the experimental setup development.
REFERENCES
[1] W. Hering and C. Homann, 2007, “Degraded core reflood: Present understanding and impact on LWRs”, Nucl. Eng.
Des., vol. 237, no. 24, pp. 2315–2321.
[2] D. O. Lee and R. H. Nilson, 1977, “Flow visualization in heat generating porous media”, Tech. Rept. SAND76-0614.
Sandia Natl. Labs.
[3] R. J. Lipinski, 1982, “Model for boiling and dryout in particle beds”, NUREG, vol. CR-264.
[4] T. Schulenberg and U. Müller, 1987, “An improved model for two-phase flow through beds of coarse particles”, Int. J.
Multiph. Flow, vol. 13, no. 1, pp. 87–97.
[5] J. M. Broughton, P. Kuan, A. David A. Petti, and E. L. Tolman, Aug. 1989, “A Scenario of the Three Mile Island Unit 2 Accident”, Nucl. Technol., vol. 87, no. 1, pp. 34–53. [6] N. K. Tutu, T. Ginsberg, J. Klein, J. Klages, and C. E.
Schwarz, 1984, “Debris bed quenching under bottom flood conditions”, Tech. Report, Brookhaven Natl. Lab. Upton,
New York.
[7] I. Catton, V. K. Dhir, and C. W. Somerton, 1983, “Experimental study of debris-bed coolability under pool-boiling conditions”, Calif. Univ., Los Angeles (USA). Sch.
Eng. Appl. Sci..
[8] V. X. Tung and V. K. Dhir, 1988, “A hydrodynamic model for two-phase flow through porous media”, Int. J. Multiph.
[9] F. Fichot, F. Duval, N. Trégourès, C. Béchaud, and M. Quintard, Oct. 2006, “The impact of thermal non-equilibrium and large-scale 2D/3D effects on debris bed reflooding and coolability”, Nucl. Eng. Des., vol. 236, no. 19–21, pp. 2144–2163.
[10] D. C. Groeneveld, L. K. H. Leung, P. L. Kirillov, V. P. Bobkov, I. P. Smogalev, V. N. Vinogradov, X. C. Huang, and E. Royer, 1996, “The 1995 look-up table for critical heat flux in tubes”, Nucl. Eng. Des., vol. 163, no. 1–2, pp. 1–23.
[11] F. Petit, F. Fichot, and M. Quintard, Mar. 1999, “Écoulement diphasique en milieu poreux : modèle à non-équilibre local”, Int. J. Therm. Sci., vol. 38, no. 3, pp. 239– 249.
[12] F. Duval, F. Fichot, and M. Quintard, Jan. 2004, “A local thermal non-equilibrium model for two-phase flows with phase-change in porous media”,Int. J. Heat Mass Transf., vol. 47, no. 3, pp. 613–639.
[13] A. Bachrata, F. Fichot, G. Repetto, M. Quintard, and J. Fleurot, 2011, “Quench front progression in a superheated porous medium : experimental analysis and model development.”, NURETH-14, pp. 1–13.
[14] G. Repetto, T. Garcin, S. Eymery, and F. Fichot, Nov. 2013, “Experimental program on debris reflooding (PEARL) – Results on PRELUDE facility”, Nucl. Eng.
Des., vol. 264, pp. 176–186.
[15] P. Sapin, a. Gourbil, P. Duru, F. Fichot, M. Prat, and M. Quintard, 2016, “Reflooding with internal boiling of a
heating model porous medium with mm-scale pores”, Int. J.
Heat Mass Transf., vol. 99, pp. 512–520.
[16] P. Sapin, 2014, “Etude expérimentale de l’ébullition en masse dans un milieu poreux modèle,” PhD thesis, Institut National Polytechnique de Toulouse - Université Paul Sabatier.
[17] S. Nukiyama, Dec. 1934, “The maximum and minimum values of the heat Q transmitted from metal to boiling water under atmospheric pressure”, J. Japan Soc. Mech. Engrs, vol. 37, pp. 367–374.
[18] D. Jo and S. T. Revankar, 2009, “Bubble mechanisms and characteristics at pore scale in a packed-bed reactor”, Chem.
Eng. Sci., vol. 64, no. 13, pp. 3179–3187.
[19] D. Jo and S. T. Revankar, Jul. 2010, “Effect of coalescence and breakup on bubble size distributions in a two-dimensional packed bed”, Chem. Eng. Sci., vol. 65, no. 14, pp. 4231–4238.
[20] D. C. Groeneveld, J. Q. Shan, a. Z. Vasić, L. K. H. Leung, a. Durmayaz, J. Yang, S. C. Cheng, and a. Tanase, 2007, “The 2006 CHF look-up table”, Nucl. Eng. Des., vol. 237, no. 15–17 SPEC. ISS., pp. 1909–1922.
[21] N. Chikhi and F. Fichot, 2010, “Reflooding model for quasi-intact rod configuration: Quench front tracking and heat transfer closure laws”, Nucl. Eng. Des., vol. 240, no. 10, pp. 3387–3396.