Modelling the electrical resistivity of green
carbon anodes for aluminium industry
Thèse
Geoffroy Rouget
Doctorat en génie des matériaux et de la métallurgie
Philosophiae doctor (Ph.D.)
Quebec, Canada
Modelling the electrical resistivity of green carbon
anodes for aluminium industry
Thèse
Geoffroy Rouget
Sous la direction de :
Houshang Alamdari, directeur de recherche
Javad Mashreghi, codirecteur de recherche
iii
Résumé
L’aluminium primaire produit de nos jours est obtenu par l’électrolyse de l’alumine à 960 °C, suivant le procédé proposé par Charles Martin Hall, et Paul Louis-Toussain Héroult, en 1886. Ce procédé, communément appelé Hall-Héroult, du nom de ceux qui l’ont proposé, consiste à imposer un courant électrique au travers un mélange de cryolithe fondue dans laquelle est dissoute l’alumine. Le courant circule entre les anodes et la cathode de carbone. Les anodes sont principalement composées de coke de pétrole calciné et du reste non consommé des anodes usagées, que l’on appelle mégot. Toutes ces particules carbonées sont liées à l’aide de brai de houille (pitch). Une fois le bloc anodique formé, il doit être cuit afin de lui conférer une bonne tenue mécanique. Pour permettre un rendement efficace lors de ce procédé, les anodes, qui amènent le courant, doivent avoir une résistivité électrique la plus faible possible. De plus, ces anodes, consommables, servent aussi d’apport pour le carbone nécessaire à la réaction d’électrolyse, leur composition chimique doit par conséquent être suffisamment pure pour ne pas affecter la qualité de l’aluminium produit. Le projet de recherche présenté ici se focalise sur l’étude et la compréhension du comportement électrique de l’anode avant sa cuisson à des fins de contrôle de qualité en cours de fabrication.
Pour déterminer la résistivité électrique d’un matériau composite, le modèle mathématique de Nielsen semble être un outil très intéressant et polyvalent dans différentes applications de modélisation de la résistivité électrique. Pour utiliser ce modèle, il est nécessaire de connaître certaines propriétés des différentes phases constituant l’anode. Dans le cas présent, le matériau anodique sera limité à une fraction de tailles de particules de coke de pétrole et la matrice liante, composée du pitch et de particules fines de coke de pétrole. Les propriétés à connaître sont, pour les particules de coke, leur résistivité électrique intrinsèque, leur rapport de forme, ainsi que la compacité maximale qui puisse être obtenu avec ce matériau. Seule la résistivité électrique de la matrice liante est à connaître nécessairement.
Dans l’industrie de l’aluminium, seule la résistivité électrique d’un lit des particules est mesurée pour suivre l’évolution de ce paramètre suivant les différents lots utilisés. Pour implémenter la résistivité électrique du coke dans le modèle de Nielsen, il est nécessaire de déterminer la résistivité électrique intrinsèque du coke. Afin de déterminer cette valeur,
iv
des mesures de résistivité électriques ont été faites en utilisant une méthode quatre pointes, qui permet de mesurer la résistivité électrique des matériaux dont la résistivité est faible. Ensuite, le vide inter particulaire présent dans le volume de mesure est retranché afin de ne compter que le volume occupé par le matériau. Finalement, les contacts entre particules ont été estimés par calcul numérique, en utilisant la méthode des éléments discrets. Le nombre, la surface moyenne et la disposition de ces contacts ont été évalués afin d’être implémentés dans un modèle mathématique permettant de calculer la résistivité électrique du coke. Différentes mesures ont permis de proposer une valeur cohérente et acceptable pour la résistivité électrique du coke.
Afin de mesurer la résistivité électrique de la matrice liante ainsi que de l’anode, une méthode précise est requise. La méthode standardisée utilisée par l’industrie montre de grands écarts à la moyenne et des valeurs souvent peu reproductibles. La méthode de mesure de la résistivité électrique proposée par Van der Pauw permet d’obtenir des résultats avec une plus grande reproductibilité et un écart à la moyenne fortement amoindri. Cette méthode peut être utile pour mesurer la résistivité électrique des sections coupées dans une carotte d’anode ou de matrice liante moulée.
Différentes mesures, effectuées sur des échantillons type anode de différentes compositions ont révélé que la résistivité électrique mesurée en laboratoire ne correspond pas à celle calculée en utilisant le modèle de Nielsen, intégrant les paramètres physiques des matériaux utilisés. Pour expliquer la divergence entre le modèle et les mesures de laboratoire, une analyse en microscopie optique a été effectuée. Il a été révélé que l’épaisseur de la couche de matrice liante entre les particules demeure trop grande pour permettre la création d’un chemin électrique de particule à particule dans le matériau. Ceci implique que la résistivité électrique de la matrice liante impose principalement la résistivité électrique du composite, dans ce cas.
v
Abstract
Primary aluminium produced nowadays is obtained by electrolysis of alumina at 960 °C, following the process proposed by Charles Martin Hall, and Paul Louis Toussain Héroult, in 1886. This process, named Hall-Héroult, due to the name of its creators, consists in applying an electrical current trough a mix of molten cryolithe in which is dissolved alumina. The current flows between the carbon anodes and the cathode. Anodes are mostly composed of calcined petroleum coke aggregates and remnant particles of used anodes, butt particles. Those carbonaceous particles are tied together using coal tar pitch. Once the anode bloc is formed, it is backed to gain mechanical strength. To allow an efficient yield during the electrolysis process, anodes, through which the current flows, shall have the lowest electrical resistivity. Furthermore, those consumable anodes, are also required to bring the carbon as reactant for the electrolytic reaction, consequently, their chemical composition must be pure enough not to diminish the produced aluminium quality. The research project presented focuses on the study and understanding of electrical behaviour of the anode prior to its backing, for quality control during manufacturing process.
To determine the electrical resistivity of a composite material, Nielsen’s model appears as an interesting tool, reliable for multiple electrical modelling applications. Using this model implies knowing several properties of the different phases present in the anode. In the present case, anode material is restricted to a specific size fraction of coke particles and binder matrix, made of pitch and fine particles. The properties to know are, for the coke particles, their intrinsic electrical resistivity, aspect ratio, and the maximal packing fraction that can be reached. Only electrical resistivity is required for the binder matrix.
In aluminium industry, only the electrical resistivities of beds of particles are measured to follow the evolution of this parameter depending the batch used. To implement the electrical resistivity of coke particles in Nielsen model, its intrinsic electrical resistivity is required. To obtain this value, measurement were performed using four probes setting, which allows measuring the electrical resistivity of material presenting low resistivity. Then, inter-particles void present in the measurement volume shall be removed in order to only take account of the volume occupied by the material investigated. Finally, the contacts between particles are estimated by numerical calculation, using discrete element method.
vi
The number, average surface and disposition of the contacts were assessed to implement them in a mathematical model allowing calculating the electrical resistivity of coke. Several measures lead to the proposition of a consistent and reliable value for electrical resistivity of coke.
To measure the electrical resistivity of binder matrix, as well as the anode’s, an accurate method is required. The standardised method used in the industry reveals strong standard deviation and rather not often reproducible values. The method of measurement of electrical resistivity of continuous phases proposed by Van der Pauw allows retrieving highly reproducible results, with a much lower standard deviation. This technique can be useful to measure the electrical resistivity of slices cut out of anode cores or cast binder matrix.
Several measurements, performed on anode like samples with different composition revealed that the electrical resistivity measured in laboratory does not fit with the one calculated using Nielsen’s model, using the physical parameters of the characterized materials. To explain the difference, between the model and laboratory measurements, an optical microscopic analysis was performed. It was disclosed that the binder matrix layer between particles remain too thick to allow the creation of an electrical path from particle to particle within the material. This implies that the electrical resistivity of the binder matrix mostly dictates the one of the composite material, in this case.
vii
Table of contents
Résumé ... iii
Abstract ... v
Table of contents ... vii
List of figures ... ix
List of tables ... xi
Acknowledgements ...xii
Forewords ... xiv
Chapter 1: Introduction ... 1
1.1 Anodes for aluminum industry ... 3
1.2 Objective ... 6
Chapter 2: Literature review ... 8
2.1 Anodes microstructure ... 8
2.2 Electrical resistivity of anode ... 15
2.2.1 Electrical resistivity models for composite materials ... 17
2.2.1.1 Kirkpatrick and Zallen model ... 17
2.2.1.2 Jansen, Aharoni and Gurland model ... 18
2.2.1.3 Scarsbrick’s model ... 18
2.2.1.4 Bueche’s model ... 19
2.2.1.5 Nielsen’s model ... 19
2.2.2 Models describing the influence of porosity on electrical resistivity ... 21
2.2.2.1 Hakamada et al. Model ... 21
2.2.2.2 Bhattacharyay et al. Model ... 24
2.2.2.3 Carson et al. Model ... 25
2.3 Method of characterization of electrical resistivity of materials ... 26
2.3.1 Electrical resistivity of powders ... 26
2.3.2 Electrical resistivity of plain materials ... 27
2.4 Choice of model ... 27
2.5 Parameters of the model ... 28
Chapter 3: Material and method ... 30
3.1 Continuous phase ... 30
3.1.1 Binder matrix recipe ... 30
3.1.2 Anodes samples ... 31
3.1.3 Electrical resistivity measurement ... 32
3.2 Dispersed phase ... 33
Chapter 4: Electrical resistivity measurement of petroleum coke powder by means of four-probe method 35 4.1 Résumé ... 36
4.2 Abstract ... 37
4.3 Introduction ... 38
4.4 Materials and Methods ... 41
4.5 Results ... 46
4.5.1 Influence of particles sizes and inter-particles voids on electrical resistivity of particle bed 47 4.5.2 Discrete element modelling: estimation of contacts size ... 49
viii
Chapter 5: Electrical resistivity measurement of carbon anodes using Van der Pauw method 58
5.1 Résumé ... 59
5.2 Abstract ... 60
5.3 Introduction ... 61
5.4 Experimental ... 62
5.4.1 Standard method ... 62
5.4.2 Van der Pauw Method ... 63
5.4.3 Samples preparation ... 65
5.5 Results ... 67
5.5.1 Comparison of Standard and Van der Pauw Methods ... 68
5.5.2 Validation of Van der Pauw Method for Intact Samples ... 68
5.5.3 Validation of Van der Pauw Method for Broken samples ... 70
5.5.4 Validation of Van der Pauw method for intentionally-generated cracked samples ... 71
5.6 Finite element modelling of VdP method ... 74
5.7 Detection of defects using VdP method ... 77
5.8 Conclusion... 81
Chapter 6: Electrical resistivity of green anodes modelling: the flaws of Nielsen’s model to predict green anode’s electrical resistivity ... 83
6.1 Résumé ... 84
6.2 Abstract ... 85
6.3 Introduction ... 86
6.4 Materials and methods ... 89
6.4.1 Materials ... 89
6.4.2 Sample preparation ... 90
6.4.3 Methods ... 91
6.4.4 Electrical resistivity test ... 93
6.4.5 Image analysis instrument ... 94
6.5 Results ... 94
6.5.1 Percolation of binder matrix ... 94
6.5.2 Electrical resistivity of anode-like paste ... 95
6.5.3 Electrical resistivity using Nielsen’s model ... 97
6.6 Conclusion... 101
Chapter 7: General discussion – Conclusion ... 103
7.1 Electrical resistivity of coke particles ... 103
7.2 Electrical resistivity of the continuous phase ... 104
7.3 Binder matrix ... 105
7.4 Electrical resistivity of anode cores ... 105
References ... 108
Appendix 1 – ... 112
Appendix 2 – ... 114
Appendix 3 – ... 126
ix
List of figures
Figure 1. Scheme of an electrolysis cell. [3] ... 2
Figure 2. Microstructure of a carbon anode block. ... 4
Figure 3. Different kinds of pores in coke particles and anodes. [3]... 5
Figure 4. Principle of anode fabrication. [13] ... 6
Figure 5. SEM micrographes presenting five different classes of interface between coke and green binder matrix: a) voided interface, b) completely fissured, c) partially fissured, d) pored, e) continuous. [14] ... 9
Figure 6. Pore size distribution, obtained by mercury porosimetry, for 3 different size fractions of particles and 6 different sources of coke. [15] ... 10
Figure 7. Evolution of electrical resistivity and inter-particles distance of green anode as a function of milling time. [16] ... 11
Figure 8. Electrical resistivity and pitch layer thickness compared to milling time. [16] ... 12
Figure 9. Inter-particle distance and pitch layer thickness compared to the electrical resistivity [16]. ... 13
Figure 10. Comparison of the bottom of an anode, before and after baking, using CT-Xr. [17] ... 14
Figure 11. Comparison of the center of an anode, before and after baking, using CT-Xr. [17] ... 14
Figure 12. Curve of percolation of a composite made with polypropylene matrix and carbon black conductive filler. [27] ... 16
Figure 13. Illustration model of unit-cells used by Hakamada et al. [43] ... 22
Figure 14. Electrical resistivity of aluminium foam depending the porosity, for single sized pores. [43] ... 23
Figure 15. Electrical resistivity of aluminium foam depending pore size, constant porosity. [43] ... 24
Figure 16. Optimization of pitch - fines ratio depending BN of the sample. [21] ... 30
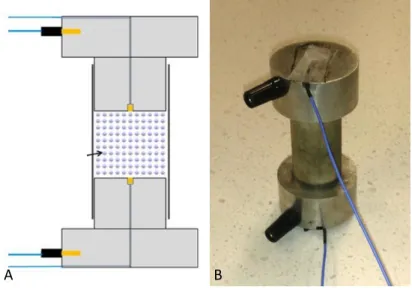
Figure 17. Illustration of Van der Pauw setting, position of the probes used in the model. 32 Figure 18. Experimental setting for the electrical resistivity measurement of coke particles. A schematic view. B Actual setting. ... 34
Figure 19. Lines of current flow (Ef) and equipotential (Eq) in the compounds C1 and C2, and at the interface between those. Current lines gathered at the interface, constriction between C1 and C2. Adapted from reference [66]. ... 40
Figure 20. Views of one of the four probes device setting's plunger: A top view of the plunger, detail of the voltage probe in the center, B side view of the plunger, C schematic side view, detail of the voltage measurement circuit insulated from the plunger. ... 42
Figure 21. Experimental setting. ... 43
Figure 22. Two probes measurement. ... 44
Figure 23. Four probes measurement. ... 45
Figure 24. Difference of electrical resistivity with both methods for four sources, one size fraction. ... 47
Figure 25. Electrical resistivity of coke A compared to size of particles and method of measurement. ... 49
Figure 26. Example of particles created by DEM (Images obtained at the laboratory). ... 50
Figure 27. Evolution of contact area and contact radius with particles size. ... 51
Figure 28. Electrical resistivity of the bed of particles, normalized compared to number of contact and contact area per unit of volume. ... 52
x
Figure 30. Schematic view of the setting used for the measurement of electrical resistivity of carbon anodes according to the ISO11713 standard. ... 63 Figure 31. Picture of the Van der Pauw setting for laboratory measurement. The sample is placed in the center, between the four V-shaped copper probes. ... 64 Figure 32. Anode core shapes for measuring electrical resistivity using standard method (A) and Van der Pauw method (B). ... 66 Figure 33. Broken sample prepared for measurement using Van der Pauw method. The failure was circled at the right of the sample. ... 66 Figure 34. Schematic view of the cuts performed on sliced samples, along the revolution axis (z- axis) (A-1, A-2) and normal to revolution axis (B-1 B-2). ... 67 Figure 35. Comparison of electrical resistivity using standard and Van der Pauw methods for carbon anode cores. ... 68 Figure 36. Comparison of standard and Van der Pauw methods for intact samples cored from the industrial laboratory. “Indus” and “STD-UL” are the measurements provided respectively by the industrial laboratory and those achieved using standard method in Laval laboratory. “VDP (1-3)” are measurements performed on slices 1, 2 and 3 of each sample (VdP method); VDP-AVG is the average of the three combined measurements. . 69 Figure 37. Comparison of Standard and Van der Pauw methods, for flawed sample from the industrial laboratory. ... 71 Figure 38. Position of the crack toward the probes: 1) Crack placed between two probes at equal distance, 2) crack placed close to one of the probes. ... 72 Figure 39. CAD model used for FEM and VdP methods, A) radial crack, placed between the probes, B) transverse crack. ... 74 Figure 40. Mesh model used for FEM and VdP methods, A) radial crack, placed between the probes, B) transverse cracks... 75 Figure 41. Representation of the current line on a sample containing radial crack. A, probes placed on the same side of the crack, B, probes placed on both sides of the crack. ... 79 Figure 42. Schematic representation of Van der Pauw setting for measurement of electrical resistivity of circular samples... 94 Figure 43. Percolation threshold of binder matrix using BN 4500 and BN 6300 particles. 95 Figure 44. Electrical conductivity and density of the green samples for each composition. ... 96 Figure 45. Theoretical and experimental values of electrical conductivity of samples as a function of coke aggregate fraction. ... 98 Figure 46. Inter-particle distance using a mix of pure coal tar pitch and 1.2 to 2.4 mm coke particles. ... 99 Figure 47. Inter-particle distance using a mix of binder matrix made of 35 wt% pitch, 65 wt% BN 6000 fine coke powder, and 1.2 to 2.4 mm coke particles. ... 100
xi
List of tables
Table 1. Values of coefficient A depending aspect ratio and orientation of the filler. [36/37] ... 20 Table 2. Common values of Φm for specific packing lattices. [36] ... 21
Table 3. Physical and chemical properties of the cokes investigated. Lc was obtained from the X-ray diffraction patterns and the chemical compositions were obtained by X-ray fluorescence (XRF) analysis. ... 46 Table 4. Calculated values of inter particulate contact using DEM, * experimentally measured values. ... 50 Table 5. Calculated values of inter particulate contact using DEM for particles from 1.2 to 2.4 mm, * experimentally measured or calculated values. ... 53 Table 6. Electrical resistivity measurement of samples containing defects using both the standard and the Van der Pauw methods. ... 73 Table 7. Electrical resistivity estimation, using FEM and VdP method, for a sample containing a crack parallel to the axis of revolution. ... 76 Table 8. Electrical resistivity of a sample containing a crack, normal to axis of rotation, calculated using FEM and VdP method. ... 77 Table 9. Difference for two contiguous resistances for a sample containing a crack, parallel to axis of rotation, calculated using FEM method. ... 80 Table 10. Difference for two contiguous resistances for a sample containing a crack, normal to axis of rotation, calculated using FEM method. ... 81 Table 11. Values of factor A depending on the configuration of the system [36]. ... 88 Table 12. Chemical composition of calcined coke and coal tar pitch. ... 90 Table 13. Values of the main parameters used in Nielsen equation, depending on the used recipe. ... 97
xii
Acknowledgements
I would like, in first instance, to thank my research director, Houshang Alamdari, for giving me the opportunity to challenge myself during the last six years. Houshang gave me the support required during all this time, gave me the key to success in my work, and pushed me to overpass my limits. Today more than ever, thank you very much.
I would like to thank all the member of the jury who accepted to revise my thesis, provide meaningful comments to finalise this work. Javad Mashreghi, my co-supervisor, who gave me a good help to resolve the mathematical hurdles related to this work, and gave me support when things didn’t go that well. Mario Fafard, director of Aluminium Research Center - REGAL, who also followed carefully my work during the early years of this project, and always remained aware of the work done. And Finally Nicolas Giguère, who pushed me recently to the industrial world of people with such a degree, this kind of brightened the flame of work in me. Thank you all.
This work would have never been possible without the help of administrative staff, technician and research professionals at Material and Metallurgical Department, Andrée Lord, Ginette Cadieux, Martine Demers, Julia Lebreux, Lise Lemieux, Vicky Dodier, Nathalie Moisan, Maude Larouche, Christian Jalbert, Edmond Rousseau, and Genevieve Bruneau. The same way, some staff from Civil Engineering Department gave me good help, Pierre-Andrée Tremblay, Mathieu Thomassin, René Malo and Alain Melançon.
The greatest help came from the REGAL staff, Donald Picard, Guillaume Gauvin, Hicham Chaouki, Mounir Baiteche, and Valérie Goulet-Beaulieu.
Without the huge help of Hugues Ferland, dedicated expert technician, who also became a friend, most of this work wouldn’t have been achieved that way.
Most the student from GMN department were great colleagues, it would be tricky to be able to name all… Vane, Ivan, Seb, Marie, you’ve always been close to me, I’ll never forget. People from 0790 and 0788 (J-F, Simon, Keven, Jean-Nic, Louis, Maryam, Maryam, Pierre, Bertrand, Mousa, Majid, Mahdi, Amin and Saba, Milad, Essowe, Afghany…) And people from the hospital (Éle, Ludi, Morgane, Seb, Caro, etc)
xiii
Student from REGAL group, Julien, François G, Stéphane, Asem, Kamran, Franck, and the three magnificents, François Chevarin, Ramzi Ishak, and Behzad Majidi.
I want to thank the friends I met in Quebec, Max and Nicolo, my roomates for long years, Coralie, Marie-Michèle, Alia, Isabelle, Guillaume, Rachel, P-O, Amélie and Andréanne, and I surely miss to name much more others that mean to me.
My Friends from France and around the world, from university, Sylvain and Elsa, Nicolas, and Jo, Hans and Aurélie, Gaetan “petit pompier”, Alejandro, Lisette, Cheldi, Amelia, Isabel, Bart and Agathe. Some older friends, Alex, Nono, Vivi and Karine. Charline and Hugues, Clems, Louis and Eva, Benoît. Special thanx to papi Salek who came to UL too.
A special thank needs to be sent to Dave and Ayelet, my first friends from the province, Montreal South Shore, you’ve always been here for me, it means a lot.
Finally, for the friend section, the oldest and closest friends had during those Quebec years, Auré and Hélène, and Nico and Monnelle without you; it would clearly not have been the same!
Without the support of my family, brothers and sister, but mostly my parents, I would most likely not have been able to succeed in this task. I love you all. From my family, I can’t miss to thank my grand-father who got me at the airport the time I left France for good. I owe you most of the work done here, sincerely. With those words, I have to thank my grand-father who was always a positive figure in my life and taught me many things which lead to who I am today.
Finally, I have to thank again Valérie for the sick move she made a few months ago and all the good support she gave me to finish correcting this thesis, and preparing the last presentation as a student.
xiv
Forewords
This doctoral thesis is presented to the department of mining, metallurgy and material engineering of Laval University. This project was involved in a Collaborative Research and Development (CRD) programm Between Alcoa Company, and Laval University, (Aluminium Research Center (Regal) and MACE3 industrial research chair). The project was financially supported by the Natural Science and Engineering Research Council of Canada (NSERC), and Fonds de Recherche du Quebec - Nature et Technologies (FRQNT) through the Aluminium Research Center (Regal). This work was carried out under the supervision of Professor Houshang Alamdari, and co-supervision of Professor Javad Mashreghi and Dr. Donald P. Ziegler, Program Manager at the Alcoa Technical Center.
This dissertation, entitled “Modelling the electrical resistivity of green carbon anodes for aluminium industry”, relates the work performed to understand the electrical behaviour of the carbon anodes used in the aluminium industry. The chapter 1 introduces the history of aluminium industry, and states the problems to resolve. Chapter 2 presents the state of the art about the electrical characterization of materials, mostly centered on the anode microstructure, and the several models used to characterize the different phases involved. It also presents a discussion of the model to justify the orientation choice of this project. Chapter 3 presents the methodology used to perform the laboratory experiments all along the steps of this project. Chapters 4 to 6 present the results and discussions of three major steps of this project, which lead to 3 scientific papers. Finally, the chapter 7 closes this work by bringing a conclusion and opening on potential further work.
xv
Chapter 4: Electrical resistivity measurement of petroleum coke powder by means of four-probe method
Authors: Geoffroy Rouget, Behzad Majidi, Donald Picard, Guillaume Gauvin, Donald Ziegler, Javad Mashreghi, Houshang Alamdari.
Journal: Metallurgical and Material Transaction B, 2017, 48B, 2543.
Geoffroy Rouget, Guillaume Gauvin, Donald Picard and Houshang Alamdari conceived and designed the experiments. Geoffroy Rouget and Behzad Majidi performed the experiments. Houshang Alamdari, Javad Mashreghi, Donald Picard and Donald Ziegler contributed to the data analysis. Geoffroy Rouget wrote the paper, all co-authors commented and corrected it.
Chapter 5: Electrical resistivity measurement of carbon anodes using Van der Pauw method.
Authors: Geoffroy Rouget, Hicham Chaouki, Donald Picard, Donald Ziegler, Houshang Alamdari.
Journal: Metals 2017, 7, 369
Author Contributions: Geoffroy Rouget and Houshang Alamdari conceived and designed the experiments; Geoffroy Rouget and Hicham Chaouki performed the experiments and numerical simulations; Donald Picard and Donald P. Ziegler contributed in data analysis; Geoffroy Rouget wrote the paper and all co-authors commented/corrected it.
xvi
Chapter 6: Electrical resistivity of green anodes modelling: the flaws of Nielsen’s model to predict green anode’s electrical resistivity.
Authors Authors: Geoffroy Rouget, Donald Picard, Donald Ziegler, Javad Mashreghi, Houshang Alamdari.
Journal: Unsubmitted yet
Geoffroy Rouget, Donald Picard and Houshang Alamdari conceived and designed the experiments. Geoffroy Rouget performed the experiments. Houshang Alamdari, Javad Mashreghi, Donald Picard, and Donald Ziegler contributed to the data analysis. Geoffroy Rouget wrote the paper; all co-authors commented and corrected it.
Appendix 2: Acoustic emission techniques to measure the properties of coke particles – A first foray.
Authors Authors: Geoffroy Rouget, Petre Manolescu, Donald Picard, Carl Duchesne, Houshang Alamdari, Duygu Kocaefe.
Proceedings of 35th International ICSOBA Conference, Hamburg, Germany, 2 – 5 October 2017.
Geoffroy Rouget, Carl Duchesne and Donald Picard conceived and designed the experiments. Geoffroy Rouget and Petre Manolescu performed the experiments and numerical simulation. Petre Manolescu, Donald Picard and Carl Duchesne, contributed to the data analysis. Geoffroy Rouget and Petre Manolescu wrote the paper; all co-authors commented and corrected it.
xvii
Appendix 3: Discrete Element Method Investigation of Bulk Density and Electrical Resistivity of Calcined Coke Mixes.
Authors Authors: Behzad Majidi, Geoffroy Rouget, Mario Fafard, Donald Ziegler, Houshang Alamdari.
Journal: Metals, 2017, 7, 154.
Behzad Majidi, Geoffroy Rouget and Houshang alamdari conceived and designed the experiments. Behzad Majidi and Geoffroy Rouget performed the experiments and numerical simulation. Behzad Majidi, Geoffroy Rouget and Houshang Alamdari, contributed to the data analysis. Behzad Majidi wrote the paper; all co-authors commented and corrected it.
Appendix 4: Formulation without Ultrafine Coke Particles: A Way to Increase the Features of the Carbon Anode.
Authors Authors: Francois Chevarin, Ramzi Ishak, Geoffroy Rouget, Donald Ziegler, Mario Fafard, Houshang Alamdari.
Proceedings of 35th International ICSOBA Conference, Hamburg, Germany, 2 – 5 October 2017.
Francois Chevarin, Ramzi Ishak and Geoffroy Rouget conceived and designed the experiments. Francois Chevarin, Ramzi Ishak and Geoffroy Rouget performed the experiments. Francois Chevarin, Ramzi Ishak, Geoffroy Rouget and Houshang Alamdari contributed to the data analysis. Francois Chevarin, Ramzi Ishak and Geoffroy Rouget wrote the paper; all co-authors commented and corrected it.
Chapter 1: Introduction
Aluminium is a light metal and the third most abundant element on the earth (8 % of earth crust) [1]. It is naturally found in the oxide state as a compound of bauxite and boehmite ores. Alumina, which is the aluminium oxide, is extracted from bauxite ore using the Bayer process. This process consists of calcination of crushed bauxite, then mixing of the calcined ore with sodium carbonate. The obtained product is then dissolved in a solution of sodium hydroxide, which allows by decantation, to separate the sodium aluminate from other constituents. The obtained solution is mixed with carbon dioxide to obtain aluminium hydroxide, which is calcined in rotary kilns to obtain pure alumina, ready to use in Hall-Héroult process [2].
In the Hall-Héroult process, alumina is dissolved in molten cryolite, at 960 °C. This process requires a strong current, delivered by the anodic blocks made of carbon. The current flows out of the cell through the carbon cathode, as exposed in Figure 1. The electrolytic reaction can be decomposed into two reactions: anodic and cathodic reactions.
The cathodic reaction can be expressed as:
2𝐴𝑙2𝑂3(𝑑𝑖𝑠𝑠)→ 4𝐴𝑙(𝑚)+ 3𝑂2(𝑔) (1.1)
The anodic reaction can be expressed as:
3𝐶(𝑠)+ 3𝑂2(𝑔)→ 3𝐶𝑂2(𝑔) (1.2)
The equation 1.2 shows that carbon anodes are used as reactant supply for the reaction. The global equation for the reaction is as following:
Figure 1. Scheme of an electrolysis cell. [3]
During the process, the voltage drop in an electrolysis cell is about 4 volts [4,5]. The current, passing through the cell to allow the reduction with good efficiency, is about 300 000 amperes [6]. According to the Hall-Héroult process, primary molten aluminium is obtained and collected at the bottom of the cell.
Aluminium is used in most of the sectors of industry, i.e. automotive, aeronautics, energy supply, food industry etc. The aluminium consumption increases continuously. Aluminium refining technology develops all around the globe, which induces an increasing competition between the different producers. Due to the difference in labour and energy cost, as well as depending on the laws regarding the sustainability of the aluminium production process, the improvement of the process is unbearable.
To produce aluminium according to the Hall-Héroult process, well refined alumina is required, as well as good quality carbon and efficient power supply. The refinement of alumina is well known and achieved through Bayer process; the carbon used in the aluminium factory is a by-product of petroleum refineries. As the anodes play both the roles of carbon and energy supply for the reaction, their quality and cost are of great
importance for the industry. In fact, anodes are subject to several flaws occurring during the fabrication process, such as poor mixing, crack developing, porosity and heterogeneous density. A better knowledge of the anode microstructure and physical properties may help improving the overall energy efficiency of the process and reducing carbon consumption. The work presented here is part of an overall project for the improvement of production process of carbon anodes. Carbon anodes represent an important part of primary aluminium cost, from 10 to 17 % [7]. Optimisation of anodes is more than necessary to improve the process of aluminium production.
1.1 Anodes for aluminum industry
Anodes provide the carbon required for the electrolytic reaction and part of the energy necessary to allow aluminium reduction. Electrical resistivity of anode is one of the most important properties, affecting the energy consumption of the process. Electrical resistivity of a material is an intrinsic parameter defining its ability to resist against a current flowing through it. This parameter is calculated by measuring the resistance of the material on a specific length through a defined section. Equation 1.4 defines mathematically the calculation of the electrical resistivity of a material.
𝑅 = 𝜌.𝐿𝑆 (1.4)
in which, R is the measured electrical resistance, L the length between the sensors and S the cross section through which the current flows.
Anodes are massive blocks of carbon, made of calcined petroleum coke [8] crushed in several size fractions, mixed with coal tar pitch [9], formed and baked at high temperature. In addition, particles of butt, the remaining part of consumed anodes, can be added to the recipe. The coke aggregates sizes range from a few micrometers for the smallest, to a few centimeters for the largest ones [10]. The amount of each size fraction must be adjusted to enhance the density of the block. Figure 2 exposes a schematic view of the microstructure of an anode.
Figure 2. Microstructure of a carbon anode block.
Like a sand castle, if the aggregates are “wet”, they will stick together, otherwise, they will fall apart. To allow the wetting of the particles, so they can be stuck together, coal tar pitch is used as binder. Its quantity is optimised to a just sufficient amount to wet all the particles, with no excess [5]. The mix of dry aggregates and coal tar pitch is called anode paste. To obtain the best anode paste, the mix shall not be too dry neither too wet [11]. The anode paste is mixed at a temperature of about 150 °C, and then formed in a specific shape by vibro-compaction or pressing, to reach its maximum density. After anode forming, still at 150 °C, the obtained block is cooled down in water. At this point, the green anode is formed. The green anodes are stored before being placed in the backing furnace. Hundreds of anodes are baked at once. It has to be noted that the coke aggregates used in the anode formulation are porous, at different level, usually depending on their size. Furthermore, during the baking of the anode, the volatile compounds of the pitch tend to escape from the anode. The volatiles leaving the anode let some porous volume inside the baked anode. When the pitch content is higher than required, the volatile fraction is higher and leads to a large amount of porosity in the anode block. The porosity if the baked anode is usually between 15 and 20 % [3].
Binder matrix 1
Pores 3
Aggregates 2
Coke aggregates contain pores. Those pores are classified in different types. As shown in Figure 3 [3], pore can be open “o”, closed “c”, blind “b” when leading to a dead-end, or transfer pores “t” when connected to the surface.
Figure 3. Different kinds of pores in coke particles and anodes. [3]
Anode recipe is variable and usually has a composition close to the following:
70 % of coke aggregates, 15 % of butt and 15 % of pitch. In anode production, seven size fractions of aggregates are generally used. Butt is usually used as coarser aggregates meanwhile fine particles are exclusively originating from raw coke [12]. The baking is the longest and most expensive stage of the anode production. For this reason, quality control of the green anode, prior to the baking is of great interest. The stages and principle of anode fabrication are presented in Figure 4.
Figure 4. Principle of anode fabrication. [13]
1.2 Objective
In the present work, the principal objective is to follow the quality of the carbon anodes along their fabrication process. As the baking of the anodes is a quite expensive process, their quality control prior to this step is of great importance. In the current industrial practice, the green anode is not characterized before baking. So, any defects can only be detected once the anode is baked, cored, and analyzed. The quality control of the green anode can therefore be beneficial in identifying the faulty anodes and discarding them before baking. Among different characterization methods, electrical resistivity measurement is an easy method to perform. However, this is basically done for the baked anodes. We intend to apply this method to characterize the green anode and associate its
electrical resistivity to other characteristics, i.e. composition, microstructure, and processing parameters.
The green anodes can be considered as a composite material, made of binder matrix and coke aggregates. Those constituents usually exhibit different values of electrical resistivity. The relative quantity of these constituents as well as their distribution may affect the overall resistivity of the composite. Electrical resistivity measurements could give some information about microstructure and composition of an anode. Thereby, it could help to differentiate areas in the green anode in which the ratio of binder matrix toward coke aggregates changes. To enable such investigation, a mathematical model is necessary to correlate the electrical resistivity of green anode with its microstructure, composition and the properties if its constituents. Furthermore, such a model may help optimizing the processing parameters to achieve more homogeneous and less resistive anodes.
The mathematical model required in this study shall be based on models developed for similar materials. Models developed for composite materials, such as asphalt or concrete might be used. These models should be first examined to choose an appropriate one best describing the anode material. Such a model should take into account the electrical properties of the individual constituents of anode, as well as some key microstructural parameters. Therefore, following hypothesis can be postulated:
- The study of the green anode’s electrical resistivity can be started from the study of the electrical resistivity of each constituent;
- The intrinsic electrical resistivity of the coke aggregates can be obtained separately, using a bed of these particles;
- The electrical resistivity of continuous phases, such as binder matrix or green anode, can be measured with a good accuracy;
- The evolution of a green anode microstructure or composition can be depicted by a mathematical model adapted to the similar materials, such as composites.
Chapter 2: Literature review
2.1 Anodes microstructure
Martin et al. [14] showed that different types of interfaces between binder matrix and aggregates may be found in green anodes. Figure 5 shows five different states of interfaces that can be encountered. Figure 5.a. shows a particle adjoining a large pore. At this point, the interface between binder and filler does not exist. Figure 5.b. and Figure 5.c. show cracked interfaces. The interface is totally cracked in Figure 5.b. and partially cracked in Figure 5.c. In Figure 5.d. the interface is porous; numerous pores are included in the interface and binder. Finally, Figure 5.e. shows a continuous interface between the particle and the binder, the contact is perfect all along the interface between the two phases.
Figure 5. SEM micrographes presenting five different classes of interface between coke and green binder matrix: a) voided interface, b) completely fissured, c) partially fissured, d) pored, e)
continuous. [14]
Rørvik et al. [15] showed that the porosity of coke particles depends on their dimension. It is shown in Figure 6 that two main peaks appear for almost each of the six different cokes investigated, all of those cokes were calcined cokes used in aluminium industry, provided by six different producers. The size distribution of pores in those cokes is between 10 and 50 µm, present for both coarse and fine particles, then another peak for particles bigger
than 1 mm, with a pore size between 100 and 300 µm. Even though pores of different sizes exist, both those size distributions seem to be more represented in those particles.
Figure 6. Pore size distribution, obtained by mercury porosimetry, for 3 different size fractions of particles and 6 different sources of coke. [15]
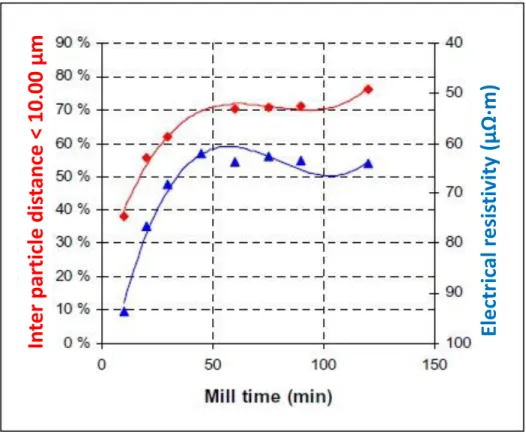
Rørvik et al. [16] showed the influence of inter-particle distance and thickness of the binder layer on the electrical resistivity of the green anode. The curves, presented in Figure 7 and Figure 8, show the evolution of both inter-particle distance, with pitch layer thickness and electrical resistivity as a function of the mixing time. These graphs reveal that the evolution of electrical resistivity of the material follows with a good correlation with the the increase of pitch layer and inter-particle distance.
Figure 7. Evolution of electrical resistivity and inter-particles distance of green anode as a function of milling time. [16]
Electr
ic
al
resis
tivity
(µ
Ω∙
m)
In
ter
particle
dis
tance
<
10.00
µm
Figure 8. Electrical resistivity and pitch layer thickness compared to milling time. [16]
The plots at Figure 9 represent the evolution of the electrical resistivity of the green material depending on the inter-particle distance and the pitch layer thickness. Both curves show a similar trend of the inter-particle distance and the pitch layer thickness toward the electrical resistivity of the material.
Electr
ic
al
resis
tivity
(µ
Ω∙
m)
Pit
ch
la
yer
<
10.00
µm
Figure 9. Inter-particle distance and pitch layer thickness compared to the electrical resistivity [16].
Important information brought by the previous figures reveals that the electrical
resistivity is directly influenced by the average distance between particles as well
as the thickness of the binding phase. The closer the particles and the less binding
material in between lead to a lower electrical resistivity.
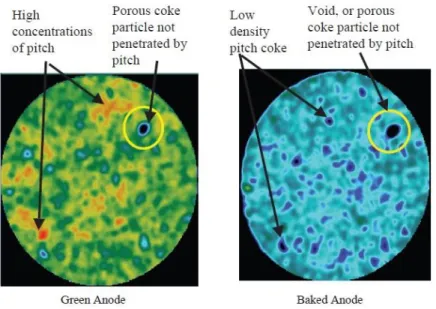
Adams et al. [17] showed the correlation between the microstructure of green and
baked anode in a study of anode cores by computed X-Ray tomography. It can be
seen that porous particles, in which pitch did not penetrate during mixing, remain
void after baking. Also, high concentrations of pitch areas in the green material
lead to low density of pitch-coke in the same areas after baking, as shown in both
Figure 10(Bottom of an anode by CT-Scan, green and baked) and
Figure 11(center
of an anode by CT-Scan, green and baked).
In
ter
particle
dis
tance
<
10.
00
µm
Pit
ch
la
yer
<
10.00
µm
Electrical resistivity (µΩ∙m)
Figure 10. Comparison of the bottom of an anode, before and after baking, using CT-Xr. [17]
Figure 11. Comparison of the center of an anode, before and after baking, using CT-Xr. [17]
Azari et al. [18-20] presented several papers relating the anode microstructure to the mean of fabrication. A paper, dedicated to the compaction properties of the anode, reports that the ratio of pitch over fine coke particles has an influence on the relative density that an anode can reach, at a laboratory scale [18]. The statement presented in this work
completes information provided by Smith [21] on the optimization of pitch content in the anode recipe. Furthermore, another article is more specifically dedicated to the influence of the physical properties of the coke aggregates on the compaction of the green anode [19]. This work gives also an indication on the differences that can be encountered between cokes provided by multiple providers. Finally, unlike the previous articles, which are focused on the recipe and raw material characteristics, a third article, published by Azari et al. [20], shows the influence of the mixing parameters on the anode properties, such as mixing time and mixing temperature. This work shows that small changes may have a strong effect on porosity and density of the green anode.
2.2 Electrical resistivity of anode
Electrical resistivity of anodes has been studied along the years, as an intrinsic property of the anode block [4] or its influence on the overall process [22]. More recently, several studies were performed to investigate more deeply the components of the anodes. The quality control of the anode block has led to several papers from a research group at Chicoutimi, Québec [23- 26].
The electrical resistivity of a composite material, such as anode, is directly related to its own composition and microstructure. Assumptions were based on the works of Rørvik et al. [16], in one hand, and the fundamentals of electrical percolation, represented in Figure 12, from Lux review [27], on the other hand. Due to the electrical resistivity measured for the binder matrix in the laboratory, one can state that, the binder matrix in a green anode is fairly conductive. This range of conductivity implies its composition to be above its percolation threshold, resulting in a sufficiently low electrical resistivity.
Electrical percolation is a well-known phenomenon in composite materials. Percolation is reached when at least a path is created for the current to pass through a non-homogeneous media. In the case of composite materials, in which the matrix is insulating and the filler is conducting, the percolation threshold is reached when the electrical resistivity of the material decreases from a very high value to a value which can be considered fairly well conductive. In other words, percolation threshold is reached when the composite is no longer insulating [27]. This corresponds to the first cluster of particles passing through the whole media.
When the electrical percolation threshold is reached, the drop of electrical resistivity is sudden. As the first electrical path is created, adding more conductive filler will enhance rapidly the number of electrical paths in the media.
Figure 12 shows a curve depicting the electrical conductivity rise at the percolation threshold for a binary composite, composed of an insulating matrix (polypropylene) and conductive filler (carbon black). The rise of electrical conductivity is clearly observable at 3 % in weight of carbon black.
Figure 12. Curve of percolation of a composite made with polypropylene matrix and carbon black conductive filler. [27]
In the case of carbon anode, both the binder matrix and the filler have a non-negligible electrical conductivity, or a low enough electrical resistivity. Beside coke aggregates and binder matrix, both green and baked anodes contain pores. These voids in a material may have an influence on its electrical conductivity. From the previous model, none of them exhibit the eventuality of a third component. In the case of anodes, the porosity of the coke aggregates is most likely to remain the same during the forming and baking process, nevertheless, larger open pores on the surface might be partially filled during mixing [28]. Works dealing with the influence of porosity on electrical conductivity are more often concerned about the influence of the penetration of a conducting electrolyte in an
insulating material, such as rock or soil. In the case of anodes, pores are voids through which the lack of material will inhibit the ability of electrons to flow. Some models found in the literature treat the problem in the same direction as eventually required in this work.
2.2.1 Electrical resistivity models for composite materials
In the previous section, we saw that the work performed by Rørvik et al.[16] showed that the green anode may behave as a resistive material, depending on its microstructure, restrained to the thickness of the pitch layer between particles, and the inter-particle distance. The specific electrical resistivity obtained in such a material is maintained between 60 µΩ∙m for the best case scenario, to more than 90 µΩ∙m for the worst case presented. It was also specified that both coke particles and binder matrix are the most prevalent components of the green anode, so they are more likely to give the higher contribution to the variation of the electrical resistivity of the green material.
2.2.1.1 Kirkpatrick and Zallen model
Kirkpatrick [29] and Zallen [30] work launched a new perspective on the understanding of statistical percolation of binary systems. Working on statistical binary systems usually implies to work on sites and arrays. Those sites and arrays are usually designed following cubic lattices, such as simple cubic, centered cubic or face-centered cubic, to describe the system investigated. It is possible to determine which of the sites or arrays are filled in the system, depending on the statistics laws. The number of sites or arrays is determined and implemented in a larger area. Percolation threshold is reached when a network of sites or arrays joins through the whole surface.
Kirkpatrick and Zallen works lead to an equation allowing determining the electrical resistivity of a composite material with insulating matrix and conductive filler, depending on the volume of the filler at percolation, and the effective volume of filler as well as its own electrical resistivity.
𝜎 = 𝜎0(𝑉 − 𝑉𝑐)𝑆 (2.1)
In this equation, σ refers to the electrical conductivity of the composite material, σ0 is the
theoretical volume of the filler at percolation concentration. The parameter S is a superscript related to the model, determined by curve fitting.
2.2.1.2 Jansen, Aharoni and Gurland model
Jansen [31], Aharoni [32] and Gurland [33] contributed to improve the law originally proposed by Kirkpatrick and Zallen. Jansen [31] based his work on Aharoni [32] and Gurland [33] results, which pointed out the importance of the number of contacts between direct neighboring sites. As soon as the number of direct neighbouring contacts is superior to 2, an unidimensional network is created, leading to the creation of a conductive network. The equation finally proposed by Jansen is as follows:
𝑉𝐶 = 1 (1 + 0,67𝑧𝑑𝜀)⁄ (2.2)
In this equation, Vc remains as the volume of filler at percolation concentration, z is the coordination number in a specific pattern, d is the density of the filler and ε is the specific pore volume of the filler. In both models presented previously, only the electrical resistivity of the filler is taken into account while in anode material, both filler and matrix show a non-negligible electrical conductivity. Thus, Jansen’s model takes into account only the porosity of the filler not that of the matrix.
2.2.1.3
Scarsbrick’s model
In a totally different way, Scarsbrick [34] proposeed a statistical model in which the percolation threshold of the composite is not taken into account. Scarsbrick model is expressed with the following equations:
𝜎 = 𝜎𝑐𝑝𝑛𝐶2 (2.3)
𝑝𝑛 = 𝑉𝑓∙ 1 𝑉𝑓2/3
⁄ (2.4)
in which σ refers to the composite’s electrical conductivity, σc to the electrical conductivity
appears. Vf in Equation 2.4 is the volume fraction of the conductive phase, and C2 is the
surface fraction of the conductive face in contact with the measuring probe. As well as the previous models, electrical conductivity of the matrix is not taken in to account.
2.2.1.4
Bueche’s model
Based on Flory’s work, Bueche [35] proposed a model for electrical resistivity of polymers’ gelation. This model was meant to explain the typical shape of curves obtained for binary mixtures. As shown in Figure 12, in the percolation area, the curves representing the evolution of electrical conductivity of binary mixture are in “S” shape.
𝜌∗
𝜌2=
𝜌1
(1−𝑣1)+𝑣2𝑤𝑔𝜌2 (2.5)
In this model (Equation 2.5), ρ* stands for the composite’s electrical resistivity, ρ1 for the
electrical resistivity of the conductive filler, and ρ2 for the electrical resistivity of the
insulating matrix. v1 is the volume fraction of the conductive phase, v2 is the volume
fraction of insulating matrix and wg is the volume fraction of the conductive filler in an
infinite cluster. Unlike the previous models, Bueche’s model takes into account of the electrical resistivity of the continuous and the binder phases. However, no other physical parameters are taken into account.
2.2.1.5
Nielsen’s model
Nielsen [36, 37], based on Halpin and Tsai [38] equations, developed the theory of elastic modulus for bi-phased composite materials. Then, he used the facts that electrical and thermal behaviour of composite materials are similar to their mechanical behaviour, as described by Ashton et al. [39], as well as Springer and Tsai [40]. Based on this hypothesis, he proposed a model to describe the electrical behaviour of composite materials. The equation proposed by Nielsen also takes into account the shape of the dispersed phase. This relationship goes deeper than a simple mixing rules. It takes into account the electrical conductivity of the two phases, as well as the shape, the volume fraction and the compactness of the dispersed phase (aggregates in the case of this work). The proposed equations by Nielsen, based on Halpin and Tsai work, are as follows:
𝜎 𝜎1= 1+𝐴𝐵𝛷2 1−𝐵𝜓𝛷2 (2.6.a) 𝐴 = 𝑘𝐸− 1 (2.6.b) 𝐵 =(𝜎2⁄ )−1𝜎1 (𝜎2𝜎 1 ⁄ )+𝐴 (2.6.c) 𝜓 = 1 + (1−𝛷𝑚 𝛷𝑚2 ) 𝛷2 (2.6.d)
In equations 2.6.a – 2.6.d, σ stands for the conductivity of the composite. Subscripts 1 and
2 designate, respectively, the continuous and the dispersed phases. The factor A is related
to the aspect ratio of the filler particles, depending on the value of the generalized Einstein Coefficient kE. Table 1 gives the relationship existing between the factor A and the aspect
ratio of the filler, and its orientation toward the electrical flow. The parameter B depends on the electrical resistivity of both continuous and dispersed phases, as well as the factor A. The Value of B remains constant in a specific case of study, in which only the volume fraction of the filler evolves. The parameter ψ is determined as a function of the maximum packing fraction, Φm, and the actual volume fraction, Φ2, in the composite, which is
determined by its own composition. Figure 2 helps to describe the microstructure of the green anode, where the numbered phases relate to the equation.
Table 1. Values of coefficient A depending aspect ratio and orientation of the filler. [36/37]
Type of dispersed phase Direction of current flow A factor
Spheres Any 1.5
Aggregate of spheres Any (2.5/ϕ)-1
Randomly oriented rods
Aspect ratio = 2 Any 1.58
Randomly oriented rods
Aspect ratio = 4 Any 2.08
Randomly oriented rods
Aspect ratio = 6 Any 2.8
Randomly oriented rods
Aspect ratio = 10 Any 4.93
Randomly oriented rods
Aspect ratio = 15 Any 8.38
Uniaxially oriented fibers Parallel to fibers 2L/D Uniaxially oriented fibers Perpendicular to fibers 0.5
Specific values for Φm parameter are presented in Table 2, depending on the shape and
the type of packing. In the case of anodic material, Φm is typically obtained after VBD
measurement (vibrated bulk density). Nielsen’s model was widely used since it was proposed and usually provided accurate results in the various situations it was investigated [41, 42].
Table 2. Common values of
Φ
m for specific packing lattices. [36]2.2.2 Models describing the influence of porosity on electrical resistivity
2.2.2.1 Hakamada et al. Model
The work published by Hakamada et al. [43] proposed a model describing the influence of porosity on electrical resistivity of aluminium foam. In this work, the porous fraction of the foam is ranged between 75 and 90 % of the whole volume. Hakamada et al. proposed to observe the influence of the porous fraction for a steady pore size, then the influence of pore size for a steady porous fraction. The variation in electrical resistivity is first measured on several samples with increasing porous volume. Then, the electrical resistivity is measured while pore size changes from smaller pores to coarser pores, for a constant porous fraction. In this model, it is assumed that the material is considered as opened cubes stacked onto each other. Those cubes are referred as unit cells, with length L, internal volume D3, and pores opening o. ρP stands for the electrical resistivity of the
porous material; meanwhile ρM refers to the resistivity of the pure material constituting the
matrix. K is a constant established as a correction factor. Figure 13 describes the unit cells and the specific lengths of the cubes.
Figure 13. Illustration model of unit-cells used by Hakamada et al. [43]
The porosity of the cells is calculated using the equation 2.7:
𝐷3+ 𝑜2(𝐿 2−
𝐷
2) = 𝜃𝐿3 (2.7)
The parameters of the equation stand as θ for the porosity, L for the length of the unit cell,
D for the inner length of the pore, and o for the opening of the pore.
The electrical resistivity of the porous foam is obtained by using the numerical model presented at the equation 2.8.The results provided by this study show an evolution of the electrical resistivity as a function of the porosity. However, the electrical resistivity tends to remain steady when the pore volume remains constant and only the pore size changes.
𝜌𝑃= 𝐾𝐿𝜌𝑀(𝐿−𝐷 𝐿2−𝑜2+ 𝐷−𝑜 𝐿2−𝐷2+ 𝑜 𝐿2−𝐷2−2𝑜(𝐿−𝐷)) (2.8)
The model presented in equation 2.8. describes the resistivity of the material while changing its porosity. Numerical simulation allowed obtaining results for different porosities. Those results were compared to the equivalent situation obtained in laboratory. This model appears to provide satisfying results for metallic foams.
Figure 14 shows the influence of porosity on electrical resistivity when pore size is maintained between 425 µm and 500 µm. This shows that, for constant pore size, the electrical resistivity increases strongly when the porosity increases, especially for the values beyond 80 %.
Figure 14. Electrical resistivity of aluminium foam depending the porosity, for single sized pores. [43]
Figure 15 shows the evolution of electrical resistivity of the material when its porous volume is maintained at 85 %, but pore size increases from 200 μm to 900 μm. Experimental results showed that resistivity did not change for pore size between 200 μm and 650 μm, but then an increase in resistivity was noted for pores of 900 μm in size. The model, however, assumed there would not be changes in electrical resistivity.
Figure 15. Electrical resistivity of aluminium foam depending pore size, constant porosity. [43]
2.2.2.2 Bhattacharyay et al. Model
More recently, Bhattacharyay et al. [44] proposed a model allowing predicting the electrical resistivity of porous coke particles, constituting baked anodes used in Hall-Héroult process (Equation 2.9).
𝜌𝑓
𝜌𝑐 = 𝜓 + (1 − 𝜓)
𝜌𝑓
𝜌𝑎 (2.9)
In this equation, ρ stands for the electrical resistivity. Subscripts f, c, and a designate non-porous coke, non-porous coke and air, respectively. Ψ is the coke porosity. This law is a typical mixing rule in which one phase is coke; the other is air, representing the porosity. The author proposes a correlation factor τ, based on the work of Shimitzu et al. [45], including particles size, their hardness, as well as density of the baked anode, as described in Equation 2.10:
𝜌𝑒𝑓𝑓=1−𝜑𝜌𝜏 (2.10)
In this equation, τ is the correlation factor, ρeff is the electrical resistivity of baked anode, ρ is the electrical resistivity of anodic material without pores, and φ is the porosity of baked
anode. Experimental results, presented in Chmelar [46] thesis, were treated using numerical analysis in order to validate this model. This model is a good approach to predict the electrical resistivity of baked anodes.
2.2.2.3 Carson et al. Model
Carson et al. [47] published a well-detailed study on the thermal conductivity of bi-phased composites, such as some dishes found in food industry. As mentioned previously, basic laws of thermal conductivity are shared with electrical conductivity when the heat transfer is restricted to thermal conductivity, excluding convection and radiation. This allows though using work achieved for thermal application in the case of electrical conductivity. In this study, Carson et al. presented several configurations of thermal conductivity of materials. In the first case, presented in equation 2.11, the equivalent conductivity kes, is obtained for
two materials, noted with subscripts 1 and 2, which are placed in series. This is the case of the materials 1 and 2 placed one after the other toward the current flow. In the equation (2.12) kep is the equivalent conductivity for a material placed in parallel, so the materials 1
and 2 are placed parallel to the flow of current.
Latter, the Maxwell-Euken equation, (2.13), as described for equation (2.11) and (2.12), is based on a specific physical structure, in which the materials 1 and 2 are neither place in parallel nor in series. This gives the model less restriction for use.
Finally, Maxwell-Hamilton equation (2.14), which is based on Maxwell-Euken equation, adds a parameter n related to the structure of the material.
Model series: 𝑘𝑒𝑠=(1−𝑣2) 1 𝑘1 ⁄ +𝑣2 𝑘2 ⁄ (2.11) Model parallel: 𝑘𝑒𝑝= (1 − 𝑣2)𝑘1+ 𝑣2𝑘2 (2.12) Maxell-Euken model: 𝑘𝑒= 𝑘12𝑘1+𝑘2−2(𝑘1−𝑘2)𝑣2 2𝑘1+𝑘2−(𝑘1−𝑘2)𝑣2 (2.13) Maxwell-Hamilton model: 𝑘𝑒= 𝑘1(𝑛−1)𝑘1+𝑘2−(𝑛−1)(𝑘1−𝑘2)𝑣2 (𝑛−1)𝑘1+𝑘2−(𝑘1−𝑘2)𝑣2 (2.14)
In the work presented by Carson et al., the investigations were made on both the size and the shape of the inclusions (pores), as well as on the relative influence of the phases onto each other (dispersed phase being either the more or the less conductive), and finally, the effect of contact between inclusions. In the case of equation 2.11 to 2.14, inclusions shall have no contact between each other. The presented models expose the preliminary work done concerning the electrical or thermal resistivity of bi-phased material, considering rather simple cases.
2.3 Method of characterization of electrical resistivity of materials
2.3.1 Electrical resistivity of powders
Measurement of electrical resistivity of powders is usually performed using an insulating rigid tube, in which the powder sample is placed, between to metallic plates. Generally, two kinds of measurements can be used. Either using two probes [48-50], acting both as current supply and voltage drop measurement, or four probes [51-56], in which two probes provide the current, and two probes measure the voltage drop separately. Due to the contribution of measuring probes resistance, two-probe setting is usually used in the case of poorly conducing materials. For more conductive materials, four-probe setting will be privileged. This can be explained by the fact that, as the voltmeter has a very high internal resistance and it is placed in parallel in the case of four-probe setting, the measuring circuit does not take part in the measured circuit. In this configuration, the measuring circuit, the voltmeter, acts as an inert spectator. In the case of a two-probes setting, both power supply, including generally the Ampere-meter, placed in series but having a negligible resistance, and the voltmeter, placed in parallel, are part of the same circuit. In this case, the probes between the voltmeter and the other part of the circuit have an influence on the measurement, as well as the voltmeter itself. In the case of fairly good conductors, this configuration enhances an error in the measurement and increases the measured actual resistance. Following both configurations, the current applied through the sample can be either direct [48,52-54] or alternative [49-52,55-57]. The direct current is used to measure the resistance of the bulk material. This technique may not allow differentiating the intrinsic resistance of the material and the potential resistance due to surface effect, such as oxidation layer, for example. Alternative current allows separating the real part of the impedance measured, which corresponds to the pure resistance, and eventually part of a capacitive or inductive effect. When plotting the Argand diagram,
![Figure 3. Different kinds of pores in coke particles and anodes. [3]](https://thumb-eu.123doks.com/thumbv2/123doknet/3686385.109309/22.918.250.672.238.479/figure-different-kinds-pores-coke-particles-anodes.webp)

![Figure 8. Electrical resistivity and pitch layer thickness compared to milling time. [16]](https://thumb-eu.123doks.com/thumbv2/123doknet/3686385.109309/29.918.208.715.103.530/figure-electrical-resistivity-pitch-layer-thickness-compared-milling.webp)
![Figure 9. Inter-particle distance and pitch layer thickness compared to the electrical resistivity [16]](https://thumb-eu.123doks.com/thumbv2/123doknet/3686385.109309/30.918.188.738.102.556/figure-inter-particle-distance-thickness-compared-electrical-resistivity.webp)
![Figure 13. Illustration model of unit-cells used by Hakamada et al. [43]](https://thumb-eu.123doks.com/thumbv2/123doknet/3686385.109309/39.918.183.730.226.612/figure-illustration-model-of-unit-cells-used-hakamada.webp)

![Figure 16. Optimization of pitch - fines ratio depending BN of the sample. [21]](https://thumb-eu.123doks.com/thumbv2/123doknet/3686385.109309/47.918.235.669.660.965/figure-optimization-pitch-fines-ratio-depending-bn-sample.webp)