QUALITY CONTROL VIA ELECTRICAL RESISTIVITY MEASUREMENT OF
INDUSTRIAL ANODES
Yasar Kocaefe, Duygu Kocaefe, Dipankar Bhattacharyay
1University of Québec at Chicoutimi; 555 Boulevard de l'Université, Chicoutimi, QC, G7H 2B1, Canada
Keywords: Carbon anodes, anode quality, quality control, electrical resistivity, non-intrusive resistivity measurement Abstract
Aluminum production requires the use of carbon anodes. Anode quality influences strongly the cell stability, energy consumption, GHG emissions, and production cost. Current practice for anode quality evaluation (visual inspection and analysis of a core taken from the top of a small number of anodes produced) gives limited information.
A simple and non-intrusive technique has been developed to measure the electrical resistivity distribution in industrial anodes with the objective of using it for on-line quality control in the paste plant to eliminate defective green anodes. This helps avoid the unnecessary baking of substandard anodes and reduces energy consumption and GHG emissions. The technology could ultimately be used also for baked anodes. The electrical resistivity is a distinctive characteristic of anode quality, and its distribution indicates anode homogeneity. In this article, the measurement technique will be explained and results will be presented which demonstrate its use for the determination of anode quality.
Introduction
Carbon anodes are used for the electrolytic production of aluminum. The anode quality influences the stability of cell operation, the energy and carbon consumptions during electrolysis, and consequently the environmental emissions and production cost. The quality of anodes is monitored either by surface inspection (manual or automatic) or by taking a core sample from upper part of 1.5-2.0% of the anodes produced. A more rapid and reliable inspection system would help improve the anode quality significantly.
Anode manufacturing is done in two main steps: green anode production in the paste plant and baking to produce baked anodes. The green anodes are made of a paste which is a mixture of dry aggregates (petroleum coke, recycled butts and green/baked anodes) with coal tar pitch as the binder. The mixing is done in a mixer or a kneader. This is followed by the compaction of the paste using either a press or a vibro-compactor. The produced green anodes are cooled and stored until baking. The green anodes are baked in large furnaces. After rodding of the baked anodes, the anode assemblies are used in the electrolysis cells.
The anode quality depends on the raw material properties and the operating parameters of the manufacturing process. Any problem in any area of production or in raw material property is usually reflected in anode quality. Pitch properties, granulometry of the dry aggregate, anode recipe, all process parameters could influence the anode quality [1-8] resulting in inhomogeneity of anodes, cracking, etc.
Anode quality is determined by the appropriateness of anode properties. Electrical resistivity is an important property which
shows the state of an anode. High resistivity values indicate a potential problem with cracks in a baked anode and the presence of cracks or high pitch concentration in green anodes. Overpitching could cause problems further along the process such as high porosity/cracks in baked anodes due to higher devolatilization from such anodes. The distribution of electrical resistivity in an anode shows the level of homogeneity in an anode. Inhomogeneous anodes will have a large electrical resistivity distribution. All such problems will have consequences later on during baking and electrolysis resulting in high energy and carbon consumption. This article presents a measurement technique which can give the electrical resistivity distributions in an anode (green or baked). Here, the objective is the determination of the green anode resistivities since this will help remove a defective anode from the process at an early stage of production and avoid further processing.
A number of publications are available on the electrical resistivity measurement of anodes. Seger [9-10] was first to propose a system for such measurements for baked anodes. The current was applied in the stub holes and left the anode from the bottom surface. The system had multi-probes to measure the current and the voltage drop between the stub hole and the measurement point at the bottom. The average resistivity was measured for the anode. The same idea was later used by Chollier-Brym et al. and Léonard et al. [11-12] (the equipment was called MIREA). The objective was to try and recreate the current distribution in an anode during electrolysis. The current is passed from the stub holes to the anode bottom surface where metallic brushes completed the circuit. The voltage drop is measured between the reference probes on the top surface located between the stub holes and the probes located on the side surfaces at different heights. They were able to determine the anode resistivity based on a calibration with a model. The distribution of voltage drop values where the probes are placed gives an indication of the presence defects in the measurement area. The detection of defects outside this region would be indirect and difficult to pinpoint. The first generation of MIREA used inflatable bags in the stub holes for current contact. The second generation of MIREA uses metallic brushes and makes it easier to use on-line. MIREA is designed for baked anodes.
An apparatus was proposed by Haldemann and Fawzi [13] based on the eddy current losses induced by a coil and electrical resistivity measurements on one of the anode surfaces. The combination of the two measurements provided the information on anode quality. The use of four points on one surface and the limitation of the magnetic field for penetration into a large carbon block make this apparatus difficult to use in an industrial setting for anode quality determination. Limited testing on small samples has been done, but there does not seem to be any application to industrial anodes.
Audet and Parent [14] proposed a system for measuring the average electrical conductivity (the reciprocal of resistivity) of anodes within the top layer of about 11-cm thickness. A coil creates a magnetic field in the anode, and the change in impedance is measured. The signal is compared with that from a homogeneous defect-free anode. This system was proposed for green anodes; however, it has not been tested. The testing was done on a baked anode. The information obtained is limited to the top of the anode, and this is not usually sufficient to judge the quality of an anode. The last two systems are difficult to implement in the plant environment and give limited information. The electrical resistivity is an important anode property, and its distribution in an anode is a good indicator of the anode quality and possible defects. However, there is no equipment currently in use to measure the electrical resistivity of green anodes effectively. This article presents a measurement technique for such an application and the results obtained with a preliminary prototype. This technique could be applied on-line for anode quality control purposes.
Measurement Technique
The measurement technique described here could be used to measure the distribution of electrical resistivity in an industrial anode based on a simple, fast and non-intrusive method. At multiple points, a current is passed through the anode block from one surface to the opposite surface and the corresponding voltage drop is measured. The electrical resistivity then can be calculated across the anode at all the measurement positions. This technique could be used for both green and baked anodes; however, the objective is the measurement of green anode electrical resistivity distribution. The current level is low (in the order of about 10 amperes), which makes it easy to implement in the plant. Low current levels also ensure that any perturbation in the anode is minimal (such as the possibility of local heating due to Joule effect).
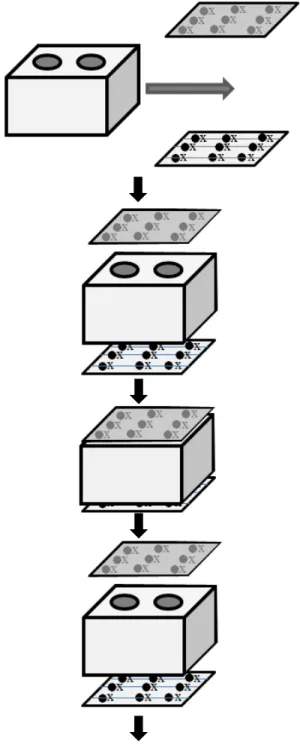
Four plates are used to carry out the measurements: two plates between the top and bottom surfaces of the anode and two plates between the side surfaces that are perpendicular to the direction of slots (because any measurement across slots would not be of any use). Each pair of plates contain a certain number of flexible contacts at exactly the same positions to feed current from one anode surface and to receive from the opposite anode surface. These contacts are connected to a power supply and make a complete circuit. Close to the current contacts, the voltage contacts are installed on both plates to be able to measure the voltage drop at a given position. The current and voltage contacts are distributed over the plate covering the entire anode surface. The steps of operation for the technology are shown in Figure 1. The anode on a conveyor comes into the measurement position. The top and bottom plates approach the anode providing current and voltage contacts with the top and bottom anode surfaces. Then the current is passed, and the voltage drops are measured at each position. Then these two plates move back to their positions, and the other pair of plates approach the anode. The same procedure is applied between the side surfaces. Then, the anode moves on leaving the measurement station free for the next anode. The duration of measurement is estimated to be less than a minute per anode.
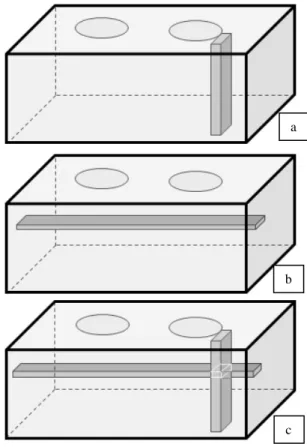
Measurements between a pair of plates give the electrical resistivity distribution across them as illustrated in Figure 2. Figure 2a shows the electrical resistivities measured between top and bottom plates, and Figure 2b between side plates. Mapping of the resistivities in two directions gives the distribution in the entire volume. This also identifies the region of high resistivities as illustrated in Figure 3. The measurements between top and bottom plates show the high resistivity regions in the vertical direction; and those between side plates give the high resistivity regions in the horizontal direction. Mapping of the two directions indicates the region of high resistivity in the anode. The average electrical resistivity of an anode can also be calculated from the resistivity distribution.
Figure 1. The sequence of operations for the electrical resistivity measurement of industrial anodes
The measurements are carried out at multiple positions covering the entire anode volume, and this gives a detailed distribution of electrical resistivity. The defects in an anode cause different problems during electrolysis. The ones that are along the current path increase the energy consumption, and those that are near the top of the side surfaces increase the air reactivity and thus carbon consumption, etc. As stated previously, the objective of this work is to measure on-line the green anode electrical resistivity. This will help identify the defective anodes early in the process and avoid further treatment of such anodes. The position and the frequency of defects will give an indication of possible problems in the paste plant. This will help take the necessary action to correct the problem with minimum delay.
Figure 2. Distribution of electrical resistivity depending on the pair of plates used: (a) top and bottom plates, (b) side plates.
Figure 3. The determination of high resistivity region in an anode: (a) high resistivity region (vertical block) from the measurements between the top and bottom plates; (b) high resistivity region (horizontal block) from the measurements between the side plates; (c) high resistivity region (intersection of 2 blocks) in the anode obtained from the mapping of the above two cases.
a
b
a
b
Methodology
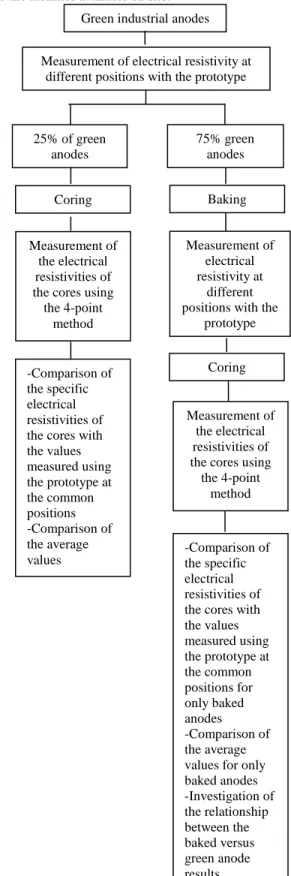
The technique was tested on small anodes produced in the lab. The resistivity distribution was determined and the high resistivity regions were identified. Then, these regions were examined using different diagnostic tests (microscopy, tomography, etc.). The results of these tests confirmed the results of the resistivity measurement technique discussed above quite well. In order to test the technique on large industrial anodes, the methodology presented in Figure 4 was used.
A preliminary, static, and low cost prototype was built. The electrical resistivity measurements were carried out on more than 24 industrial green anodes with the prototype. Then, 25% of the anodes were cored at multiple positions, and the electrical resistivity of each core is measured using the four-point method. The remaining 75% of the anodes were baked and then the same procedure was applied. The resistivities of the baked anodes were measured with the prototype; then the anodes were cored, and the resistivities of the cores were determined using the four-point method. The coring was part of a much greater measurement campaign in the plant, and the core positions were not necessarily the same as those used during the measurements with the prototype. The electrical resistivity distribution as well as the average resistivity for each anode was determined. Various comparisons were made between the core resistivities and those measured by the prototype: average anode resistivities, resistivities at the common positions (coring vs prototype as illustrated in Figure 5), baked vs. green anode resistivities, etc. All the measurements with the prototype were done manually, which was quite challenging and cumbersome. Some of the results are presented in the next section.
Results and Discussions
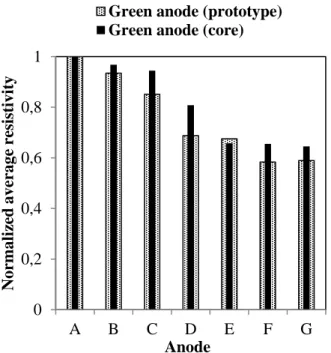
Various comparisons were made based on the measurements on anodes with the prototype as well as those on the cores. Figure 6 presents the normalized average resistivities calculated for a number of anodes using: all points of measurement for the prototype and all resistivity values for the cores for each anode. The results show a good correlation between the two sets of values for the green anodes. The prototype measurements predict in general quite well the resistivities of green anodes.
Figure 7 compares the normalized resistivities measured by the prototype at the same positions for an anode before and after baking. The magnitudes of the actual resistivities are quite different, still a good correlation is observed between the two sets of data. Many changes occur during baking in the anode. Also, since the objective of this work is to test the green anodes and to determine the defective anodes from the results of these tests, this correlation is important. This shows that the prediction of anode quality with the green anodes holds true for the baked anodes. It was also found previously that high resistivity green anodes result in high resistivity baked anodes [15].
The technique presented in this article would help eliminate the high-resistivity (defective) green anodes. Then, the average anode resistivity used in the electrolysis would decrease. This is illustrated in Figure 8 qualitatively. Assuming the given distribution of specific electrical resistivity as a function of anodes produced, the anodes in the box would be eliminated leading to the use of anodes with a lower overall average resistivity in the cell and consequent lower energy consumption. The number of
anodes that can be eliminated would depend on the plant, the process, and the facilities available on site.
Figure 4 Methodology used to tests the technique on industrial anodes.
Green industrial anodes
Measurement of electrical resistivity at different positions with the prototype
25% of green anodes 75% green anodes Coring -Comparison of the specific electrical resistivities of the cores with the values measured using the prototype at the common positions -Comparison of the average values Baking Measurement of electrical resistivity at different positions with the
prototype
Coring Measurement of
the electrical resistivities of the cores using the 4-point
method
Measurement of the electrical resistivities of the cores using the 4-point method -Comparison of the specific electrical resistivities of the cores with the values measured using the prototype at the common positions for only baked anodes -Comparison of the average values for only baked anodes -Investigation of the relationship between the baked versus green anode results
Figure 5. A schematic representation of the common positions for coring and resistivity measurement with the prototype.
Figure 6. Comparison of the prototype results with those of the cores for the average normalized resistivities of green anodes: (averages calculated using all points of measurement for the prototype and all resistivity values of the cores).
Figure 7. Comparison of the normalized resistivities measured by the prototype at a number of positions for an anode before and after baking.
The technique presented in this article would help eliminate the high-resistivity (defective) green anodes. Then, the average anode resistivity used in the electrolysis would decrease. This is illustrated in Figure 8 qualitatively. Assuming the given distribution of specific electrical resistivity as a function of anodes produced, the anodes in the box would be eliminated leading to the use of anodes with a lower overall average resistivity in the cell and consequent lower energy consumption. The number of anodes that can be eliminated would depend on the plant, the process, and the facilities available on site.
Currently in the literature, there is no industrial equipment in the market which can determine the on-line the electrical resistivity of green anodes. The elimination of defective green anodes will help avoid the unnecessary baking of such anodes and reduce the energy and carbon consumption in the electrolysis. Consequently, GHG emissions and the smelter operating cost will decrease. Also, the electrical resistivity of the green anodes will help diagnose problems in the paste plant and facilitate their rapid solution.
Figure 8. The distribution of anode electrical resistivity and the elimination of high resistivity anodes (indicated by the box on the right).
Conclusions
A measurement technique for a simple, rapid, and non-intrusive measurement of green anode electrical resistivity has been developed. A first preliminary prototype was built to demonstrate the concept. The tests done in the lab and on industrial anodes are quite promising. Efforts are underway to build a second and more robust prototype to continue further testing. A provisional patent application has been submitted [16]. The on-line use of this technique for anode quality control will allow the identification of defective anodes early in the process (avoiding further processing) and will indicate potential problems in the paste plant. Also, the elimination of such anodes will decrease the average anode resistivity reducing the energy consumption in the cell. Since the baking of defective anodes is circumvented, the fuel in the baking furnace will be used more effectively. Use of better quality anodes during electrolysis is likely to reduce the carbon consumption as well. There will be also reduction in environmental emissions (including GHG) through decreased energy and carbon consumption.
The current quality control methods are either subjective (based on external inspection) or give a feedback long after the anode is produced (with the analysis of a core obtained from the upper part of 1.5-2% of the anodes produced). The technique presented in
0
0,2
0,4
0,6
0,8
1
A
B
C
D
E
F
G
N
o
rm
a
li
zed
a
v
era
g
e resi
st
iv
it
y
Anode
Green anode (prototype)
Green anode (core)
0
0,2
0,4
0,6
0,8
1
1
2
3
4
5
6
N
o
rm
a
li
zed
resi
st
iv
it
y
Measurement position
Green anode (prototype)
Baked anode (prototype)
this article would increase the dependability of anode quality inspection in the smelters.
Acknowledgements
The technical and financial support of Aluminerie Alouette Inc. as well as the financial support of the National Science and Engineering Research Council of Canada (NSERC), Développement économique Sept-Îles, the University of Québec at Chicoutimi (UQAC), and the Foundation of the University of Québec at Chicoutimi (FUQAC)are greatly appreciated.
References
[1] Tkac, M., Porosity development in composite carbon materials during heat treatment, Thesis for the degree of philosophiae doctor, Norwegian University of Science and Technology, (2007), 27-37.
[2] Azari, K., Hany, A., Haushang, A., Picard, D., Fafard, M., Ziegler, D., Effects of physical properties of anode raw materials on the paste compaction behavior. Light Metals (2011), 1161-1168.
[3] Hulse, K. L., Anode Manufacture: Raw Materials, Formulation and Processing Parameters, R&D Carbon, (2000). [4] Figueiredo, F. E. O., Kato, C. R. , Nascimento A. S., Marques, A. O. F., Miotto, P., Finer fines in anode formulation, Light Metals, (2005), 665-668.
[5] H. Sato, H. Aoki, T. Miura, J. W. Patrick, Numerical analysis of macrocrack formation behaviour in lump coke, Fuel, 76 (9), (2007), 879-885.
[6] Mirchi, A.A., Savard, G., Tremblay, J. P., Simard, M., Alcan characterisation of pitch performance for pitch binder evaluation and process changes in an aluminium smelter. Light Metals., (2002), 525-533.
[7] Rolf, A.J., Measures to improve carbon baking, Light Metals (1992), 739-745.
[8] Narvekar, R.N., A. Sardesai, and A.B. Prasad. Importance of granulometry in calcined petroleum coke. Light Metals (2003), 525-530.
[9] Seger, E.J., Method and means for measuring electrode resistance. US patent US3735253, (1973).
[10] Seger, E.J., New method of measuring electric resistance for quality control. Light Metals, (1978), 283-290.
[11] Chollier-Brym M.J., Laroche, D., Alexandre, A., Landry, M., Simard, C., Simard, L., Ringuette,D., New method for representative measurement of anode electrical resistance. Light Metals, (2012), 1299-1302.
[12] Léonard, G., Guérard, S., Laroche, D., Arnaud, J.C., Gourmaud, S., Gagnon, M., Marie-Chollier, M.J., Perron., Y., Anode Electrical Resistance Measurements: Learning and Industrial On-line Measurement Equipment Development. Light Metals, (2014), 1269-1274.
[13] Haldemann, P.R., Fawzi, E.P., Methods and Apparatus for Non-destructively Detecting Flaws in a Carbon Anode”, US Patent US5473248, (1995).
[14] Audet, D., Parent, L., Système et procédé de prévision de la conductivité électrique d’anodes de production d’aluminium avant
leur cuisson. US Patent US7576534, International patent IPC, CA 2590482, (2009, 2013).
[15] Amrani, S., Kocaefe, D., Kocaefe, Y., Morais, B., Blaney, G., Effect of Heating Rate on the Crack Formation During Baking in Carbon Anodes Used in Aluminum Industry, Light Metals (2014), DOI: 10.1002/9781118888438.ch196.
[16] Kocaefe, D., Bhattacharyay, D., Kocaefe, Y., Method for analyzing an anode and device thereof, Provisional patent application US 61/939768, (2014).