CHARACTERIZATION OF CRACKING MECHANISMS OF CARBON ANODES USED IN ALUMINUM INDUSTRY BY OPTICAL MICROSCOPY AND TOMOGRAPHY
Salah Amrani1, Duygu Kocaefe1, Yasar Kocaefe1, Dipankar Bhattacharyay1, Mohamed Bouazara1, Brigitte Morais2
1UQAC/AAI Research Chair on Carbon and REGAL Aluminum Research Center, University of Québec at Chicoutimi, 555 Boulevard de l'Université, Chicoutimi, Québec, Canada G7H 2B1
2Aluminerie Alouette Inc., 400, Chemin de la Pointe-Noire, Sept-Îles, Québec, Canada G4R 5M9
Keywords: Carbon anode, cracking mechanisms, optical microscopy, tomography.
Abstract
The objective of this work is to understand the different mechanisms of crack formation in dense anodes used in the aluminum industry. The first approach used is based on the qualitative characterization of the surface cracks and the depth of these cracks. The second approach, which constitutes a quantitative characterization, is carried out by determining the distribution of the crack width along its length as well as the percentage of the surface containing cracks. A qualitative analysis of crack formation was also carried out using 3D tomography. It was observed that mixing and forming conditions have a significant effect on the crack formation in green anodes. The devolatilization of pitch during baking causes the formation and propagation of cracks in baked anodes. The presence of large particles controls the direction of propagation of the cracks.
Introduction
Carbon anode is one of the major components required for the electrolytic production of primary aluminum. Calcined petroleum coke, recycled anode butts, green and baked rejects are mixed with binder coal tar pitch at temperatures 50°C to 60°C above its softening point and the paste is transferred to the mould of a vibro-compactor. The paste is then vibrated for a specific duration to form the green anode. After, the green anode is baked in a furnace to produce the baked anode. During the baking
process, basically the pitch in the anode is transformed yielding to a solid block of carbon (baked anode) which can withstand the extreme conditions inside the smelting pots used for the electrolysis. The last stage of the anode production process is rodding. In the rodding process, copper rods are fixed to the baked anodes using molten cast iron. Afterwards, the rodded anodes aren used in the electrolytic bath to produce primary aluminum.
High density, low electrical resistivity, good mechanical property, and low air and CO2 reactivities are the desired properties of the baked anodes. Presence of cracks is considered as an indicator of poor anode quality or a sign of problems during anode production. Many factors at different stages of production [1] and improper raw material properties [2-4] may lead to the cracking of dense anodes. The thermos-physical and mechanical properties of coke influence the anode expansion and contraction, consequently, the formation of cracks [4]. The green anode preparation [5] and baking process conditions affect the crack formation as well [6-8]. The formation of cracks in green anodes depends on the applied pressure and temperature during vibro-compaction, and cooling rate after molding [5]. During the baking phase, the use of a high heating rate can cause the development of cracks due to fast release of volatiles. A heating rate of 15ºC / h is considered as a limit during the baking process [7]. Operating conditions in the electrolytic cell may also contribute to anode cracking.
To identify the parameters of the anode production process which have an influence on the formation of cracks, an in-depth study is required. The presence of cracks in dense anodes leads to increase in electrical resistivity. This increases the energy consumption during electrolysis and consequently the production cost. The poor anode quality, caused by the formation of cracks, reduces the anode life [9], disturbs the cell stability, and increases the greenhouse gas emissions.
Three major types of cracks can develop in the dense anodes: vertical, horizontal, and corner cracks [10, 12]. Several studies reported in the literature on the effect of different parameters on the crack formation in industrial anodes [13, 14] and the tests which are used to determine the quality of anodes pertaining to cracks and thermal shock behavior [15]. Ambenne and Ries [13] studied the effect of coke type, forming conditions (press and vibro-compactor), pitch level, fine particle content, and baking conditions on the formation of cracks in anodes. In a later work, Ambenne [14] studied the cause of vertical cracks in anodes. The factors responsible for this type of crack were identified as anode stub and yolk expansion forces, mixing characteristics, moisture content in dry aggregate and electrolytic cell
conditions. Fischer and Perruchoud [15] mentioned that size, mechanical strength, coefficient of thermal expansion, Young’s modulus, thermal conductivity, apparent density, and fracture energy control the thermal shock resistance of an anode. They described different types of characterization tests such as measurement of air permeability, thermal conductivity, specific electrical resistivity, flexural strength by three point loading, thermal expansion coefficient, and density in xylene to assess the anode quality.
Some of the crack identification methods that involve the study of structure and morphology of the material provide information at the microscopic scale while others allow the investigations at the macroscopic scale. The application of these techniques together helps analyze the size, shape, origin and mechanism of cracking in dense anodes and gives a complete understanding of the problem. Characterization of a cracking problem can be achieved by the application of certain techniques that have the ability to visualize the size and the structure of cracks [16, 17]. Identification of the origin of the formation of cracks in dense anodes may be achieved by the use of scanning electron microscopy or x-ray tomography [18]. Also, the optical microscopy image analysis technique is considered to be a useful method [19] to characterize the morphology and the structure of surfaces with cracks.
The objective of this study is to understand the origin of the formation of cracks in dense anodes which in turn will help improve the anode quality and consequently will result in longer anode life in the electrolytic cell. Optical microscopy is used to identify the different cracking mechanisms qualitatively and quantitatively. The characterization can also be carried out by means of tomography for larger surfaces.
Methodology
The first part of the study was carried out with samples from a baked anode that was removed from the electrolysis cell. The surface cracks were examined on a sample; Figure 1 shows the shape of the crack studied. The regions at both ends and in the middle of the crack (end 1, middle, and end 2) were studied at the microscopic scale qualitatively. Using another sample, a qualitative microscopic-scale analysis was carried out on the depth of one surface crack by cutting different slices of the sample and (Figure 2) using the image analysis technique. Also, the percentage of the surface that contains cracks and the width of one crack along its length were determined for a third sample. This analysis was carried out
using the optical microscopy images which can cover a surface of 10 mm×10 mm using the mosaic technique.
Then, the 3D tomography was used to analyse at the macroscopic scale a number of internal cross-sections of two samples from two industrial anodes, one sample from a green anode and the other from a baked anode, to study the cracking mechanism.
Sample preparation for optical microscopy
Anode samples of 10×10 mm2 were first placed in a small Teflon mould. Then, the mould was filled with epoxy resin mixed with an amine hardener (15:1). The sample was taken out from the mould after 24 hours, and the sample surface was polished using Struers Tegrapol-35 to have a smooth epoxy-free surface. The protocol proposed by Stuers (see Rorvik et al. [20] for the protocol) was followed for the polishing of the samples.
Equipment
Optical microscopy
The Nikon Eclipse ME 600 optical microscope was used to take the images of the polished sample surfaces. The stage movement and focus were controlled directly by a commercial image-analysis software (Clemex Vision Professional Edition software). Digital images were obtained using a Power HAD Sony (3 CCD) camera, and the ClemexVision software was used to save the images.
3D Computed tomography
The 3D computed tomography was performed using Model-1172. It can analyze the entire volume of the sample from a series of 2D X-ray images.
Study on surface cracking
As it can be seen from Figure 1, for the analysis of the surface crack, three regions were considered: (a) the left end of the crack (End 1), (b) and (c) the middle of the crack (Middle), and (d) the right end of the crack (End 2). The width of the sample surface was 42 mm and its length was 120 mm. After polishing, the sample was analyzed using the optical microscope at a magnification of 50X.
Study on crack depth
Figure 2 shows the sample in three dimensions. In order to study the depth of the crack, the sample was divided into six sections (Y×Z dimensions are 42 mm × 34 mm for each section) parallel to YZ-plane as shown in Figure 2. Then, the mechanism of crack formation was investigated on YZ faces of these sections (see Figure 2).
After cutting the sections, they were polished and analyzed using an optical microscope. A magnification of 50X was used to visualize the surface of each section.
First, a qualitative analysis was carried out in order to identify different crack mechanisms. Then, the quantitative analysis was made by determining the distribution of crack width along its length from the optical microscopy images using the image analysis technique.
Characterization by 3D tomography
The tomography is a technique used to obtain in-depth information in 3D. In 3D tomography, the equipment measures a set of 2D images at two mutually perpendicular directions and combines this information to generate a 3D model. The information on each of the 2D images is saved in separate dicom (Digital Imaging and Communications in Medicine) format. In 3D tomography, the radio-intensity of each point is measured in Hounsfield unit (HU), which is represented with different levels of gray color in dicom files. The darker is the gray color; the lower is the optical density of the point. Since pores or cracks are voids, they contain air which has very low density compared to that of the anode material. Thus, black spots on the images represent pores or cracks. The 3D pictures are viewed using different software and the threshold of the gray levels is adjusted to see the volume elements (often called voxel) with different optical density. It is possible to get the 2D images corresponding to a dicom file using the dicomread function available in Matlab software. The resolution of each voxel depends on the number of pixels and the actual size of the sample. During this study, 2D images were generated at each 0.026 mm interval along the height of the sample analyzed. The study is designed to understand the mechanism of crack formation in two different samples, one from a green anode and the other from a baked anode.
Results and discussion Qualitative study
From the images obtained by optical microscopy, surface cracks and their depths were clearly visualized. By analyzing the images, it is possible to determine the mechanism of crack formation, which is explained in the following sections.
Surface crack
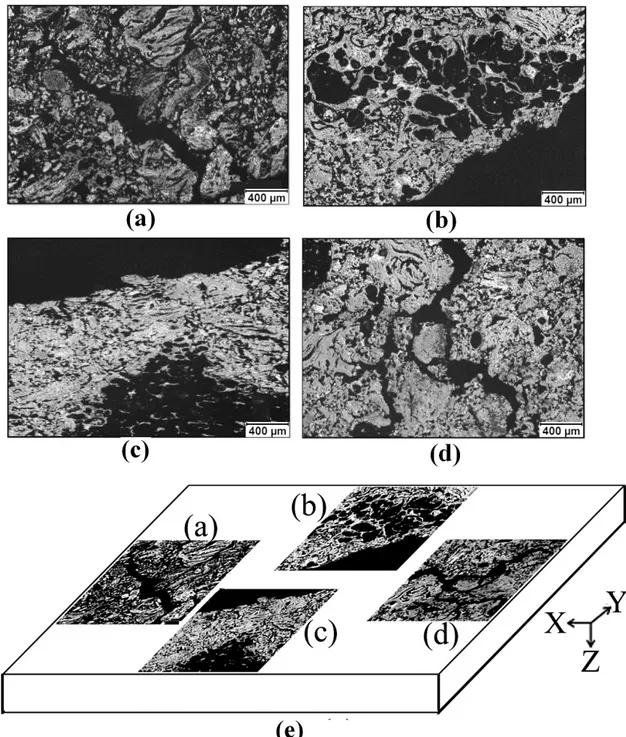
Figure 3 displays the images of different regions of the surface crack taken by the optical microscope (of the sample shown in Figure 1). Figures (a) to (d) show the cracks, and (e) shows their position on the sample surface (see also Figure 1). As it can be seen in Figure 3(a), the left hand side of the crack (End 1) is narrow which represents one end of the crack. At this point, the crack could not propagate further since the factors causing the crack were no longer effective. Similarly, Figure 3(d) represents the other end of the crack (End 2); and it can be clearly seen that the crack is divided into a number of channels at this end following the boundary of a particle. The image analysis technique was used to visualize the coke particles and the cracks present on images of Figure 3 (a) and (d) at both the ends of the crack; and the results are displayed in Figure 4. Figures 4 (a) and (b) show the coke particles and the cracks present for End 1, respectively; and Figures 4 (c) and (d) show the coke particles and the cracks at End 2, respectively.
Both ends show that when a coke particle is present on the path of a crack, the crack splits into different channels depending on the size and position of that coke particle as well as the distribution of neighboring coke particles. The size of the channels depends on the resistances offered by the particles on its path. The packing density of the coke particles mixed with pitch, which is a function of granulometry as well as mixing and forming conditions, has a significant effect on the propagation of cracks. The analysis shows that mixing and forming conditions control the formation and propagation of cracks.
The middle zone of the crack contains a number of pores as shown in Figures 3(b) and (c) (the crack is seen on the bottom right in Figure 3 (b) and on the top left in Figure 3 (c)). The optical microscopy images show that this zone was filled with a relatively high amount of pitch. The concentration of pitch at a particular region can take place because of inefficient mixing. Inefficient mixing can result in a non-uniform distribution of pitch in the anode matrix. The cracks formed during baking due to the large quantity of volatiles released from these over-pitched regions. It is a known fact that the devolatilization of pitch causes stress in anodes during baking and creates cracks. The results show that this occurred in
the middle region of the crack. No such over-pitched regions were observed close to the ends indicating that the crack propagated from the middle zone towards the two ends. Therefore, the following mechanism can be proposed: the crack formation starts in the middle zone due to the devolatilization of pitch taking place during anode baking and then propagates to the both sidesin . The cracks become very narrow close to the ends and they either finally taper off (End 1) or split into narrower channels (End 2) depending on the distribution and the granulometry of coke particles.
Crack depth
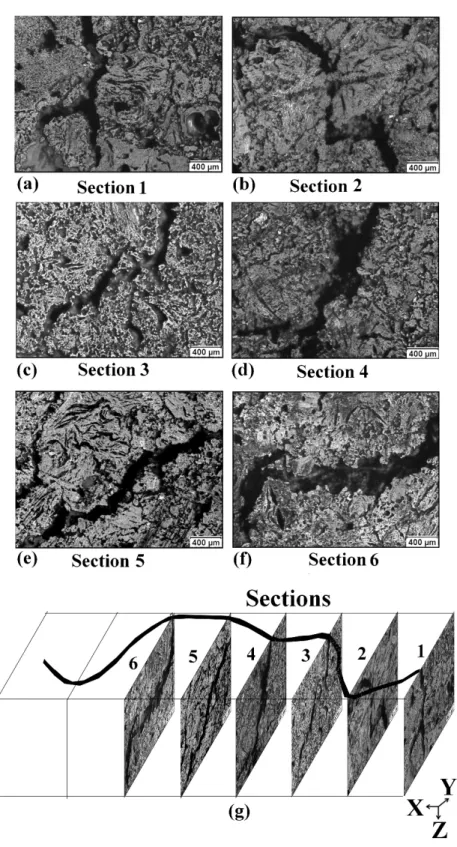
Figure 5 presents different defects observed on the YZ surfaces of the six sections shown in Figure 2 as well as their positions in the sample. In this figure, the black regions represent pores and cracks.
The images show the depth of the crack in the six vertical sections (YZ faces) shown in Figure 2. It can be seen that the direction (orientation) of the crack stays generally the same while the shape can change along the Z-axis. Figure 5(a) displays a Y-shaped crack due to the presence of a large particle on the crack path. The coke particles are harder and denser than the carbonized pitch and thus create more resistance to crack propagation along the initial direction; this causes a change in the direction of crack path. Figure 5(b) displays a crack in a zigzag shape of 1-cm depth. In this figure, it can be clearly seen that there are two large coke particles, and the crack is simply propagating through the space between the boundaries of the two particles. Figure 5(c) presents a crack which is divided into multiple smaller channels on one side (right). This can also be explained based on the distribution of coke particles. On the left hand side of the image, there is a large particle whereas on the right hand side, there are a number of smaller particles. Since the smaller particles usually offer less resistance to the propagation of cracks, the crack mainly propagates towards the right side. The cracks shown in Figures 5(d), 5(e), and 5(f) also displayed similar characteristics. Thus, it can be said that the granulometry and the distribution of coke particles control the shape and the path of the crack propagation. The cracks can also form between the coke particles. These types of cracks can be caused by numerous factors such as coke particle size, pitch quantity, mixing, forming [20], and baking conditions. Some cracks within the coke particles are closed with no connection to others (Figure 5(e)). Such cracks can form in coke particles due to thermal or mechanical stresses. These stresses can form due to a number of reasons such as coke calcination, crushing the coke particles with the objective of obtaining the desired granulometry, mixing of anode paste, and vibro-compaction.
Quantitative study
Quantitative characterization of a crack in a third sample from the same anode that was retrieved from the cell has been carried out based on the interpretation of an image taken using the optical microscopy with a magnification of 100X. The picture was processed with a custom-made software. Figure 6 shows the processed picture where the white regions represent the cracks.
The white regions shown between two continuous lines represent relatively long cracks, and those surrounded by circles are shorter, discontinuous local cracks.
Determination of the percentage of cracking on a given surface of the sample
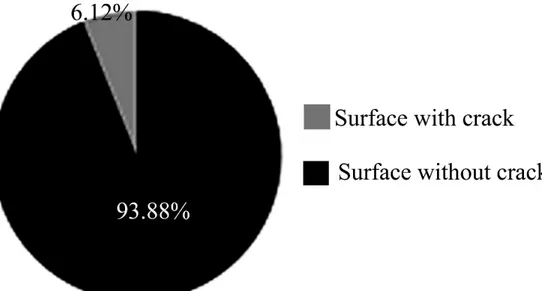
The quantification of cracks (area of white regions) was carried out using an image analysis software developed at UQAC. The details of the software can be found elsewhere [21]. With this software, it is possible to separate the different constituents (coke, pitch, pore, long cracks, short discontinuous cracks, etc.) present in an anode sample and to quantify each as a percentage of the surface. Figure 7 shows the percentages of the area with and without cracks on the baked anode sample surface.
It can be seen that the percentage of the area with cracks is low (6.12%) compared to the percentage of the area without cracks (93.88%). Because the history of the crack formation is not known, it is difficult to identify the specific causes behind the formation of these cracks. They might have been formed due to several factors at different stages of the anode production (mixing, forming or baking conditions) and raw materials used [14].
Determination of the distribution of the crack width
The Figure 8 shows the technique used to determine the width of a particular set of cracks along their length in the anode sample studied.
This technique consists of drawing a line in the direction of the crack followed by drawing perpendicular segments on such lines (see Figure 8). This allows the determination of crack width at each point along the crack length. In order to better visualize the variation of the crack width along its length, the crack width was plotted with respect to the crack length. Figure 9 shows this distribution (the numbers identify the regions of the cracks analyzed in Figure 8).
The results show that the width of the crack varied between15 and 143 microns for the anode sample studied. This value might change depending on the conditions of different anode production steps as well as the cell operational parameters. The distribution of the crack width along its length can give a general idea about the mechanism of crack orientation, as can be seen in Figure 8. Decrease in crack width indicated a change in the crack orientation. This change occurred due to an obstacle such as a large particle that prevents its propagation along the same path. Presence of large particles in one side and small particles in the other side is a sign of a non-homogeneous matrix. Thus, it can be concluded that the presence of large particles in a non-homogeneous matrix control the direction of propagation of cracks.
Characterization by 3D tomography
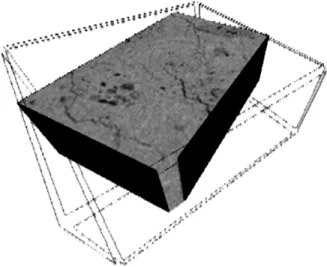
It is difficult to analyze the inside of the anode sample without the application of threshold using 3D tomography (Figure 10). As the objective of this study was to detect the presence of cracks in different levels, 2D images at 3 different positions along the height of the sample were used for the analysis of different defects that exist in the sample and their mechanism. Two industrial anode samples, one from a green anode and one from a baked anode, were studied.
Analysis of the green anode sample
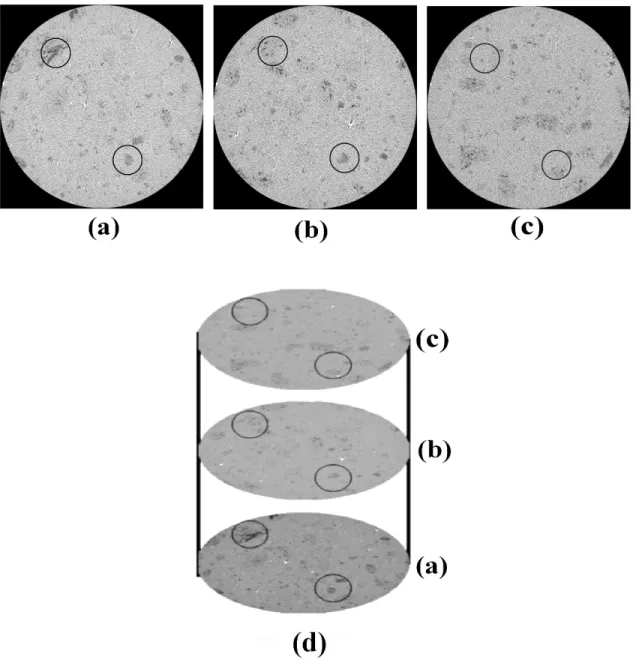
The images of the green anode sample (50 mm in diameter and 12.66 mm in height) that were obtained using the tomography technique at three levels along the height are illustrated in Figure 11.
As discussed earlier, the black spots marked by circles in Figure 11(a) indicate pores, which disappear gradually from the bottom towards the top of the sample. It shows that the pores were developed locally. This pore distribution is the result of the raw material mixing conditions (temperature and mixing speed) used. The pore of the coke particles can be created during the calcination [2] or mixing. If the energy of mixing used is very high, it can cause the formation of pores or small cracks in the particles. Crack formation depends also on the mixer technology. Whatever be the reason, the pores/cracks in the particles are not filled by pitch in the green anode during the mixing process. This is what can be termed as poor mixing (non-homogeneous paste) and can be attributed to the formation of crack in green anode. Cracks can develop during forming due to non-homogeneous paste filling, uneven vibrations in the compactor, etc.
Analysis of the baked anode sample
The analysis of cracks for a parallelepiped-shaped sample (size: 20mm×12.5mm×15.8mm; width × length × height) by 3D tomography provides information on cross-sections at each interval of 0.026 mm along the height. Three cross-sections are shown in Figure 12.
Figure 12(c) shows the state of the top of the sample where porous zones are marked with circles. These regions appear to have been occupied by pitch before baking, which would consequently lead to the formation (through devolatilization) of cracks during baking in adjacent layers (Figures 12(a) and 12(b)) where the cracks are indicated by arrows.
The formation of this type of crack in dense anodes is typically caused by the build-up of pressure inside the anode. The devolatilized pitch increases the pressure inside the anode during baking in the temperature range of 200°C to 600°C during which the volatiles of pitch is in gaseous state [10].
Summary of the proposed mechanisms of crack formation
Table 1 shows the different mechanisms identified for the formation of cracks in green and baked anodes during this study and compares these findingswith different works published in literature.
Conclusions
Qualitative characterization of cracking of an anode sample retrieved from the cell made the identification of the mechanism of crack formation on its surface possible. The analysis shows that the crack starts in the middle, grows towards the ends where the crack becomes narrow and then disappears, changes direction or splits into smaller ones. The devolatilization of pitch, concentrated at a particular position in the green anode, causes the initiation of crack. The distribution of particles controls the propagation of cracks.
The analysis of a crack along its depth indicates the mechanism of the crack formation within a sample. It was seen that the crack maintains its shape unless it encounters large particles and splits. Depending on the number of particles that the crack encounters during its propagation, a number of narrower cracks
might form. They can be long and continuous or local and discontinuous. hence, the presence of large particles cause change in direction of crack propagation.
The origin of cracks in baked anodes lies in the history of green anodes such as calcination conditions and granulometry of coke, mixing (distribution of particles and pitch), and forming conditions. Cracks can already exist in the green anode and new cracks can form due to the devolatilization of pitch during baking. It is important to control the paste mixing, compaction and baking conditions of anodes to reduce cracks and improve the quality of anodes.
Acknowledgements
The technical and financial contributions of Aluminerie Alouette Inc. and the financial support from the Natural Sciences and Engineering Research Council of Canada (NSERC), the Economic Development Sept-Iles, the University of Quebec at Chicoutimi (UQAC), and the Foundation of the University of Quebec at Chicoutimi (FUQAC) are greatly appreciated.
Bibliographies
1. M. Tkac, Porosity development in composite carbon materials during heat treatment, PhD Thesis, Norwegian university of science and technology, 2007, p 19-23
2. D. R. Jenkins, M.R. Mahoney, Fissure formation in coke. 2: Effect of heating rate, shrinkage and coke strength, Fuel, 2010, 89(7), p 1663–1674
3. F. E. O. Figueiredo, C. R. Kato, A. S. Nascimento, A. O. F. Marques, P. Miotto: Finer fines in anode formulation, Light Metals, 2005, p 665-668
4. H. Sato, H. Aoki, T. Miura, J. W. Patrick, Numerical analysis of macrocrack formation behavior in lump coke, Fuel, 2007, 76 (9), p 879-885
5. S. S. Zhuchkov, S.A. Khramenko, Effect of pitch quality on properties of baked anodes. The second international congress, Non-ferrous metals, September 2–4, 2010, (Krasnoyarsk, Russia), Part VI, Aluminum reduction technology, 2010, p 333-335
6. M. Lustenberger, Heat treatment of carbon anodes for the aluminium industry, PhD thesis, Thèse École polytechnique fédérale de Lausanne, 2004, p 32-38
7. F. Keller, P. O. Sulger, M. W. Meier, D. S. Severo, V. Gusberti, Specific energy consumption in anode bake furnaces, Light Metals, 2010, p 1005-1010
8. A. N. Chernyavets,N. Yu. Beilina,N. A. Lobastov,B. G. Ostronov, I. A. Bubnenkov, Improvement in the quality of self-firing anodes of aluminum electrolyzers and other carbon articles, Refractories and Industrial Ceramic, 2007, 48 (4), p 37-40
9. O. E. Frosta, T. Foosnæs, H. A. Øye, H. Linga, Modelling of anode thermal cracking behaviour, Light Metals, 2008, p 923-927
10. M. W. Meier, Cracking, Cracking behavior of anode, Sierre, Switzerland, R&d Carbon Ltd, 1996, p 251-268
11. M.W. Meier, W.K. Fischer, R.C. Perruchoud, Thermal Shock of Anodes – a Solved Problem? Light Metals, 1994, p 685-694
12. F. Keller, U. Mannweiler, R. C. Perruchoud, Anode performance, the link between coke properties and aluminum production cost, internal publication, 1994, Anode for the aluminum industry, R & D carbon ltd, 4th edition, 2007, p 381-387
13. N. A. Ambenne, K. E. Ries, Operating parameters affecting thermal shock cracking of anodes in the Valco smelter, Light metals, 1991, p 699-704
14. N. A. Ambenne, Vertical anode cracking - the Valco experience, Light Metals, 1997, p 577-583
15. W. K. Fischer, R. C. Perruchoud: Determining prebaked anode properties for aluminum production, Journal of metals, 1987, 39 (11), p 43-45
16. D. Benneti, A. Gibson, j. W. Patrlck, A. Walker, Fractographic studies of anode carbons, Carbon, (1988), 26 (5), p 653-657
17. Y. Yao, D. Liu, Y. Che, D. Tang, S. Tang, W. Huang, Non-destructive characterization of coal samples from China using microfocus X-ray computed tomography, International journal of coal geology 80, 2009, p 113-123
18. A. N. Adams, O. Karacan, A.Grader, J. P. Mathews, P. M. Halleck, H. H. Schobert, The non-destructive 3-d characterization of pre-baked carbon anodes using x-ray computerized tomography, Light Metals, 2002, p 535-539
19. B. A. Sadler, Diagnosing anode quality problems using optical macroscopy, Light Metals, 2012, p 1289-1292
20. S. Rorvik, A.P.Ratvik, T.Foosnaes, Characterization of green anode materials by image analysis, Light Metals. 2006, p 553-558
21. Y. Xie, D. Kocaefe, Y. Kocaefe, L. Wei, S. Zou, A. Wu, Correlation between Anode Recipe and Anode Properties, International Journal of Engineering and Innovative Technology (IJEIT) , 2013, 2 (8), p 23-27
22. D. Bhattacharyay, D. Kocaefe, Y. Kocaefe, B.Morais, Determination of coke, pitch and pores/cracks in green anode by image analysis: journal of surface engineered materials and advanced technology, 2013, 3 (3A), p 1-6
Figure1: Sampling plan to study the surface cracking
Figure 2: Sampling plan to study the depth of a crack
Figure 3: Images that represent the three regions of the surface crack shown in Figure 1: (a) End 1, (b and c) Middle, (d) End 2, and (e) positions of the surface cracks (a) to (d) on the sample surface
Figure 4: Distribution of coke and cracks at the two ends: (a) coke particles (white) at End 1, (b) cracks (gray) at End 1, (c) coke particles (white) at End 2, and (d) cracks (gray) at End 2
Figure 5: Images that represent the different defects along the crack depth on the surfaces of the six sections shown in Figure 2 (a-f: sections 1 to 6, respectively; (g) their positions in the sample)
Figure 6: Cracks formed in the anode sample studied
Figure 8: Determination of the crack width along its length in the anode sample studied
Figure 11: Computed tomography images for the green anode sample (50 mm in diameter, 12.66 mm in height) (a) at the bottom (1.4 mm from the bottom surface), (b) in the middle (4.4 mm from the bottom surface), (c) at the top (7.8 mm from the bottom surface), and (d) positions of the cross-sections shown in images of (a) to (d)
Figure12: Crack distribution in the parallelepiped-shaped baked anode sample (20mm×12.5mm×15.8mm) in 2D tomography: (a) at the bottom (0 mm from the bottom surface), (b) in the middle (7.8 mm from the bottom surface), (c) at the top (15.8 mm from the bottom surface), and (d) positions of the cross-sections shown in (a) to (c)
Table 1: Comparison of proposed mechanisms of cracking with published works No. Mechanism of crack formation and propagation as
analyzed in this work
Analysis done by other researchers
1
The mixing and forming conditions control the formation and propagation of cracks.
Ambenne [14] reported that the mixing and forming conditions can control the generation of cracks.
2
Cracks form during baking due to the large quantity of volatiles released from the over-pitched regions.
Xie et al. [21] observed that the presence of a thick layer of pitch around particles causes cracks during baking. 3 The crack formation starts in the middle zone due to the
devolatilization of pitch during anode baking and then propagates towards both ends.
4 The cracks become very narrow close to the ends and either finally taper off or split into narrower channels depending on the distribution and the granulometry of coke particles.
5
The granulometry and the distribution of coke particles control the shape and the path of the crack propagation.
Xie et al. [21] have reported that the granulometry of coke has a significant influence on crack formation.
6 Closed cracks in coke particles can form due to thermal or mechanical stresses that can occur during coke calcination, crushing of particles to produce the desired granulometry, mixing of anode paste, and vibro-compaction.
7 The presence of large particles in a non-homogeneous matrix controls the direction of propagation of cracks.
8 Cracks can develop during mixing or compaction in green anodes due to non-homogeneous paste filling.
9 Devolatilization of pitch during baking can create cracks in adjacent layers in the baked anode.