HAL Id: hal-03139930
https://hal.uca.fr/hal-03139930
Submitted on 12 Feb 2021
HAL is a multi-disciplinary open access
archive for the deposit and dissemination of
sci-entific research documents, whether they are
pub-lished or not. The documents may come from
teaching and research institutions in France or
abroad, or from public or private research centers.
L’archive ouverte pluridisciplinaire HAL, est
destinée au dépôt et à la diffusion de documents
scientifiques de niveau recherche, publiés ou non,
émanant des établissements d’enseignement et de
recherche français ou étrangers, des laboratoires
publics ou privés.
Distributed under a Creative Commons Attribution| 4.0 International License
conductivity of carbon‑bearing aqueous fluids
Geeth Manthilake, Mainak Mookherjee, N. Miyajima
To cite this version:
Geeth Manthilake, Mainak Mookherjee, N. Miyajima. Insights on the deep carbon cycle from the
electrical conductivity of carbon‑bearing aqueous fluids. Scientific Reports, Nature Publishing Group,
2021, 11, pp.2745. �10.1038/s41598-021-82174-8�. �hal-03139930�
1 Scientific Reports | (2021) 11:3745 | https://doi.org/10.1038/s41598-021-82174-8
www.nature.com/scientificreports
Insights on the deep carbon cycle
from the electrical conductivity
of carbon‑bearing aqueous fluids
Geeth Manthilake
1*, Mainak Mookherjee
2& Nobuyoshi Miyajima
3The dehydration and decarbonation in the subducting slab are intricately related and the knowledge of the physical properties of the resulting C–H–O fluid is crucial to interpret the petrological, geochemical, and geophysical processes associated with subduction zones. In this study, we investigate the C–H–O fluid released during the progressive devolatilization of carbonate‑bearing serpentine‑polymorph chrysotile, with in situ electrical conductivity measurements at high pressures and temperatures. The C–H–O fluid produced by carbonated chrysotile exhibits high electrical conductivity compared to carbon‑free aqueous fluids and can be an excellent indicator of the migration of carbon in subduction zones. The crystallization of diamond and graphite indicates that the oxidized C–H–O fluids are responsible for the recycling of carbon in the wedge mantle. The carbonate and chrysotile bearing assemblages stabilize dolomite during the devolatilization process. This unique dolomite forming mechanism in chrysotile in subduction slabs may facilitate the transport of carbon into the deep mantle.
Subduction is one of the key processes that regulate the transport of water and carbon into the Earth’s mantle1–3.
It is estimated that the extreme slab dehydration may release 97% of the water bound in hydrous minerals into the overlying mantle4, while 80% of the carbonates in subducting slabs may decarbonate and be recycled through arc
volcanism5,6. The flux of volatiles released by the slab brings about dramatic changes to the physical and chemical
state of the overlying mantle, including the melting temperatures7, redox state8,9, and mechanical strength of
man-tle minerals10,11. The upward migration of volatiles associated with dehydration and decarbonation is therefore
key to understand the petrological, geochemical, and geophysical processes associated with subduction zones12.
The investigations of slab-devolatilization reveal close affinity between the transfer of slab bound carbon to the mantle wedge and the dehydrating aqueous fluids13–16. The dissolution of carbon in slab-derived aqueous
fluids displays a complex dependence of pressure, temperature, and redox conditions8,17. It has been shown that
carbonate solubility in water increase with pressure, implying that at deep mantle conditions, carbonates may readily dissolve in aqueous fluids17. The carbon dissolved in aqueous fluids in equilibrium with mantle peridotites
mainly occurs as molecular CO214, however, depending on the prevailing conditions, carbon can be dissolved in
aqueous fluids as methane (CH4)13,16,18. A recent experimental study demonstrated an immiscibility of C–H–O
fluids above 1.5 GPa and ~ 900 K, which may result in immiscible C–H–O fluids in the mantle wedge13,18,19.
In addition to the petrological and geochemical studies which provide constraints on the chemical interac-tions of fluids with the surrounding mantle, geophysical methods such as magnetotelluric and seismic tomog-raphy also provide complementary constraints on the volume fraction of the fluid, and mobility of the fluid in the mantle wedge20–24.
The laboratory-based constraints on the electrical conductivity of fluids have provided valuable insight into the fluid-driven processes in the subduction zone and overlying mantle wedge23, 24. The experimental constraints on
the electrical conductivity of aqueous fluid include pure water25,26, aqueous fluids released by dehydration23,24,27,28
and saline aqueous fluids with varying salinities29–34. However, the effect of both carbon and hydrogen bearing
(C–H–O) aqueous fluids on electrical conductivity remain unknown.
Hence, to bridge this crucial gap, in this study, we constrain the electrical conductivity of C–H–O fluids. To measure the electrical conductivity of C–H–O fluids we chose a naturally occurring carbonate-bearing ser-pentinite which consists of chrysotile (Fig. 1). Chrysotile is a polymorph of serpentine. Owing to its impor-tance in subduction zone settings, extensive studies on the equation of state35, elasticity36–39, and electrical
OPEN
1Laboratoire Magmas et Volcans CNRS, IRD, OPGC, Université Clermont Auvergne, 63000 Clermont-Ferrand,
France. 2Earth Materials Laboratory, Department of Earth, Ocean and Atmospheric Sciences, Florida State
University, Tallahassee, FL 32306, USA. 3Bayerisches Geoinstitut, University of Bayreuth, 95447 Bayreuth,
conductivity28,40,41 have been conducted on serpentine polymorphs including lizardite and antigorite. Relative
thermodynamic stability of chrysotile is lizardite suggest that chrysotile less stable compared to lizardite, how-ever, in nature, chrysotile and lizardite do occur at similar pressure and temperature conditions, often at very low-grade metamorphic conditions relevant for oceanic serpentinization42. The chrysotile found in nature is
metastable and it is often favored in tectonically active regions42. Although chrysotile is metastable, since the
focus of this study was to understand the electrical conductivity of IC–H–O fluids, we chose a carbonate-bearing chrysotile sample for the temperature-dependent electrical conductivity measurements. The temperature was incrementally increased beyond the thermodynamic stability field of the hydrous and carbonate phases leading to the release of aqueous fluids that would mimic C–H–O fluids occurring in the subducting slab13. To evaluate
the effect of carbon on the electrical conductivity of the aqueous fluid, we conduct a separate experiment where we measure another serpentine (antigorite) without any detectable presence of carbonate phases. The aqueous fluids released upon dehydration of antigorite serves as a control experiment without the effect of carbon.
Results
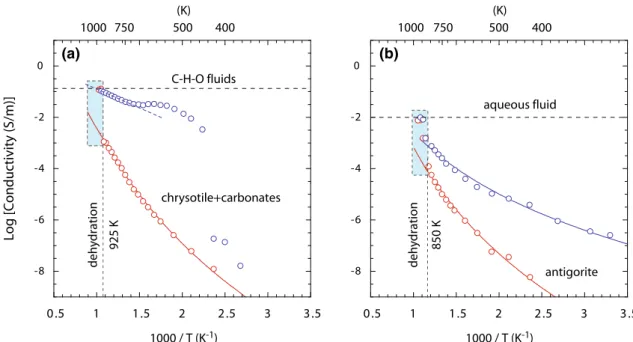
Upon heating serpentine samples from 300 K to the dehydration temperatures ~ 850–925 K, the electrical con-ductivity increases from 10–8 to 10–4–10–3 S/m respectively (Fig. 2). The dehydration of both serpentinite samples
i.e., with and without carbonate phase, resulted in a discontinuous increase of conductivity. The aqueous fluid resealed from both the serpentinite samples exhibits more than two orders of magnitude higher electrical con-ductivity compared to the electrical concon-ductivity prior to the dehydration. A sharp increase in electrical conduc-tivity occurs at 850 K for antigorite polymorph that also contains magnetite. Such a sharp increase in electrical conductivity occurs at ~ 925 K for chrysotile polymorph containing calcite. The temperature dependence of the electrical conductivity is well described by an Arrhenius relation; σ = σ0exp(−�H/RT) . And the logarithmic
dependence of electrical conductivity ln(σ ) versus the reciprocal temperature ( 1/T ) yields the activation enthalpy ( H ) of the dominant conduction mechanisms. The conductivity ( σ ) is expressed in S/m, temperature ( T ) is in absolute temperature, σ0 is the pre-exponential factor in S/m, and R is the gas constant in J K−1 mol−1. We
obtain the activation enthalpy and the pre-exponential factor following the combined electrical conductivity σtotal=σm1+σm243,44. The notations mi, i = 1, 2 , indicates distinct conduction mechanisms operating at different
temperature intervals45 (Table 1). At low temperatures, < 600 K, the electrical conduction is likely to be dominated
by proton conduction. One possibility could be the presence of protons in the grain boundaries that were not fully removed when the sample was kept overnight for removing the absorbed moisture. Similar observations have been made in the electrical conductivity of deformed hydrous silicates including talc and serpentinites45. At
the intermediate temperature range i.e., between 600 and 900 K, the electrical conduction shows slightly higher activation enthalpy. This suggests a possible contribution from polarons as the charge carrier45. In contrast, after
dehydration the electrical conductivity shows weak temperature dependence, indicating the involvement of the free fluid for the conduction23,24.
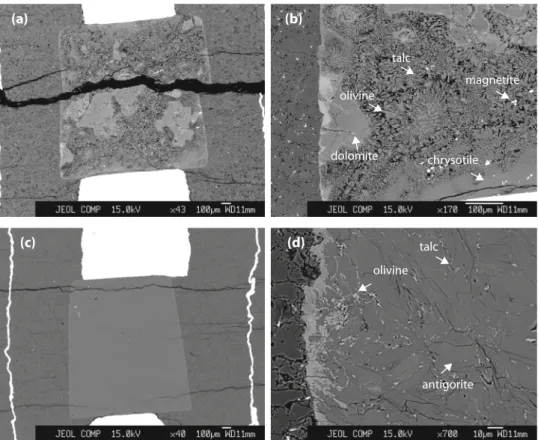
The chemical analysis and BSE images of samples after electrical conductivity measurements indicate that the serpentine mineral decomposes to a mixture of olivine and talc, and the released aqueous fluid is evident from the voids (Fig. 3). The decomposition of the chrysotile sample and exhibits extensive dolomite crystallization possibly triggered by the exchange of Ca2+ and Mg2+ between calcite and serpentine (Fig. 3). In addition, the
chrysotile sample displays precipitation of carbonaceous matter along the boundaries of olivine and talc grains (Fig. 4). At similar pressure and temperature conditions, the antigorite sample did not show dolomite crystal-lization, since it did not have any carbonate phase prior to dehydration.
(a)
(b)
Figure 1. The characterization of the chrysotile sample. (a) Bright-field TEM image of fibrous chrysotile. The
inset is a selected area electron diffraction (SAED) pattern from the fibrous crystals. (b) The high-resolution TEM image of the fibrous chrysotile showing lattice fringes of about 0.7 nm. The inset is the corresponding SAED pattern of a mixture of the [010] and [001] zone axes due to the cylindrical structure.
3 Scientific Reports | (2021) 11:3745 | https://doi.org/10.1038/s41598-021-82174-8
www.nature.com/scientificreports/
Discussion
Chemical characterizations of the fluid phase.
The in-situ electrical conductivity measurements can-not distinguish individual contributions from the chemical species of C–H–O fluid as it represents the bulk conductivity of the interconnected fluid phase. Here we probe the nature of the fluid produced by the devolatili-zation of carbonate baring chrysotile by both Energy dispersive X-ray diffraction (EDX) chemical mapping and micro Raman spectral analyses of experimental run product.The micro-Raman analyses of the chrysotile sample after dehydration reveal characteristic vibrational modes corresponding to graphite46,47, diamond15,48, and methane (CH
4)49–51 (Fig. 5). The precipitation of carbonaceous
matter along the grain boundaries of olivine and talc, formed as a result of the dehydration of chrysotile, sug-gests that the resulting fluid phase was likely rich in CO2. The precipitation of carbonaceous materials such as
graphite and diamond suggests following the reaction: CO2 = C + O2, and CO2 + 2H2O = CH4 + 2O2. The liberation
of O2 indicates the oxidizing nature of the released fluid. Although the starting composition of the chrysotile
and carbonates were devoid of magnetite (Fe2O3), the oxidizing nature of the released aqueous fluids leads to
the formation of Fe2O3 in the chrysotile sample after the dehydration (Fig. 4). The formation of Fe2O3 occurs
concomitantly with the precipitation of C or CH4 by the decomposition of CO2 by the above-mentioned reactions.
The formation of Fe3+ bearing Fe
2O3 and the Raman modes on the carbonaceous precipitates are clearly indicative
of the oxidizing nature of the released fluids. The oxidizing properties of the slab-derived fluids conforms with the highly oxidized nature observed in arc magmas compared to mid-ocean ridge basalts52,53.
The presence of diamonds in the experimental product was confirmed by Raman analyses. Prior to the Raman analyses, the spectral position was calibrated using synthetic low-fluorescence diamond oriented in the 100 direc-tion (Boehler-Almax). The presence of a diamond peak at 1328 (± 0.02) cm−1 agrees well with the vibrational -8 -6 -4 -2 0 0.5 1 1.5 2 2.5 3 3.5 Log [Conductivity (S/m)] 1000 / T (K-1) -8 -6 -4 -2 0 0.5 1 1.5 2 2.5 3 3.5 1000 / T (K-1)
(a)
chrysotile+carbonates C-H-O fluids de hy dration(b)
de hy dration antigorite aqueous fluid 925 K 850 K 1000 750 500 1000 750 500 (K) 400 400 (K)Figure 2. The electrical conductivity of serpentine as a function of reciprocal temperature for (a) chrysotile
and (b) antigorite. The red open circles represent the electrical conductivity of the serpentine samples collected during the heating path (i.e. with increasing temperature). The blue open circles indicate electrical conductivity obtained in the cooling path. The dashed vertical lines indicate the observed devolatilization temperatures determined based on the discontinuous enhancements in the electrical conductivity. The blue shaded area indicates the conductivity increase associated with the devolatilization. The horizontal lines indicate the maximum electrical conductivity observed for released aqueous fluids upon dehydration of the two samples.
Table 1. Fitting parameters for electrical conductivity of serpentine and dehydrating fluids.
Sample Temperature (K) Log σ0 (S/m) ΔH (eV)
Chrysotile < 600 − 1.7 0.75 600–925 1.74 0.82 Chrysotile + C–H–O Fluid 975–720 0.57 0.21 Antigorite < 623 − 2.7 0.73 623–850 3.76 0.83 Antigorite + Aq-fluid 825–673 2.4 0.8
modes ~ 1332–1328 observed for diamonds crystallized from C–H–O fluids48. The precipitation of diamond at
temperatures < 1200 K, suggests either CH4 = C + 2H2 or CH4 + O2 = C + 2H2O51 or saturation of carbon in the
fluid phase48. Our study provides direct experimental evidence relating to the origin of subduction-related micro
diamonds found in ultrahigh-pressure metamorphic terrains49,54.
Wetting properties of the fluid phase.
In a multiphase system, the electrical conductivity is governed by the highest conductive phase that can develop an interconnected network within the matrix. In the case of aqueous fluids, the development of the interconnected network at low volume fractions depends on their wetting(a) (b) (c) (d) dolomite olivine talc magnetite chrysotile olivine talc antigorite
Figure 3. Back Scattered Electron (BSE) images showing the cross-section of the (a,b) chrysotile and (c,d)
antigorite samples after electrical conductivity measurements, cut along the axial direction of the assembly.
dolomite
talc
olivine Carbonaceous materials
Figure 4. Back Scattered Electron (BSE) image at higher magnification, shows the dehydrated
carbonate-bearing chrysotile sample. The BSE image is overlain with the energy-dispersive X-ray (EDX) spectroscopy which shows the mapping of Mg (light gray), Ca (dark gray), and C (blue). The concentrations of blue regions indicate precipitation of carbonaceous materials within the olivine and talc grain boundaries.
5 Scientific Reports | (2021) 11:3745 | https://doi.org/10.1038/s41598-021-82174-8
www.nature.com/scientificreports/
properties which are manifested as the dihedral angle of the fluids in the interstitial pockets formed within the framework of grains. If the dihedral angle, θ < 60°, the fluid is likely to form an interconnected network and per-colate through the mineral grain boundaries even at small volume fractions. In contrast, if the θ > 60°, the fluid is likely to be trapped in the interstitial pockets and percolation is only possible for high fluid fractions. At pres-sures < 4 GP and temperatures < 1073 K, prior experimental investigations of aqueous fluids have shown limited wetting properties i.e., θ > 60°55–58, which is likely to restrict the connectivity of aqueous fluids. In comparison
to aqueous fluids, CO2-rich fluids exhibit larger dihedral angles with 80 < θ < 120°59,60, thus severely restricting
their movement along grain boundaries. The presence of C–H–O fluid, therefore, should not necessarily result in a high electrical conductivity, unless the fluid fraction is large to overcome the limited wetting property and establish a network of interconnected fluid. The dihedral angle of fluid-filled grain boundaries was measured after the dehydration of chrysotile and antigorite and it exhibits distinct variations, which may affect their abil-ity to percolate into a polycrystalline matrix. The observed θ for the olivine-fluid-olivine interfaces produced by carbonate-bearing chrysotile vary between 45° and 60°, in contrast, observed θ produced by the dehydrated antigorite is 0–10°. The contrast in wetting properties observed in these two experiments are likely related to the distinct nature of the C–H–O fluids and carbon-free aqueous fluids61. This is the likely cause of the notable
differences observed in the temperature dependence of the electrical conductivity (Fig. 2). In the antigorite sample, the conductivity increase due to dehydration occurs at 850 K, which can be explained by the develop-ment of interconnected fluid network at low fluid fractions due to their excellent wetting properties. With the gradual increase of temperature, electrical conductivity increases in response to the increase of fluid volume fraction in the antigorite sample. In contrast, in the chrysotile sample, the discontinuous increase of conductivity occurs at 925 K. The conductivity enhancement at higher temperatures is likely due to the non-wetting of grain boundaries at a low fluid fraction. Once the fluid fraction is large enough in the chrysotile sample, the network of interconnected fluids is established, resulting in a sharp increase of conductivity of more than two orders of magnitude. The conductivity behavior in the cooling path often indicates the nature of the dominant conduc-tive phase. The relaconduc-tively high electrical conductivity of the and weaker temperature dependence observed in carbonate-bearing chrysotile sample is likely caused by the precipitation of the conductive graphite phase along the grain boundaries. Similar behavior of relatively high electrical conductivity and weak temperature depend-ence in aqueous fluids have been previously observed in dehydration of chlorite where conductive magnetite phases were precipitated along grain boundaries24.
Highly conductive C–H–O fluid tracks deep carbon.
The temperature dependence of the electri-cal conductivity of serpentine agrees well with prior studies on natural serpentinite rock45, the polymorph ofserpentine-antigorite41,62, and lizardite28. The fluids released during the dehydration of serpentine exhibit ~ 2
orders of magnitude higher conductivity than their host minerals phases. The high conductivity of aqueous flu-ids compared to dehydrated mineral residue has been observed in other studies23,24. The high conductivity can be
(a)
(b)
Figure 5. Raman spectra of carbonaceous materials after the devolatilization of the carbonate-bearing
chrysotile sample. (a) Deconvolution of Raman spectra shows graphite and C–H stretching modes likely indicating CH4. The vibrational modes are characterized by first-order bands of ordered graphite at 1588 cm−1
(G) and disordered graphite bands at 1217 cm−1 (D4) , 1332 cm−1 (D1), 1502 cm−1 (D3) and 1607 cm−1 (D2)46.
The second-order overtones of graphite bands are less intense compared to the primary modes and are observed at 2647 cm−1 (S2), 2962 cm−1 (S3), and 3233 cm−1 (S4)46. Additional bands are also identified at 2913 cm−1 and
3069 cm−1 and are likely due to C–H stretching50. (b) Raman spectrum showing an intense and sharp mode
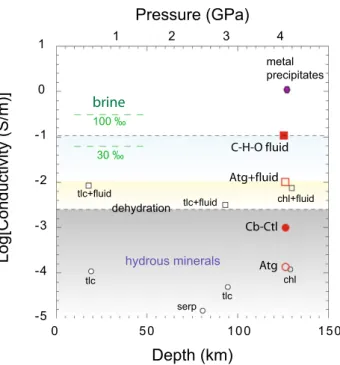
explained by the increased mobility of charge carriers in the aqueous fluid medium. The electrical conductivity of C–H–O fluids displays more than one order of magnitude greater electrical conductivity compared to C-free aqueous fluids. The elevated conductivity of C–H–O fluids can be attributed to the high concentrations of dis-solved mobile ions in the resulting fluid. The contrast in electrical conductivity may provide diagnostic criteria for detecting the dehydrating C–H–O fluids that carry carbon into the mantle wedge (Fig. 6).
Implications for the carbon recycling of the mantle.
The low carbon concentrations in the mantle compared to the solar abundances63,64 may indicate either owing to its volatile nature, carbon was lost duringaccretion stages in the early history of the Earth or it is also likely that a part of this missing carbon might be sequestered in the Earth’s interior5. However, unlike hydrogen, which is often sequestered as defects in nominally
anhydrous mineral phases65, the solubility of carbon in mantle silicate is extremely limited66,67, and hence, in the
deep mantle carbon mainly occurs as accessary carbonate minerals stabilized in deeply subducted slabs66,68. It
has been suggested that high-pressure dolomite (dolomite-III)69 and magnesite are the major carbonate phase
that is stable in the Earth’s lower mantle69–73. The stability of magnesite depends on the mantle redox conditions,
at highly reducing conditions, magnesite is likely to decompose and transform into a mixture of diamond or metal carbides74. However, the transport of carbonates into the mantle transition zone and the lower mantle
could still occur through deeply subducted slabs, where relatively oxidized environments are likely74.
Based on the seismic velocity, it is expected that 20–45% of the ocean floor is serpentinized by hydrothermal alterations75. As the volumetrically important hydrated lithology in the subducting slab, serpentine plays a vital
role in transporting water into the deep mantle, however, its significance as a host for carbonate/carbon and the role it is likely to play in carbon sequestration in the deep Earth is equally crucial. The CO2-rich fluids released
during the devolatilization of carbonate-bearing chrysotile present ideal conditions to stabilize dolomite or magnesite76, thus providing an efficient mechanism to transport carbon to the deep mantle via deeply subducted
altered oceanic crust.
In our experimental study, we observe extensive crystallization of dolomite following the dehydration of calcite bearing chrysotile. It has been shown that dolomite can be transformed into magnesite bearing phases at high pressure70 or can be transformed into high-pressure phases such as dolomite-III above 35 GPa69. The
dolomite forming reaction during the dehydration decarbonation of carbonate-bearing serpentine is therefore a key process in transporting carbon into the deep Earth by subducted slabs.
-5 -4 -3 -2 -1 0 1 0 50 100 150
Depth (km)
Log[Conductivity (S/m)]
Pressure (GPa)
1 2 3 4 tlc tlc chl serp hydrous minerals tlc+fluid tlc+fluid chl+fluid metal precipitates 30 ‰ 100 ‰ dehydrationbrine
Atg Cb-Ctl Atg+fluid C-H-O fluidFigure 6. A compilation of electrical conductivity data of layered hydrous silicate minerals and released
aqueous fluids upon dehydration and metal precipitates that are often facilitated by dehydration. The electrical conductivity data reported in this figure are from previously reported electrical conductivity studies on talc (tlc)45,83, serpentine (serp), and chlorite (chl)24. The electrical conductivity of hydrous minerals, aqueous fluids
released via dehydration in subduction-zone settings, and metal precipitates are segregated by dashed horizontal lines. It also shows that the electrical conductivity of C–H–O aqueous fluids is quite high compared to the normal aqueous fluids. However, the formation of interconnected networks of metal precipitates is likely to generate the highest electrical conductivities in subduction zone settings24.
7 Scientific Reports | (2021) 11:3745 | https://doi.org/10.1038/s41598-021-82174-8
www.nature.com/scientificreports/
Methods
Sample characterization.
In this study, we used two serpentinite samples. One of the serpentinite con-tained chrysotile polymorph and minor amounts of calcite. The other serpentinite sample consists dominantly of antigorite polymorph with a minor amount of magnetite (Supplementary Fig. 1). The chemical composition of each sample, both before and after the electrical conductivity measurements were confirmed with an elec-tron probe microanalysis (EPMA) using a JEOL-JXA-8200 elecelec-tron microprobe operating at an accelerating voltage of 15 kV and a beam current of 20 nA (Supplementary Table 1). The chemical mapping of the samples was obtained using energy dispersive x-ray spectroscopy (EDS) chemical mapping using a JEOL JSM-5910LV scanning electron microscope (SEM) The chrysotile starting sample was further characterized by a transmission electron microscope (TEM) equipped with a field emission gun operated at 200 kV at Bayerisches Geoinstitut, Germany (Fig. 1). TEM often provides details about the microstructure, texture, and structural relationship in serpentine polymorphs77. Also, the crystal structure determinations of chrysotile is often challenging and rely onmodeling78, TEM has often been used to identify chrysotile. For chemical analyses, samples were polished along
the axial direction of the high-pressure cell using corundum powder. During the sample preparation for EMPA and SEM analyses, we avoid the traditional carbon coating of the sample, instead, coated the sample with a gold layer to counter the charging effect. These strict protocols help avoid the undesired contaminations of carbon-based compounds during the sample preparation.
High-resolution SEM images of the plane of the polished cross-section of the sample79,80 were used to
deter-mine the grain boundary/wetting angles. The apparent angles were measured by placing two vectors along the two adjacent grain boundaries that were in contact with the fluid. For each sample analyzed, we have measured ~ 100 apparent angles. The precision of the angle measurements is within ± 5°.
High‑pressure and temperature experiments.
High-pressure, high-temperature experiments wereperformed using a 1200-ton anvil apparatus at Bayerisches Geoinstitut, Germany. We use a 25/15 multi-anvil cell configuration for the electrical conductivity measurements at 4 GPa (Supplementary Fig. 1). For the electrical conductivity measurements, cylindrical cores of serpentine samples with 2 mm diameter and 2.5 mm in length were placed in a polycrystalline MgO capsule, which electrically insulates the sample from the furnace during the measurements. Two molybdenum (Mo) disks placed at the top and bottom sides of the sample served as electrodes for the electrical conductivity measurements. The presence of Mo adjacent to the sample is also expected to maintain the oxygen fugacity of the sample close to the Mo–MoO2 buffer. A Mo metal-foil jacket
(25 μm) placed between the graphite furnace and the sample protect the sample from possible contaminations from graphite diffusing through the MgO-sleeve at high temperature. The metal jacket, connected to the ground via an anvil also removes undesirable electrical noise generated by the heating system, improving the quality of impedance spectra. A W95Re5–W74Re26 thermocouple junction was placed at one side of the sample, which
monitored the temperature. One cable from the thermocouple and a separate W95Re5 cable connected to the
opposite side of the sample connected the impedance spectroscope for the electrical conductivity measurements. The three-electrode configuration avoids lead cables sharing the same anvil, which may improve the insulation resistance of the assembly. MgO ceramic sleeves insulate the electrode wires and avoid undesired contacts with the furnace. All ceramic assembly parts including the pressure media were baked at 1273 K for more than 12 h to remove adsorbed moisture from the ceramic assembly components.
Impedance spectroscopy.
Electrical conductivity measurements were based on the impedance spectros-copy method using the Solatron 1260 Impedance/Gain-phase analyzer in the frequency range of 106–101 Hz.We have determined the insulation resistance of the assembly at similar pressure–temperature conditions prior to the actual experiment to determine the lowest resistance that can be measured using the present assembly configuration. After reaching the desired pressure, we kept the assembly at 500 K for more than 12 h to remove adsorbed moisture from the surrounding assembly parts. The next heating cycle was started once the sample resistance reached a steady value81.
The measurements were conducted in several heating–cooling cycles. Once the electrical conductivity of the starting samples was established, the temperature gradually increased to initiate the dehydration of the sample, and measurements were performed in smaller temperature steps (25–50 K). Once the interconnectivity of the fluid phase has been completed, as seen by the drastic decrease of the sample resistance, the temperature gradu-ally brought down to room temperature in similar temperature steps, while collecting the impedance spectra at each step.
The impedance spectra of polycrystalline samples can be characterized by a combination of resistor–capaci-tor (R–C/CPE) circuits. The sample resistance can be obtained by fitting impedance spectra to an appropriate equivalent circuit. As for the dry sample, resistance is dominated by grain interior processes; the fitting requires resistor–capacitor circuits in series23,24. However, when dehydration introduces highly conductivity fluids, the
influence of the grain boundary (fluid phase) process dominates over the grain interior, so that the resister-capacitor circuits have to be in parallel configuration23,24. Once the sample resistance has been determined,
electrical conductivity can be determined using the sample diameter and length.
Micro‑Raman analyses.
Raman spectroscopy is one of the few analytical techniques that can identify structural changes in carbon. This technique is also suitable to identify solute species in fluids50. Raman spectrawere collected in a back-scattered geometry using an InVia confocal Raman micro-spectrometer, equipped with a 532 nm diode laser, a Peltier-cooled CCD detector, a Rayleigh rejection edge filter82. The laser power of 1 mW;
result in lateral and axial spatial resolutions of ~ 1 and 3 μm and a spectral resolution of less than 1 cm−1. The
acquisition time was 15 s.
Data availability
All data generated or analyzed during this study are included in this article and its Supplementary Information files. The raw electrical conductivity data are available from the corresponding author on reasonable request.
Received: 14 October 2020; Accepted: 15 January 2021
References
1. Wallace, P. J. Volatiles in subduction zone magmas: Concentrations and fluxes based on melt inclusion and volcanic gas data. J. Volcanol. Geotherm. Res. 140, 217–240 (2005).
2. Rüpke, L. H., Morgan, J. P., Hort, M. & Connolly, J. A. D. D. Serpentine and the subduction zone water cycle. Earth Planet. Sci. Lett. 223, 17–34 (2004).
3. Rüpke, L. H., Morgan, J. P. & Dixon, J. E. Implications of subduction rehydration for Earth’s deep water cycle. In Earth’s Deep Water Cycle (eds Jacobsen, S. D. & Van Der Lee, S.) 263–276 (American Geophysical Union, Washington, 2006).
4. Dixon, J. E., Leist, L., Langmuir, C. & Schilling, J. Recycled dehydrated lithosphere observed in plume-influenced mid-ocean-ridge basalt. Nature 420, 385–389 (2002).
5. Dasgupta, R. & Hirschmann, M. M. The deep carbon cycle and melting in Earth’s interior. Earth Planet. Sci. Lett. 298, 1–13 (2010). 6. Kelemen, P. B. & Manning, C. E. Reevaluating carbon fluxes in subduction zones, what goes down, mostly comes up. Proc. Natl.
Acad. Sci. USA 112, E3997–E4006 (2015).
7. Hirschmann, M. M. Mantle solidus: Experimental constraints and the effects of peridotite composition. Geochem. Geophys. Geosyst.
1, 1042 (2000).
8. Debret, B. & Sverjensky, D. A. Highly oxidising fluids generated during serpentinite breakdown in subduction zones. Sci. Rep. 7, 1–6 (2017).
9. Piccoli, F. et al. Subducting serpentinites release reduced, not oxidized, aqueous fluids. Sci. Rep. 9, 19576 (2019).
10. Arcay, D., Tric, E. & Doin, M. P. Numerical simulations of subduction zones. Effect of slab dehydration on the mantle wedge dynamics. Phys. Earth Planet. Inter. 149, 133–153 (2005).
11. Hacker, B. R., Peacock, S. M., Abers, G. A. & Holloway, S. D. Subduction factory 2. Are intermediate-depth earthquakes in sub-ducting slabs linked to metamorphic dehydration reactions?. J. Geophys. Res. 108, 2030 (2003).
12. Schmidt, M. W. & Poli, S. Experimentally based water budgets for dehydrating slabs and consequences for arc magma generation. Earth Planet. Sci. Lett. 163, 361–379 (1998).
13. Li, Y. Immiscible C–H–O fluids formed at subduction zone conditions. Geochem. Perspect. Lett. 3, 12–21 (2017).
14. Caciagli, N. C. & Manning, C. E. The solubility of calcite in water at 6–16 kbar and 500–800 °C. Contrib. Mineral. Petrol. 146, 275–285 (2003).
15. Frezzotti, M. L., Selverstone, J., Sharp, Z. D. & Compagnoni, R. Carbonate dissolution during subduction revealed by diamond-bearing rocks from the Alps. Nat. Geosci. 4, 703–706 (2011).
16. Sverjensky, D. A., Stagno, V. & Huang, F. Important role for organic carbon in subduction-zone fluids in the deep carbon cycle. Nat. Geosci. 7, 909–913 (2014).
17. Poli, S., Franzolin, E., Fumagalli, P. & Crottini, A. The transport of carbon and hydrogen in subducted oceanic crust: An experi-mental study to 5 GPa. Earth Planet. Sci. Lett. 278, 350–360 (2009).
18. Huang, F., Daniel, I., Cardon, H., Montagnac, G. & Sverjensky, D. A. Immiscible hydrocarbon fluids in the deep carbon cycle. Nat. Commun. 8, 15798 (2017).
19. Kawamoto, T. et al. Mantle wedge infiltrated with saline fluids from dehydration and decarbonation of subducting slab. Proc. Natl. Acad. Sci. USA 110, 9663–9668 (2013).
20. McGary, R. S., Evans, R. L., Wannamaker, P. E., Elsenbeck, J. & Rondenay, S. Pathway from subducting slab to surface for melt and fluids beneath Mount Rainier. Nature 511, 338–340 (2014).
21. Evans, R. L., Wannamaker, P. E., McGary, R. S. & Elsenbeck, J. Electrical structure of the central Cascadia subduction zone: The EMSLAB Lincoln Line revisited. Earth Planet. Sci. Lett. 402, 265–274 (2014).
22. Zhao, D. Seismological structure of subduction zones and its implications for arc magmatism and dynamics. Phys. Earth Planet. Inter. 127, 197–214 (2001).
23. Manthilake, G., Mookherjee, M., Bolfan-Casanova, N. & Andrault, D. Electrical conductivity of lawsonite and dehydrating fluids at high pressures and temperatures. Geophys. Res. Lett. 42, 7398–7405 (2015).
24. Manthilake, G., Bolfan-Casanova, N., Novella, D., Mookherjee, M. & Andrault, D. Dehydration of chlorite explains anomalously high electrical conductivity in the mantle wedges. Sci. Adv. 2, e1501631 (2016).
25. Hamann, S. D. & Linton, M. Electrical conductivity of water in shock compression. Trans. Faraday Soc. 62, 2234–2241 (1966). 26. Hamann, S. D. & Linton, M. Electrical conductivities of aqueous solutions of KCl, KOH and HCl, and the ionization of water at
high shock pressures. Trans. Faraday Soc. 65, 2186–2196 (1969).
27. Wang, D., Guo, Y., Yu, Y. & Karato, S. I. Electrical conductivity of amphibole-bearing rocks: Influence of dehydration. Contrib. Mineral. Petrol. 164, 17–25 (2012).
28. Zhu, M., Xie, H., Guo, J., Bai, W. & Xu, Z. Impedance spectroscopy analysis on electrical properties of serpentine at high pressure and high temperature. Sci. China Ser. D Earth Sci. 44, 336–345 (2001).
29. Guo, H. & Keppler, H. Electrical conductivity of NaCl-Bearing aqueous fluids to 900 °C and 5 GPa. J. Geophys. Res. Solid Earth
124, 1397–1411 (2019).
30. Guo, X., Yoshino, T. & Shimojuku, A. Electrical conductivity of albite–(quartz)–water and albite–water–NaCl systems and its implication to the high conductivity anomalies in the continental crust. Earth Planet. Sci. Lett. 412, 1–9 (2015).
31. Shimojuku, A., Yoshino, T. & Yamazaki, D. Electrical conductivity of brine-bearing quartzite at 1 GPa: Implications for fluid content and salinity of the crust. Earth Planets Space 66, 2 (2014).
32. Shimojuku, A., Yoshino, T., Yamazaki, D. & Okudaira, T. Electrical conductivity of fluid-bearing quartzite under lower crustal conditions. Phys. Earth Planet. Inter. 198–199, 1–8 (2012).
33. Sinmyo, R. & Keppler, H. Electrical conductivity of NaCl-bearing aqueous fluids to 600 °C and 1 GPa. Contrib. to Mineral. Petrol.
172, 1–12 (2017).
34. Sun, W. et al. Electrical conductivity of clinopyroxene–NaCl–H2O system at high temperatures and pressures: Implications for
high-conductivity anomalies in the deep crust and subduction zone. J. Geophys. Res. Solid Earth 125, 1–16 (2020).
35. Hilairet, N., Daniel, I. & Reynard, B. P–V equations of state and the relative stabilities of serpentine varieties. Phys. Chem. Miner.
9 Scientific Reports | (2021) 11:3745 | https://doi.org/10.1038/s41598-021-82174-8
www.nature.com/scientificreports/
36. Bezacier, L., Reynard, B., Bass, J. D., Wang, J. & Mainprice, D. Elasticity of glaucophane, seismic velocities and anisotropy of the subducted oceanic crust. Tectonophysics 494, 201–210 (2010).
37. Marquardt, H., Speziale, S., Koch-Müller, M., Marquardt, K. & Capitani, G. C. Structural insights and elasticity of single-crystal antigorite from high-pressure Raman and Brillouin spectroscopy measured in the (010) plane. Am. Mineral. 100, 1932–1939 (2015).
38. Mookherjee, M. & Stixrude, L. Structure and elasticity of serpentine at high-pressure. Earth Planet. Sci. Lett. 279, 11–19 (2009). 39. Mookherjee, M. & Capitani, G. C. Trench parallel anisotropy and large delay times: Elasticity and anisotropy of antigorite at high
pressures. Geophys. Res. Lett. 38, 1–6 (2011).
40. Stesky, R. M. & Brace, W. F. Electrical conductivity of serpentinized rocks to 6 kilobars. J. Geophys. Res. 78, 7614–7621 (1973). 41. Reynard, B., Mibe, K. & de Moortèle, B. V. Electrical conductivity of the serpentinised mantle and fluid flow in subduction zones.
Earth Planet. Sci. Lett. 307, 387–394 (2011).
42. Evans, B. W. The serpentinite multisystem revisited: Chrysotile is metastable. Int. Geol. Rev. 46, 479–506 (2004).
43. Fei, H., Druzhbin, D. & Katsura, T. The Effect Of Water On Ionic Conductivity In Olivine. J. Geophys. Res. Solid Earth 125, e2019JB019313 (2020).
44. Manthilake, G. et al. The electrical conductivity of liebermannite: Implications for water transport into the Earth’s lower mantle. J. Geophys. Res. Solid Earth 125, e2020JB020094 (2020).
45. Guo, X., Yoshino, T. & Katayama, I. Electrical conductivity anisotropy of deformed talc rocks and serpentinites at 3GPa. Phys. Earth Planet. Inter. 188, 69–81 (2011).
46. Henry, D. G., Jarvis, I., Gillmore, G. & Stephenson, M. Raman spectroscopy as a tool to determine the thermal maturity of organic matter: Application to sedimentary, metamorphic and structural geology. Earth-Sci. Rev. 198, 102936 (2019).
47. Lahfid, A. et al. Evolution of the Raman spectrum of carbonaceous material in low-grade metasediments of the Glarus Alps (Switzerland). Terra Nov. 22, 354–360 (2010).
48. Frezzotti, M. L., Huizenga, J. M., Compagnoni, R. & Selverstone, J. Diamond formation by carbon saturation in C–O–H fluids during cold subduction of oceanic lithosphere. Geochim. Cosmochim. Acta 143, 68–86 (2014).
49. Vitale Brovarone, A. et al. Massive production of abiotic methane during subduction evidenced in metamorphosed ophicarbonates from the Italian Alps. Nat. Commun. 8, 1–13 (2017).
50. Frezzotti, M. L., Tecce, F. & Casagli, A. Raman spectroscopy for fluid inclusion analysis. J. Geochem. Explor. 112, 1–20 (2012). 51. Luth, R. W. & Stachel, T. The buffering capacity of lithospheric mantle: Implications for diamond formation. Contrib. Mineral.
Petrol. 168, 1–12 (2014).
52. Carmichael, I. S. E. Mineralogy and the redox states of basic and silicic magmas: A reflection of their source regions?. Contrib. Mineral. Petrol. 106, 129–141 (1991).
53. Kelley, K. A. & Cottrell, E. Water and the oxidation state of subduction zone magmas. Science 325, 605–607 (2009).
54. Cartigny, P. et al. The origin and formation of metamorphic microdiamonds from the Kokchetav massif, Kazakhstan: A nitrogen and carbon isotopic study. Chem. Geol. 176, 265–281 (2001).
55. Bruce Watson, E. & Brenan, J. M. Fluids in the lithosphere, 1. Experimentally-determined wetting characteristics of CO2H2O fluids
and their implications for fluid transport, host-rock physical properties, and fluid inclusion formation. Earth Planet. Sci. Lett. 85, 497–515 (1987).
56. Watson, E. B., Brenan, J. M. & Baker, D. R. Continental Mantle (Oxford Univeristy Press, Oxford, 1991).
57. Mibe, K., Fujii, T. & Yasuda, A. Connectivity of aqueous fluid in the Earth’s upper mantle. Geophys. Res. Lett. 25, 1233–1236 (1998). 58. Holness, M. B. Melt-solid dihedral angles of common minerals in natural rocks. J. Petrol. 47, 791–800 (2006).
59. Holness, M. B. & Graham, C. M. Equilibrium dihedral angles in the system H2O–CO2–NaCl–calcite, and implications for fluid
flow during metamorphism. Contrib. Mineral. Petrol. 108, 368–383 (1991).
60. Yoshino, T., Mibe, K., Yasuda, A. & Fujii, T. Wetting properties of anorthite aggregates: Implications for fluid connectivity in continental lower crust. J. Geophys. Res. Solid Earth 107, ECV 10-1–ECV 10-8 (2002).
61. Huang, Y., Nakatani, T., Nakamura, M. & McCammon, C. Experimental constraint on grain-scale fluid connectivity in subduction zones. Earth Planet. Sci. Lett. 552, 116610 (2020).
62. Kawano, S., Yoshino, T. & Katayama, I. Electrical conductivity of magnetite-bearing serpentinite during shear deformation. Geo-phys. Res. Lett. 39, 1–5 (2012).
63. Anders, E. & Owen, T. Mars and earth: Origin and abundance of volatiles. Science 198, 453–465 (1977). 64. McDonough, W. F. Compositional model for the Earth’s core. Treatise Geochem. 2–9, 547–568 (2003).
65. Smyth, J. R. & Jacobsen, S. D. Nominally anhydrous minerals and Earth’s deep water cycle. In Earth’s Deep Water Cycle (eds Jacobsen, S. D. & Van Der Lee, S.) (American Geophysical Union, Washington, 2006). https ://doi.org/10.1029/168GM 02.
66. Keppler, H., Wiedenbeck, M. & Shcheka, S. S. Carbon solubility in olivine and the mode of carbon storage in the Earth’s mantle. Nature 424, 414–416 (2003).
67. Shcheka, S. S., Wiedenbeck, M., Frost, D. J. & Keppler, H. Carbon solubility in mantle minerals. Earth Planet. Sci. Lett. 245, 730–742 (2006).
68. Luth, R. Carbon and carbonates in the mantle. In Mantle Petrology: Field Observations and High Pressure Experimentation (a Tribute to Francis R. (Joe) Boyd) Vol. 6 (eds Fei, Y. et al.) 297–316 (The Geochemical Society, Special Publications, Washington, 1999). 69. Merlini, M. et al. Structures of dolomite at ultrahigh pressure and their influence on the deep carbon cycle. Proc. Natl. Acad. Sci.
U. S. A. 109, 13509–13514 (2012).
70. Isshiki, M. et al. Stability of magnesite and its high-pressure form in the lowermost mantle. Nature 427, 60–63 (2004). 71. Katsura, T. et al. Stability of magnesite under the lower mantle conditions. Proc. Jpn Acad. Ser. B Phys. Biol. Sci. 67, 57–60 (1991). 72. Gillet, P. Stability of magnesite (MgCO3) at mantle pressure and temperature conditions—A Raman-spectroscopic study. Am.
Mineral. 78, 1328–1331 (1993).
73. Redfern, S. A. T., Wood, B. J. & Henderson, C. M. B. Static compressibility of magnesite to 20 GPa: Implications for MgCO3 in the
lower mantle. Geophys. Res. Lett. 20, 2099–2102 (1993).
74. Stagno, V. et al. The stability of magnesite in the transition zone and the lower mantle as function of oxygen fugacity. Geophys. Res. Lett. 38, 1–5 (2011).
75. Cannat, M., Fontaine, F. & Escartín, J. Serpentinization and associated hydrogen and methane fluxes at slow spreading ridges. In Diversity of Hydrothermal Systems on Slow Spreading Ocean Ridges. Geophysical Monograph Series Vol. 188 (eds Rona, P. A. et al.) 241–264 (American Geophysical Union, Washington, 2013). https ://doi.org/10.1029/2008G M0007 60.
76. Kong, M. & Lee, Y. Carbonation of chrysotile under subduction conditions. Engineering 5, 490–497 (2019). 77. Dódony, I. & Buseck, P. R. Serpentines close-up and intimate: An HRTEM view. Int. Geol. Rev. 46, 507–527 (2004).
78. Demichelis, R., De La Pierre, M., Mookherjee, M., Zicovich-Wilson, C. M. & Orlando, R. Serpentine polymorphism: A quantitative insight from first-principles calculations. CrystEngComm 18, 4412–4419 (2016).
79. Laporte, D. Wetting behavior of partial melts during crustal anatexis: The distribution of hydrous silicic melts in polycrystalline aggregates of quartz. Contrib. Mineral. Petrol. 116, 486–499 (1994).
80. Laporte, D., Rapaille, C. & Provost, A. Wetting angles, equilibrium melt geometry, and the permeability threshold of partially molten crustal protoliths. In Granite: From Segregation of Melt to Emplacement Fabrics (eds Bouchez, J. L. et al.) 31–54 (Springer, Dordrecht, 1997).
81. Manthilake, G. et al. Electrical conductivity of wadsleyite as a function of temperature and water content. Phys. Earth Planet. Inter.
174, 10–18 (2009).
82. Schiavi, F. et al. Water quantification in silicate glasses by Raman spectroscopy: Correcting for the effects of confocality, density and ferric iron. Chem. Geol. 483, 312–331 (2018).
83. Wang, D. & Karato, S. I. Electrical conductivity of talc aggregates at 0.5 GPa: Influence of dehydration. Phys. Chem. Miner. 40, 11–17 (2013).
Acknowledgements
GM and MM acknowledge the visiting researcher program at the Bayerisches Geoinstitut, Universitaet Bayreuth, Bayreuth, Germany, which helped to initiate this study. MM acknowledges Prof. Hans Keppler for kindly shar-ing the carbonate-bearshar-ing chrysotile from the Mineralogical Museum of the University of Tubshar-ingen, Tubshar-ingen, Germany. Federica Schiavi is thanked for her help with the micro-Raman analyses. We thank Prof. Tahar Ham-mouda for stimulating discussions. GM acknowledges funding from the INSU-CNRS. MM acknowledges US NSF-EAR 1753125. This research was financed by the French Government Laboratory of Excellence initiative n°ANR-10-LABX-0006, the Région Auvergne, and the European Regional Development Fund (ClerVolc Con-tribution Number 450).
Author contributions
G.M. and M.M. conceptualized the study, performed the experiments, and analyzed the data. N.M. performed transmission electron microscope (TEM) analyses. G.M. and M.M. wrote the manuscript with inputs from N.M. All authors participated in the discussion and have agreed with the scientific content.
Competing interests
The authors declare no competing interests.
Additional information
Supplementary Information The online version contains supplementary material available at https ://doi. org/10.1038/s4159 8-021-82174 -8.
Correspondence and requests for materials should be addressed to G.M. Reprints and permissions information is available at www.nature.com/reprints.
Publisher’s note Springer Nature remains neutral with regard to jurisdictional claims in published maps and
institutional affiliations.
Open Access This article is licensed under a Creative Commons Attribution 4.0 International
License, which permits use, sharing, adaptation, distribution and reproduction in any medium or format, as long as you give appropriate credit to the original author(s) and the source, provide a link to the Creative Commons licence, and indicate if changes were made. The images or other third party material in this article are included in the article’s Creative Commons licence, unless indicated otherwise in a credit line to the material. If material is not included in the article’s Creative Commons licence and your intended use is not permitted by statutory regulation or exceeds the permitted use, you will need to obtain permission directly from the copyright holder. To view a copy of this licence, visit http://creat iveco mmons .org/licen ses/by/4.0/.