ONTOGENY AND EFFECT OF WEANING ON mRNA LEVELS OF
IGFs, EGF AND bFGF IN VARIOUS TISSUES OF THE PIG
By
Manli Peng
Thesis submitted to Department of Biology to obtain Ph. D. Degree
FACULTEDES SCIENCES
UNIVERSITEDE SHERBROOKE
RESUME
Ce travail porte sur 1'etude de trois facteurs de croissance qui peuvent etre importants dans Ie developpement d'organes particuliers du pore soit Ie pancreas, Ie foie, les reins et Ie muscle strie. On croit que ces facteurs de croissance seraient directement impliques dans la croissance de ces tissus. Ces trois facteurs sont Ie facteur de croissance insulinique I et
-II (IGFs), Ie facteur de croissance epidermique (EGF) et Ie facteur de croissance fibroblastique basique (bFGF). Nous avons done mesure les niveaux d'ARN messager (ARNm) de chacun des facteurs et de leurs recepteurs (R) ainsi que les proteines liantes de IGF (IGFBPs) a partir du stade foetal jusqu'a 1'age de 180 jours. Dans Ie cas des IGF et de
ses proteines liantes, les concentrations seriques et dans chacun des tissus ont aussi ete
mesurees.
Les concentrations seriques d'lGFs etd'IGFBPs croissent avec 1'age, l'IGFBP-3 etant la forme dominante lors de la periode postnatale. Dans Ie tissu pancreatique, on observe des niveaux d'ARNm de FIGF-I qui sont tres eleves dans Ie pancreas foetal et a la naissance. Au debut du sevrage (21iemejour), la concentration d'un des deux types d'lGF, soit 1'IGF-I, augmente de fa^on importante, y atteignant un maximum. Cette augmentation est concomitante avec un niveau eleve de son ARNm et des zymogenes pancreatiques. Quant
aux niveaux pancreatiques des ARNm de 1'IGF-II et du recepteur de 1'IGF-I (IGF-IR), ils
suivent un patron similaire a la concentration d'IGF-11, laquelle est elevee chez Ie foetus de 90 jours, periode qui correspond a une croissance rapide du pancreas. Les niveaux d'ARNm
de 1'EGF, de son recepteur (EGFR) et du bFGF sont plus eleves durant la vie foetale
qu'apres la naissance. Ces observations suggerent que les quatre facteurs de croissance
etudies sont impliques dans Ie developpement pancreatique foetal. A 1'age de 27 et 30 jours,
on a constate que les niveaux d'ARNm pancreatique de 1'EGF sont plus eleves chez les porcelets sevres que chez ceux qui sont encore allaites, ce qui suggere un role de 1'EGF dans Ie developpement pancreatique lors du sevrage.
Dans Ie foie, les niveaux d'ARNm de FIGF-I sont paralleles a sa concentration dans Ie tissu. Les concentrations elevees de 1'IGF-I et -II dans Ie tissu correspondent a des periodes de croissance acceleree de 1'organe, soit entre Ie ler et Ie 21ieme jour. Par comparaison avec les autres tissus etudies, c'est dans Ie foie que 1'ARNm de 1'IGFBP-I est Ie plus eleve. Bien que Ie niveau d'ARNm du recepteur de 1'EGF soit eleve, 1'ARNm de 1'EGF lui-meme n'a pu y etre detecte. Quant au bFGF hepatique, ses niveaux d'ARNm sont eleves durant toute la periode de developpement.
Dans Ie rein, les niveaux d'ARNm des IGFs etaient eleves dans Ie foetus tandis que les concentrations des IGFs atteignaient un maximum chez Ie nouveau-ne, lesquelles etaient associees a une periode de croissance rapide de cet organe. Comme dans Ie foie, les ARNm
du bFGF sont abondants mais stables contrairement au niveau d'ARNm de 1'EGF qui
augmente durant cette periode de developpement.
Dans Ie muscle strie, les ARNm des deux especes d'lGF (IGF-I et IGF-II), de son
recepteur, de ses proteines liantes ainsi que Ie bFGF sont abondants durant toute la periode foetale et les premiers jours de vie. Quant a FEGF, son niveau d'ARNm y augmente tout
au cours du developpement. Ces observations suggerent done que les IGF, 1'EGF et les bFGF sont des regulateurs physiologiques de la croissance et de la maintenance du tissus musculaire strie.
On peut done conclure que les niveaux d'ARNm et les concentrations dans les tissus des differents facteurs de croissance etudies ici et ceux de leur proteines accessoires varient considerablement selon Forgane et 1'age de 1'animal. Nous avons mis en evidence que les ARNm des IGF, de leurs recepteurs et de leurs proteines liantes sont parfois controles de fa^on coordonnee dans les tissus comme Ie pancreas et Ie foie. Nous avons aussi mis en evidence que les periodes de croissance rapide du pancreas, du foie et du rein sont accompagnees par des niveaux eleves d'ARNm des IGF, de 1'EGF et du bFGF, suggerant done que ces facteurs de croissance sont d'importants regulateurs de la croissance et du developpement de ces organes.
SUMMARY
In the present study, we have examined three growth factors which can be important for organ development of pancreas, liver, kidney and muscle. We believe that these growth factors are involved in the growth of these tissues. These growth factors are the insulin like
growth factor-I and -II (IGFs), the epidermal growth factor (EGF) and the basic fibroblast growth factor (bFGF). We have measured the messenger RNA (mRNA) levels of these growth factors and those of their receptors (R) as well as IGF binding proteins (IGFBPs) from fetal life to 180 days of age. In the case of IGFs and IGFBPs, concentrations in the
serum and in each tissue were also measured.
The IGFs and IGFBPs serum concentrations increased with advancing age, the IGFBP-3 being the major IGF binding protein in serum during postnatal life. In the pancreas, IGF-I mRNA levels were high during the fetal and early postnatal life. Around the weaning period (21 days of age), tissue concentration of IGF-I reached a maximal level which was
concomitant with a high IGF-I mRNA level and an increased activity ofpancreatic enzymes.
Pancreatic IGF-II and IGFI-R mRNA levels as well as IGF-II tissue concentrations were high in fetuses and were accompanied by a rapid growth period of pancreas in fetuses of 90 days of age. Levels of EGF, EGFR and bFGF mRNAs were higher during the fetal life than after birth. These results imply that multiple growth factors are involved in fetal pancreatic development. At 27 and 30 days of age, EGF mRNA levels were higher in weaned than in suckling piglets, suggesting a possible involvement of EGF inpancreatic development during
the weaning period.
In the liver, IGF-I mRNA level paralleled its tissue concentration. High tissue
concentration of both IGF-I and -II at 1 and 21 days of age corresponded to an accelerated
growth period of the liver. The IGFBP-1 mRNA level was the most abundant in the liver
when compared to that of other tissues. In the liver, abundant EGFR mRNA level was
observed whereas EGF mRNA was undetected. The bFGF mRNA levels were high over the
whole developmental period.
In the kidney, IGFs mRNA levels were high in fetuses while kidney IGFs
concentrations peaked in newborns, which were associated with a fast growth period of this
organ. As observed in the liver, the bFGF mRNA was abundant in the kidney during the whole developmental period, while EGF mRNA level increased with development.
In the skeletal muscle, IGF-I, IGF-II, IGF-IR, IGFBP-3 and bFGF mRNAs were all abundant during fetal and neonatal life. The EGF mRNA level increased during development. These data suggest that IGFs, EGF and bFGF are likely physiological
regulators of growth and maintenance of the skeletal muscle.
In conclusion, mRNA levels and concentrations of growth factors and their binding proteins are tissue and developmentally regulated. Concentrations and mRNA levels ofIGFs,
IGFRs and IGFBPs are coordinately regulated in the pancreas and liver. Fast growth periods
ofpancreas, liver and kidney are accompanied by high concentrations ofIGFs and abundant
mRNA levels of IGFs, EGF and bFGF, suggesting that these growth factors are important
ACKNOWLEDGEMENTS
I would like to express my appreciation to all who have contributed to the completion of this thesis. I am greatly indebted to professor G. Pelletier and professor D. LeBel, my
supervisors, for their guidance, encouragement and financial assistance throughout the research program and preparation of this thesis.
Thanks are also given to professor C. Asselin, professor R. Bealouin and professor F. Pothier members of my Ph. D. program committee for discussion and helpful suggestion for thesis writing.
I also want to extend my sincere thanks to Dr. E. Calvo and Dr. M-F. Palin for their advice, useful discussions and technical support.
I would also like to thank all the members of our research group for their friendship,
helpful discussion and technical support.
Finally, I would like to thank my husband, Xiaqjun Li, my daughter Wenfei Li as
well as my parents in China for their deepest love, encouragement and understanding
CONTENTS
RESUME...i SUMMARY...iv ACKNOWLEDGMENT...vi CONTENTS...vii LIST OF ABBREVIATIONS...xi LIST OF FIGURES ...xv LIST OF TABLES...xviii LIST OF APPENDIX...xix CHAPTER I INTRODUCTION...! PART A: BASIC KNOWLEDGE...! 1.1 EMBRYONIC DEVELOPMENT OF PANCREAS, LIVER, KIDNEY AND SKELETAL MUSCLE IN HUMAN...1Pancreas ...1
Liver ...2
Kidney ...2
1.2 SIGNAL TRANSDUCTION PATHWAYS AND CELL PROLIFERATION...^ Signal transduction by receptors with ligand-depaendent tyrosine kinase
activity ...6
Signal transduction through G protein-coupled receptors ...9
Signalling pathways from cell surface receptors to nuclei... 11
1.3 REGULATION OF TRANSCRIPTION FACTOR EXPRESSION BY SIGNAL
TRANSDUCTION PATHWAYS ...13Altered DNA-binding and activation... 13
Signalling pathways regulating transcription factors by phosphorylation.,.14 Regulation of transcription initiation by RNA polymerase II (pol II) ...16
Regulation of mRNA stability... 18
PART B: GENERAL INTRODUCTION TO THE PROJECT ...21
1.4 GENE EXPRESSION AND BIOLOGICAL ACTION OF INSULIN-LIKE GROWTH
FACTORS (IGFs), EPIDERMAL GROWTH FACTOR (EGF) AND BASIC
FIBROBLAST GROWTH FACTOR (bFGF) DURING DEVELOPMENT...^! 1.4.1 Insulin-like growth factor-I and -II (IGF-I and -H) ...22IGFs during development...26
IGF receptors during development...28
IGF binding proteins during development. ...30
IGFs and pancreas ...33
IGFs and liver...33
IGFs and kidney...34
IGFs and skeletal muscle...35
1.4.2 Epidermal growth factor (EGF)...36
EGFR during fetal development...37
EGF during development...38
Biological action of EGF...41
EGF and pancreas...41
EGF and liver...A2 EGF and kidney...A2 1.4.3 Basic fibroblast growth factor (bFGF)...43
1.4.4 Nutritional regulation of IGFs, EGF and bFGF...45
1.5 HYPOTHESIS AND OBJECTIVES OF THE PROJECT...47
CHAPTER H MATERIALS, METHODS AND RESULTS...49
2.1 ONTOGENY OF IGFs, IGFBPs AND IGFRs mRNA LEVELS IN PORCINE PANCREAS...49
2.1.1 Contributions to manuscript 2.1...49
2.2 ONTOGENY OF IGFs AND IGFBPs mRNA LEVELS AND TISSUE
CONCENTRATIONS IN LIVER, KIDNEY AND SKELETAL MUSCLE OF PIG
.90
2.2.1 Contributions to manuscript 2.2 ...90
2.2.2 Manuscript 2.2...91
2.3 ONTOGENY OF EPIDERMAL GROWTH FACTOR (EGF), EGF RECEPTOR
(EGFR) AND BASIC FIBROBLAST GROWTH FACTOR (bFGF) mRNA LEVELS
IN PANCREAS, LIVER, KIDNEY AND SKELETAL MUSCLE OF PIGS.... 1082.3.1 Contributions to manuscript 2.3... 108
2.3.2 Manuscript 2.3 ...109
2.4 EFFECT OF WEANING ON EPIDERMAL GROWTH FACTOR AND ITS
RECEPTOR MESSENGER RNA LEVELS IN VARIOUS TISSUES OF PIGLETS
.134 2.4.1 Contributions to manuscript 2.4... 1342.4.2 Manuscript 2.4 ...135
CHAPTER HI GENERAL DISCUSSION...139
REFERENCES...146
LIST OF ABBREVIATIONS
AC: adenylate cyclase ALS: acid-labile
bFGF: basic fibroblast growth factor
BSA: bovine serum albumin
cAMP: cyclic adenosine monophosphate CBP: CREB-binding protein
CCK: cholecystokinin cDNA: complementary DNA CKII: casein kinase II
CRE: cAMP-response element
CREB: cAMP-response element-binding protein GRID: coding region instability determinant
CTD: C-terminal domain
DAG: diacylglycerol
DNA: deoxyribonucleic acid
EDTA: disodium ethenediamine tetraacetic acid EGF: epidermal growth factor
EGFR: EGF receptor
GH: growth hormone
GHR: GH receptor
GAP: GTPase-activating protein GDP: guanosine diphosphate GTP: guanosine triphosphate HGF: hepatocyte growth factor HLH: helix-loop-helix
IGF: insulin-like growth factor
IGFBP: IGF binding protein
IGFR: IGF receptor IkB: inhibitor protein
IPS: inositol 1,4,5-trisphosphate
IRS: insulin-receptor substrate
JAK: Janus kinase
JNK: c-Jun NHz-terminal kinase
MAPK: mitogen activated protein kinase
MAPKK: MAPK kinase
mRNA: messenger RNA NC: negative cofactor
NF-I: neurofibromatosis type I protein
PABP: PH: PI3-K: PIP2: PKC: PL: PLD: PLC: PLC-7: PLC-i8: Pol II: RIA: RNA: RTK: RT-PCR: SDS: SH2: SP1: SRE: SRF: STAT:
poly (A)-binding protein
pleckstrin homology phosphoinositide 3-kinase phosphatidylinositol 4,5-bisphosphate protein kinase C phospholipase phospholipase D phospholipase C phospholipase €-7 phospholipase C-^ polymerase II radioimmunoassay ribonucleic acid
receptor tyrosine kinase
reverse transcription polymerase chain reaction
sodium dodecyl sulfate src homology 2 domains stimulated protein 1
serum response element serum response factor
TBP: TATA box binding protein TBS: tris buffer saline
TCF: ternary complex factor
TPA: 12-0-tetradecanoyl-phorbol-13-acetate
TRE: TPA response element TF: transcription factor TTR: transthyretin
LIST OF FIGURES
Figure 1.1.1 Development of pancreas in human embryo during the fourth to sixth week
of gestation...4
Figure 1.2.1 Signalling pathways from the cell surface receptors to the nuclei... 12 Figure 1.2.2 Schematic model of transcription initiation complex assembly...20
Figure 1.4.1 Illustration of some growth factors involved in the cell cycle at different
phases...22
Figurel .4.1.1 Structure and expression of the human IGF-I gene...24
Figurel.4.1.2 Structure of the human IGF-II gene organization and mRNAs species...25
Figurel .4.2.1 Ontogeny of EGF receptors in the fetal mouse. ...40
Figures of manuscript 2.1: Peng, M. et al. J. Anim. Sci. (Submitted)
Figure 1 Effect of age on: a)pig pancreatic weight, b)total pancreatic DNA to body weight ratio, c)organ weight, d)total RNA and e)protein to DNA ratios ..81
Figure 2 Effect of age on IGF-I mRNA level in pig pancreas...82
Figure 3 Effect of age on pig pancreatic IGFI-R mRNA level ...83 Figure 4 Effect of age on IGF-II mRNA level in pig pancreas...84 Figure 5 Representitive Northern blot of IGFBP-1 mRNA in various pig tissues at fetal
90 days of age ...85
Figure 7 Effect of age on pig pancreatic GHR mRNA level ...87
Figure 8 Effect of age on pig pancreatic IGF-I and -II concentrations ...88
Figure 9 Effect of age on IGFBPs contents in pig pancreas ...89
Figures of manuscript 2.2: Peng, M. et al. Growth Dev. Aging, 1996.
60:171-187.
Figure 1 Representative Northern blot of IGF-I, -II, IGFI-R, IGFII-R, IGFBP-1,
IGFBP-3 andGHRmRNAs in various fetal tissues...93
Figure 2 Northern analysis of IGF-I mRNA levels in various tissues of pig during
development ...95
Figure 3 Northern analysis of IGF-II mRNA levels in various tissues of pig during
development ...95
Figure 4 Northern analysis of the IGFBP-1 mRNA levels in pig liver during
development...97
Figure 5 Northern analysis of IGFBP-3 mRNA levels in various tissues of pig during
development ...97
Figure 6 Northern analysis of IGFI-R mRNA levels in various tissues of pig during
development ...98
Figure 7 Northern analysis of IGFII-R mRNA levels in various tissues of pig during
development ...98
development ...99
Figure 9 Effect of age on serum IGF-I, -II and IGFBPs concentrations in pig... 100
Figure 10 Effect of age on IGF-I, -II and IGFBPs concentrations in liver of pig... 101
Figure 11 Effect of age on IGF-I, -II and IGFBPs concentrations in kidney of pig. 102 Figures of manuscript 2.3: Peng, M. et al. Domest. Anim. Endocrinol. (Submitted) Figure 1 Representative Northern blot of EGF, EGFR and bFGF mRNAs in pig various tissues at 90 days of age... 130
Figure 2 Effect of age on EGF mRNA levels in various tissues of pig... 131
Figure 3 Effect of age on EGFR mRNA levels in various tissues of pig... 132
Figure 4 Effect of age on bFGF mRNA levels in various tissues of pig ... 133
Figures of manuscript 2.4: Peng, M. etal. Can. J. Anim. Sci. 1996. 76:621-624. Figure 1 Effect of weaning on EGF mRNA in pig pancreas ... 137
LIST OF TABLES
Table 1.1.1 Morphological development of human exocrine pancreas...5
Table 1.1.2 Functional development of human exocrine pancreas...5
Tables of manuscript 2.2: Peng, M. et al. Growth Dev. Aging, 1996. 60: 171-187.
Table 1 Effect of age on liver weight and total DNA to body weight ratios and liver
weight, total RNA and protein to DNA ratios in the liver of pig... 103
Table 2 Effect of age on kidney weight and total DNA to body weight ratios and kidney weight, total RNA and protein to DNA ratios in the kidney of pig
.103
Tables of manuscript 2.4: Peng, M. etal. Can. J. Anim. Sci., 1996. 76:621-624.
Table 1 Effect of weaning on pancreas weight and total pancreatic DNA to body weight ratios and pancreas weight, total RNA and protein to DNA ratios in
APPENDIX
Appendix I Comparison of IGFs and IGFBPs mRNA levels in rat and pig during fetal and
postnatal life ... 167
Appendix II Body weight and food consumption of piglets around the weaning period .168 Appendix III Structure of human IGF-I cDNA probe... 169
Appendix IV Structure of rat IGF-II cRNA probe...170
Appendix V Structure of porcine IGFBP-3 cRNA probe ... 171
CHAPTER I INTRODUCTION
PART A: BASIC KNOWLEDGE
1.1 EMBRYONIC DEVELOPMENT OF PANCREAS, LIVER, KIDNEY AND
SKELETAL MUSCLE IN THE HUMAN
The first phase of human embryonic development lasts 8 weeks. From week 9 of gestation starts the fetal period which can be subdivided into the previable fetal period (9-18 weeks of development) and the viable fetal period (19-38 weeks of development). Development during the whole fetal period primarily concerns rapid body growth and further differentiation of organs and tissues (Kalousek et al., 1990).
Pancreas
The pancreatic exocrine and endocrine tissues arise from the dorsal and ventral
pancreatic buds that originate from the endodermal lining of the foregut (Gray et al., 1987). The pancreas is first detectable during the fifth week of gestation. By the 17th week, as a
consequence of rotation and fixation of the gut, the two buds fuse to form definitive ducts
(Fig. 1.1.1). The dorsal bud contributes to the tail and body of the mature gland, while the ventral bud contributes to the head. The main pancreatic duct is formed by the fusion of the
distal part of the dorsal pancreatic duct and the entire ventral pancreatic duct. The accessory
weeks, tubules become a network of interconnected ductulus and separation of endocrine from exocrine tissue has occurred. Discrete lobules and acini can be identified by 14-16 weeks. By 20 weeks, the acinar cells are well polarized with many mature zymogen granules
crowded in the apical cytoplasm (Table 1.1.1 and 1.1.2). Liver
The liver bud is formed from outgrowth of the endodermal epithelial lining of the foregut early in the fourth week (Kalousek et al., 1990). The caudate lobe and the quadrate lobes develop as a subdivision of the right lobe. The hepatic volume consistently increases during embryonic life. At about 8 to 9 weeks, the liver represents 10% of the body weight due to rapid growth and erythroblast accumulation. By term, the weight of the liver is only 5 % of the total body weight. During the early fetal stage, the basic glandular unit of the liver, seen through childhood and adulthood, is established. This unit, called the hepatic triad, consists of the bile ducts, hepatic artery, and portal vein. Differentiating biliary ducts can be seen in the connective tissue at 9 to 12 weeks. Bile formation by hepatic cells begins during the 12th week.
Kidney
The kidney begins to develop early in the 5th week and start to function about six weeks later (Kalousek et al., 1990). Kidney develops from the nephrogenic blastema and
ureteric bud. The nephrogenic blastema gives rise to the nephrons each consisting of a glomerulus and a proximal convoluted tubule, a loop of Henle, and a distal convoluted tubule. The ureteric bud differentiates into collecting tubules, renal pelvis, calyces, and
ureter. Glomeruli are first formed in the region of the metanephric tissue that, in the
definitive kidney, constitutes the juxtamedullary region. It has been estimated that approximately 20% of nephrons are morphologically formed and mature at 9 to 11 weeks of development, and another 10% is added at 14-18 weeks. By 12 weeks, the kidney is differentiated into a cortex and a medulla. By 16 weeks, development of the pyramids is
advanced. Glomeruli continue to form from the metanephric blastemal cap until about 36 weeks of gestation.
Muscle
The muscle system develops from the mesoderm (Hauschka, 1994). Muscle tissue develops from primitive cells called myoblasts which are derived from mesenchyme. The first indication of muscle development is the elongation of the nuclei and cell bodies of the
mesenchymal cells to form myoblasts. Soon, these cells begin to fuse with one another to form elongated, multinucleated, cylindrical structures called myotubes. Growth occurs by
continued fusion of myoblasts and myotubes. The specialized myofilaments develop in the cytoplasm of the myotubes during or after fusion of the myoblasts. Then, the myofibrils and other organelle characteristics ofstriated muscle fibres (cells) develop. Most striated skeletal muscle fibres develop before birth, and almost all the remaining ones are formed by the end of the first year. After birth, muscle increases in length and width in order to grow with the
Gollbkadder Ventrol poncreos Stomach
\
Fig. 1.1.1 Dorset poncreotic duct pancreas Common bite duct ..Ventral pancreas Ventral pancreotic duct Accessory pancreatic duct (Sontorini) Main pancreotic duct (Wirsung)Development of pancreas in human embryo during the fourth to sixth week of gestation. A. Formation of the dorsal and ventral pancreatic primordia. B.
Rotation of the ventral primordium. C. Fusion of the primordia and formation of the definitive ducts. The contribution of the ventral primordium is shaded.
(From Gray, S.W., Skandalakis, J.E. and Skandalakis, L.J. In: Surgical diseases of the pancreas, pp. 37-45, 1987).
Table 1.1.1 Morphological development of human exocrine pancreas
Event Developmental age (weeks) Dorsal and ventral anlagen detectable 5
Fusion of anlagen 7
Differentiation of endocrine and exocrine tissue 12-14
Lobules and acini formed 14-16 Polarity of acinar cells established 20
Zymogen granules present 20-22
Adult appearance of gland (histological) 40
Table 1.1.2 Functional development of human exocrine pancreas
Event developmental age
Zymogens detectable in pancreatic homogenates 20 weeks Lipase detectable in pancreatic homogenates 24 weeks Enterokinase detectable in intestinal content 26 weeks
Response to secretagogues 1 month (postnatal) Amylase detectable in pancreatic homogenates 2 months (postnatal)
1.2 SIGNAL TRANSDUCTION PATHWAYS AND CELL PROLIFERATION
Cell proliferation is controlled by a large variety of stimulative or inhibitory signals
mediated through specific receptors on the cell surface. One class of receptors consists of transmembrane surface receptors with intrinsic tyrosine kinase activity, some of which bind
polypeptide growth factors such as IGF-I, EGF and FGF (Geer and Hunter, 1994). The
second class of receptors consists of G protein-coupled receptors interacting with different
intracellular signalling systems (e.g. phospholipid breakdown, adenylyl cyclase, ion channels)
and bind different hormones, such as thrombin, serotonin and bombesin (Strader et al., 1994). These two classes of receptors are tightly interconnected.
Signal transduction by receptors with ligand-dependent tyrosine kinase activity
Polypeptide growth factors represent a group of extracellular signals that are critically important for influencing a diverse array of cellular responses including proliferation, differentiation and cell survival. The effects of many growth factors are mediated by high-affinity tyrosine kinase receptors (Geer and Hunter, 1994). Ligand binding to receptor
tyrosine kinase results in dimerization of adjacent receptor monomers and activation of tyrosine kinase phosphorylation, a process termed autophosphorylation. Receptor
autophosphorylation acts as a switch to induce the binding of cytoplasmic signal proteins to
the receptor. These signalling molecules mediate the cellular responses to growth factors. Over the recent years, several tyrosine kinase substrates and cell mediators have been
identified, including phospholipase €-7 (PLC-7), phosphoinositide-3-kinase (PI-3K), insulin-receptor substrate (IRS-1) and GTPase-activating protein (GAP) modulating c-ras
proto-oncogene function (Pawson, 1992). All these tyrosine kinase substrates contain specific
protein sequences Src homology 2 domains or Src homology 3-like region (SH2 or SH3 domains) which allow them to associate with specific tyrosine phosphorylated sites on
receptor proteins.
PLC activation is a common feature in the mechanism of action of a wide variety of growth factors and mitogens. Several PLC isozymes can mediate this step. G-protein coupled receptors activate PLC-|8, while tyrosine kinase receptors other than insulin and IGF-I
receptors utilize PLC-7 as a substrate. Hydrolysis of the PLC substrate phosphatidylinositol 4,5-bisphosphate (PIP2) produces two second messengers, diacylglycerol (DAG) which activates protein kinase C (PKC), and inositol 1,4,5-trisphosphate (IPS) which mobilizes
intracellular stored calcium.
PI-3-kinase is another tyrosine kinase receptor substrate involved in phosphoinositide
metabolism. PI-3-kinase phosphorylates phosphatidylinositol at position 3 of the inositol ring
to produce PI-3-P (which is not a substrate for PLC). PI-3-P is an important mediator of signal transduction, linked to several biological actions during growth factor stimulation.
IRS-1 is the principal substrate of insulin and IGF-I receptor tyrosine kinases (Myers et al., 1994). The activated receptor physphorylates IRS-1 and SH2 containing proteins bind to IRS-1. IRS-I contains a pleckstrin homology (PH) domain which mediates the interaction
domain from IRS-1 impairs insulin signalling in a background of low insulin receptor
expression. IRS-1 mediates cellular mitogenesis during stimulation with insulin and IGF-I. Overexpression of IRS-1 in Chinese hamster ovary cells, which contain only a few
endogenous insulin receptors, doubles the maximal response of thymidine incorporation during insulin stimulation (Sun et al., 1992).
Many studies have suggested that ras plays a key role in signal transduction and control of cellular proliferation (Marshall, 1995). Ras is active in the GTP-bound form and inactive in the GDP-bound form. The GTPase activity of ras is enhanced by GTPase-activating protein (GAP) and neurofibromatosis type I protein (NF-I). Various growth factors
stimulate the formation of GTP-ras, thus coupling the signals from the cell surface to the downstream kinase cascade. There are several ras target proteins such as Raf, MEKK1 and
PI3-K. Active Raf phosphorylates the MEK protein kinase on serine, which results in its activation. MEK (also known as MAP kinase kinase MAPKK) is a dual specificity threonine/tyrosine kinase that phosphorylates and activates mitogen activated protein kinase (ERK/MAPK). Although the end results ofERK substrate phosphorylations are diverse, the most significant effects on cellular proliferation are probably caused by the increased
transcriptional activity of the AP-1 complex, resulting from increased expression of fos
(Marais et al., 1993). ERK/MAPKs activation through Raf is the predominant ras effector pathway. MAPK functions as a key molecule in signalling processes. Active MAPK may be responsible for triggering S6 kinase and casein kinase II and may also participate in the
the Na/H antiporter.
Other cytokines and growth factors function by interacting with receptors that are members of the cytokine receptor superfamily (Schindler, 1995). These receptors share the same extracellular motifs and have limited similarity in their cytoplasmic domains. Although
lacking catalytic domains, in contrast to tyrosine-kinase receptors, this family of receptors
couples ligand binding with the induction of tyrosine phosphorylation. Recent studies have shown that this is mediated by members of the Janus kinase (JAK) family of cytoplasmic protein tyrosine kinases (Inglese et al., 1995). Binding of a cytokine induces receptor oligomerization and activation ofJAKs. The activated JAK subsequently phosphorylates both
receptor and cellular substrates, which include members of the signal transducers and
activators of transcription (STATs) family of transcription factors. Following phosphorylation, the STATs form dimers through SH2 domain-dependent intermolecular association with carboxyl sites oftyrosine phosphorylation. Dimerization triggers dissociation
from the receptor complex and translocation to the nucleus. In the nucleus, the STAT dimers bind response elements and are generally associated with the activation of gene expression.
Signal transduction through G protein-coupled receptors
Many hormones, neurotransmitters and vasoactive agents transmit signals by
interacting with specific G protein-coupled receptors (Strader et al., 1994). A ligand-occupied receptor induces the exchange of GDP for GTP in specific G proteins. An active G protein is a heterotrimer containing a,|8 and 7 chains. Upon activation by ligand binding,
this complex dissociates into a separate a subunit carrying the GTP and a ^7 complex. The a subunit will interact with effector enzymes, stimulating or inhibiting them. Several effector enzymes controlled by G proteins have been described, including adenylate cyclase (AC) and phospholipases C-|8, D and A2 (PLC-^, PLD and PLA2). AC is the enzyme that synthesizes
cAMP from ATP and is linked to G protein receptors. cAMP as a second messenger exerts
its effect by activating cAMP-dependent protein kinase-A (PKA). Another effector enzyme, PLC-j8, hydrolyses PIP2 into two second messengers IPS and DAG, leading to transient rise in cytoplasmic Ca++ levels and protein kinase C (PKC). In addition, receptor-mediated activation of PLD and PLA2 leads to hydrolysis of phosphatidylcholine into DAG and free fatty acids. A growing body of evidence now supports the idea that the 187 subunit can itself interact functionally with effector proteins. It has been reported that the 187 subunit can stimulate PLC^, phospholipase A2 (PLA2) and PI3-kinase activities and participate in the inhibition of AC. Recent studies have shown that the ^7 subunit may even provide a way to link G proteins to receptor tyrosine kinase (RTK) initiated cascades (Inglese et al., 1995). This connection may be mediated by 6,3 alone or by a PH domain-directed binding, leading
to ras activation. RTK activation (for example, by epidermal growth factor, EGF) also
activates ras through the recruitment (directed by the SH2 and SH3 domains) of the
cytoplasmic proteins Grb2 and Sos 1. The convergence of these two different surface-receptor signalling pathways on ras activation, in turn, leads to the sequential activation of the raf-1-MAPK cascade.
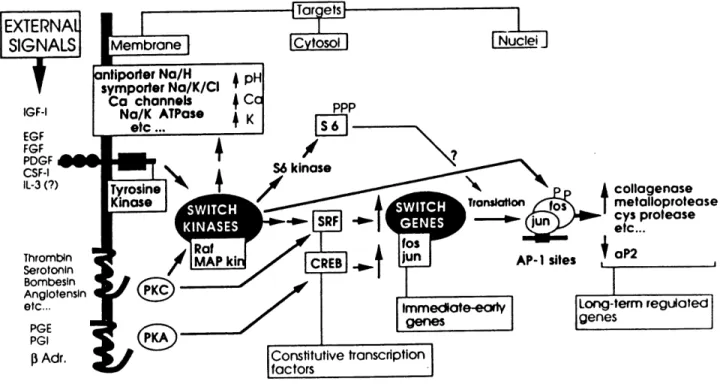
Signalling pathways from cell surface receptors to nuclei
Signalling pathways from cell surface receptors to nuclei is one of the central subject
of modern biology. Fig. 1.2.1 outlines some of the early events commonly activated in all
cell types by different promoting agents (Hill and Treisman, 1995; Pawson, 1993). Signals
through tyrosine kinase receptors and G protein-coupled receptors could converge and /or
synergise at the level of switch kinases such as serine/threonine MAP kinase and Rafkinase.
These kinases receive the signal from various external messengers and pass on the signals
by activating other specific protein kinases (e.g. S6 kinase) to increase protein synthesis, by activating antiporter Na/H or symporter Na/K/Cl to induce ionic change, or directly by initiating early gene transcription. This notion of switch kinases although still very
IEXTERNAI]
SIGNALS!
T
IGF-1 EGF FGF PDGF CSF-1 IL-3 (?)t
Thrombln Serotonln Bombesln Anglotensln etc... PGE PGI pAdr. Membrane antiporter Na/H symporter Na/K/CI Co channels i Ca Na/K ATPase etc... ICvtosol I Nuclei I AP-1 sites collagenose metalloprotease cys protease etc... aP2 Immedtote-earty genes Long-term regutated genes Constitutive transcription factorsFig. 1.2.1 Signalling pathways from the cell surface receptors to the nuclei (From
Pouyssegur, J., Kahan, C., Magnaldo, I. and Seuwen, K. In: Transmembrane
signalling intracellular messengers and implications for drug development, pp 119-132, 1992).
1.3 REGULATION OF TRANSCRIPTION FACTOR EXPRESSION BY SIGNAL
TRANSDUCTION PATHWAYS
Signal transduction pathways regulate nuclear transcription factors expression by
modulating their activity. The most studied members are the AP-1 (Jun/Fos) and cAMP-response element-binding (CREB) protein. Molecular cloning revealed thatAP-1 consists of a variety of different transcription factors which belong to the Fos and Jun families
(Sassone-Corsi, 1994). Serum response element (SRE) and 12-0-tetradecanoyl-phorbol-13-acetate (TPA) response element (TRE) mediate c-Fos and c-Jun expression respectively, induction
by growth factors, cytokines and other stimuli that activate MAPKs. CREB mediates transcription in response to the cAMP-dependent protein kinase A (PKA) signal transduction pathway and controls gene expression by binding to the cyclic AMP (cAMP) response element (CRE) (Bundle and Montminy, 1992).
Altered DNA-binding and activation
Many transcription factors bind DNA as dimers either of homodimeric or
heterodimeric nature (Kerr et al., 1992). There are several different types of
sequence-specific DNA-binding domains, such as zinc finger, leucine zipper/basic DNA-binding domains, helix-loop-helix (HLH) and helix-turn-helix. All members of the CREB and AP-1
families are leucine zipper containing proteins. Induction of Fos transcription results in increased synthesis of Fos proteins which combine with pre-existing Jun proteins to form
AP-1 heterodimers through leucine zipper motifs, in such a way that they bind DNA more stably and thereby increase the level of AP-1 activity.
Signalling pathways regulating transcription factors by phosphorylation
Regulation of transcription factor activity is mostly by phosphorylation events (Hunter, 1995). Three different types ofMAPKs, the extracellular signal-regulated protein kinases (ERKs), the c-Jun NH2-terminal kinases (JNKs) and the Fos-regulating kinases (FRKs) contribute to induction of AP-1 activity through phosphorylation of different substrates that potentiate their transcriptional activities. JNK-mediated phosphorylation of ATF2 and c-Jun bound to the c-Jun promoter (TRE) stimulates their transcriptional activities, leading to c-Jun production. Phosphorylation by ERK of the serum response factor (SRF)
and its accessory ternary complex factor (TCP) Elk-1 bound to the c-Fos promoter serum
response element (SRE) stimulates its transcriptional activity, thus leading to c-Fos induction.
The newly synthesized c-Fos and c-Jun proteins combine to form stable AP-1. A further
increase in AP-1 activity is brought about by the JNK and FRK which phosphorylate c-Jun
and c-Fos, respectively, on sites that increase their transcriptional activities. As mentioned earlier, activation of PKA depends on increases in cAMP generated at the plasma membrane
as a result of activation of adenylate cyclase by G protein-coupled receptors or other signal
transduction pathways. One of the major nuclear PKA substrates is the transcription factor
CREB. The PKA C subunit phosphorylates a single serine, Ser-133. This phosphorylation results in increased transactivation activity, without a significant effect on CREB
DNA-binding activity. Phosphorylation ofSer-133 promotes DNA-binding of the CREB-DNA-binding protein (CBP), a large protein with an activation domain that can interact with TFIIB (Chrivia et al.,
1993).
Transcription factors can be sequestered in an inactive form in the cytoplasm.
Phosphorylation of the factor itself or a cytoplasmic anchor protein allows translocation of
the transcription factor into the nucleus. One example of phosphorylation-regulated nuclear
translocation is provided by the Rel family of transcription factors which includes NF-/cB (Hunter and Karin, 1992). NF-/cB is activated in many different cell types following a stimuli. In unstimulated cells, the majority of the NF-/cB p50/p65 proteins is retained in the cytoplasm, through binding to I/cB inhibitor proteins. I/cB proteins mask the DNA-binding activity of NF-/cB and control the nuclear uptake of associated DNA binding proteins.
Following stimulation with TPA, the NF-/cB complex translocates to the nucleus in an active form. External stimuli activate several protein kinases such as PKA or PKC which can
induce the phosphorylation of I/cB. This phosphorylation leads to dissociation of I/cB from the NF-^B complex and to the unmasking of the DNA-binding domain. This is followed by
translocation to the nucleus where NF-/cB binds to /cB sites to activate transcription of target
genes.
The DNA binding activity of nuclear transcription factors can be modulated by phosphorylation either positively or negatively (Luscher et al., 1990). One example of negative regulation by phosphorylation is the c-myb protein. Phosphorylation of c-myb by casein kinase II (CKII) results in a large decrease in DNA binding activity. Another example
is c-Jun. In non-stimulated cells, c-Jun is present in a form that is phosphorylated on sites
that inhibit DNA binding activity. In response to cell stimulation with growth factors, c-Jun undergoes dephosphorylation of these sites and its DNA binding activity increases (Boyle et
al., 1991).
Phosphorylation can affect the interaction of transcription factor transactivation
domains. Transcription factors are usually composed of separable DNA-binding and transcriptional activation domains. In most cases, phosphorylation effects on transactivation
are of positive control. As shown earlier, PKA regulates CREB activity by phosphorylation
of its activation domain at Ser-133. c-Myc is an example of a transcription factor whose
transactivation function is stimulated by phosphorylation. Ser-62 is a MAP/ERK kinase
phosphorylation site in human c-Myc and is stimulated by growth factors treatment.
Regulation of transcription initiation by RNA polymerase II (pol II)
Regulation of transcription initiation is by far the most widespread form of gene
control ineukaryotes (Hernandez, 1993). Such control results in the response to extracellular
signals, leading to changes in levels of specific mRNAs and their translation products. In
eukaryotes, initiation is governed by DNA sequence elements comprising several functional classes. Core promoter elements contain binding sites for general transcription factors leading
to recruitment of RNA pol II and control the location of transcription initiation sites. Upstream promoter elements and enhancers regulate the rate at which RNA pol II initiates
been identified and extensively purified. Among these factors, only TFIID contains a DNA binding activity with specificity for the TATA box. The others and RNA pol II enter the
transcription complex by protein-protein interactions. The largest subunit of RNA pol II
contains a C-terminal domain (CTD). Hypeq)hosphorylation of the CTD blocks incorporation of pol II into the initiation complex.
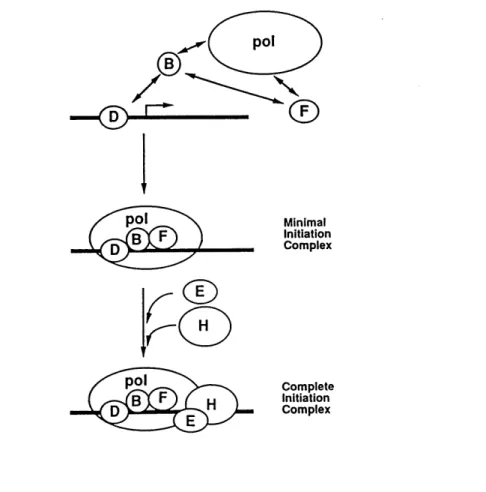
Initiation of transcription by RNA pol II requires the formation of a complex containing the basal factors TFIID, TFIIA, TFIIB, TFII E/F, TFIIH, TFIIJ and RNA pol II (Buratowski, 1994) (Fig. 1.2.2). The first step in the assembly of the initiation complex is binding of TFIID (the TATA box binding protein (TBP) and associated factors) to the
TATA element. It provides a recognition site for the association of the other general
transcription factors and pol II. TFIIA promotes stable binding of TFIID to the core promoter and has been shown to bind stably to TATA box binding protein (TBP). TFIIB binds directly to the TFIID-DNA complex and serves as a bridge for the recruitment of RNA pol II linked to IIP into the initiation complex. However, with purified factors TFIIA
appears not essential for basal transcription. It does function to establish and maintain the committed complex under more physiological conditions.
The formation of the DB-polF or DAB-polF complex leads to the association of the remaining factors (TFIIE, TFIIH, and TFIIJ) required for basal transcription. The function
ofTFIIE is not clear, butTFIIE incorporation appears necessary for subsequent recruitment
of TFIIH. TFIIH possesses a kinase activity that is capable of phophorylating the CTD of pol II. The CTD is in a non-phosphorylated (Pol IIA) form in the preinitiation complex
where it is engaged in an interaction with TFIID. RNA pol 110 is the phosphorylated form
found in the elongation complex. Thus, each transcription cycle may be associated with the
reversible phosphorylation of the CTD. The subsequent phosphorylation of the CTD is thought to be a key step in the progression from an initiation complex to an elongation complex. TBP interacts only with the nonphosphorylated form of RNA pol II which is the form known to enter the initiation complex. In addition to interacting with the general transcription factors, TBP interacts with several factors termed negative cofactors (NC)1,
NC2, and Drl. These factors have a negative effect on core promoter function and interfere
with the binding of TFIIA. Thus, phosphorylated Drl can associate stably with TBP on a TATA box and displace TFIIA. Transcription of protein-coding genes can be stimulated by
transcriptional activators, sequence-specific transcription factors such as stimulated protein
1 (SP1), upstream stimulator factor (USF), AP-1 and CREB. As stated earlier, these factors contain two principal domains (1) a sequence-specific DNA-binding domain and (2) an activation domain which allow them to stimulate transcription synergistically in combination with other activators. Transcription initiation is thought to be one of the targets of these
regulatory proteins.
Regulation of mRNA stability
The control of mRNA stability is important in determining the levels of gene expression during cell growth (Ross, 1995; Beelman and Parker, 1995). Recent studies have defined several mechanisms of regulation of RNA stability.
The general mRNA decay pathway is initiated by shortening of the poly (A) tail followed by decapping and 5' to 3' exonucleolytic degradation of the transcripts. Messenger RNAs lacking the cap structure are rapidly degraded in many eukaryotic cells. A variation of this pathway has been observed in which transcripts undergo 3' to 5' decay after poly (A) shortening. Messenger RNA decay can also be initiated by decapping followed by 5' to 3' decay of the transcript independent ofpoly (A). Degradation ofmRNAs containing nonsense
codons is part of a process termed mRNA surveillance, that ensures the rapid degradation of aberrant transcripts.
Another possible pathway leads to decay of unstable mRNAs through a S'-AU-rich instability determinant binding some cytoplasmic factors (Ross, 1996). Many transcription
factors (c-fos, c-myc) and cytokines as well contain such elements regulated by different
signal transduction pathways. The AU-rich elements (ARE)s and their associated proteins interact with poly (A)-binding protein (PABP), forming a bridge between the ARE and the poly (A) tail. It has been shown that PABP in association with the poly (A) tail protects the 3' end of mRNAs from nuclease attack. An association between PABP and the ARE might allow PABP to be released from the poly (A) tail. The poly (A) tail might then be susceptible to complete degradation. It is suggested that the AU-rich sequences may play a role in nuclear export or nuclear mRNA decay as well as in cytoplasmic mRNA decay. A family of ARE-binding proteins (AUBPs) has been described. Some are primarily cytoplasmic,
while others are nuclear or shuttle between both compartments. Several observations suggest
or decreases as mRNA decay rates change.
Some unstable mRNAs such as Fos and myc mRNAs contain a coding region
instability determinant (GRID) (Schiavi et al., 1992). Ribosomes may carry associated factors involved in mRNA decay. The movement of ribosomes across the GRID sequence may alter the ribosome and /or associated factors. This alteration may lead to rapid and complete digestion of the poly (A) tail. Once the poly (A) tail is removed, the transcribed portion of the mRNA is rapidly degraded.
Minimal Initiation Complex Complete Initiation Complex
Fig. 1.2.2 Schematic model of transcription initiation complex assembly (From
PART B: GENERAL INTRODUCTION TO THE PROJECT
1.4 GENE EXPRESSION AND BIOLOGICAL ACTION OF INSULIN-LIKE GROWTH
FACTORS (IGFS), EPIDERMAL GROWTH FACTOR (EGF) AND BASIC
FIBROBLAST GROWTH FACTOR (bFGF) DURING DEVELOPMENT
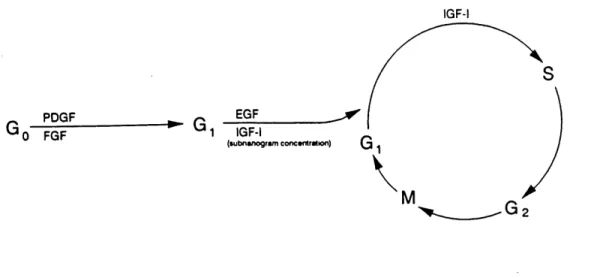
All cells in the body are derived from a fertilized egg. In order to reproduce and
multiply, every cell must undergo an orderly series of events, generally called the cell cycle
(Fig. 1.4.1). The full mature cell is said to be in Go phase (G stands for gap). At this stage, the cell is not committed to division. G is the decision phase in which cells either commit to undergo another round of DNA synthesis (S phase) and continue to cycle, or to exit the
cell cycle to enter a quiescent stage, referred to as Go phase. When DNA synthesis is
completed, cell normally proceed to G2 which is a short period where some protein synthesis
occurs. During this time, cells prepare to enter into mitosis (M phase).
Control of cell proliferation is a result of coordinated regulation of multiple biochemical pathways that integrate both intracellular and extracellular signals. A number
of hormones are essential to normal body growth such as somatotropin and insulin. During the last decade, it was found that some growth factors, such as insulin-like growth factor I
and II (IGF-I and II), epidermal growth factor (EGF), and fibroblast growth factor (FGF) are mitogenic polypeptides. Although the ontogeny and targets of IGF, EGP and bFGF
actions are largely unknown, these growth factors are considered important for cellular differentiation and growth.
IGF-t
PDGF
0 FGF ' 1 IGF-IEGF . ^^
(lubnanogrwn conctntralion) Q
\
Fig. 1.4.1 Illustration of some growth factors involved in the cell cycle at different phases
(From Lowe, W. L. Jr. In: Insulin-like growth factors: Molecular and cellular aspects, pp. 49-85).
1.4.1 Insulin-like growth factor I and II (IGF-I and -II)
IGF-I and IGF-II are non glycosylated single-chain peptides with three intrachain disulfide bridges consisting of 70 (7.6kDa) and 67 (7.5kDa) amino acids, respectively (Daughaday and Rotwein, 1989). The mature molecule of IGF-I contains four domains, an N-terminal B region followed by C, A and D domains (Foyt and Roberts, 1991). The B, C
and A domains are structural homolog of proinsulin. The IGF-I prohormone has an
additional E domain which varies in length due to alternative splicing of the primary
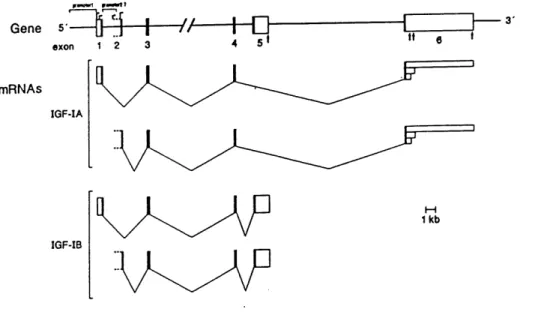
nearly 70 kb of chromosomal DNA (Kim et al., 1991; Fig. 1.4.1.1). Several transcription start sites were identified within IGF-I exons 1 and 2, adjacent to distinct promoters
upstream of exons 1 and 2, respectively, and at least three polyadenylation sites were mapped to exon 6. Genomic DNA encoding the 5' region of the porcine IGF-I gene was
cloned and sequenced and shown to be highly homologous to that of man, rats and sheep (Weller et al., 1993). The primary transcript of the IGF-I gene can be alternatively spliced to result in two mRNAs encoding either precursor proteins IGF-Ia or IGF-Ib differing in their carboxy-terminal amino acid extensions. Although the biological activities generated
from these alternative precursors have yet to be determined, alternative RNA splicing may
provide a mechanism for regulating IGF-I biosynthesis and subsequent function. A 40 kb
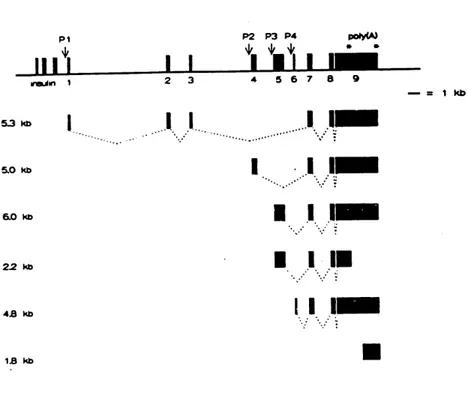
single gene encoding human IGF-II contains 9 exons which are transcribed from four promoters. In addition there are two polyadenylation sites (Sussenbach et al., 1991; Fig.
1.4.1.2). The mature IGF-II polypeptide is encoded by exons 7, 8 and part of 9. Promoter
1 (Pl) is thought mainly expressed in adult liver required for transcription of leader exons 1, 2 and 3, whereas homologue of Pl is absent in the rat and mouse gene (Ikejiri et al. 1990; Rotwein and Hall, 1990). Therefore, in contrast to the rodent liver, in which IGF-II
expressed is repressed to zero after birth, expression of IGF-II in human liver persists
postnatally. Initiation of transcription at these various sites and alternative RNA splicing can
generate alternate mRNA species. For both IGFs genes, the use of different promoters contributes at least in part, to the observed developmental and tissue specific patterns of IGFs gene expression.
»«mn »—t)
Gene 5-—F}—|—//—h
exon 123 45 mRNAs IGF-IA IGF-IB 1kbFig. 1.4.1.1 Structure and expression of the human IGF-I gene. An overview of the human
IGF-I gene organization and its different mRNAs is presented. Exons 1-6 are indicated by boxes, with coding regions in black and noncoding regions in white. Promoter 1 and putative promoter 2 are labelled on the gene. Not all
transcription start sites have been drawn on the map. Since the 5'-end of exon
2 has not been established with certainty, it has been left open. Sites of pre-mRNA processing are indicated by thin lines. Polyadenylation sites are marked by vertical arrows in the gene and by box of varying length at the
3'-end of the mRNAs (From Kim, S.W., Rosemarie, L and Rotwein, P., Mol.
Pl P2 P3 P4 po»y<A» <k
un
ma^m 1 23 456789 = 1 kb &okb I I 11 6.0 kb j| 22 Kb B I11 11
1B kbFig. 1.4.1.2 Structure of the human IGF-II gene organization and mRNAs species. The
gene consists of 9 numbered exons, 4 promoter sites indicated by the arrows (P 1-4). The asterisks show two alternative polyadenylation sites. Initiation of transcription at Pl, which is mainly active in adult liver, generates an IGF-II mRNA of 5.3 kb. The mature IGF-II polypeptide is encoded by exons 7, 8
and part of 9 (From Sussenbach, J.S., Steenbergh, P.H., Hansen, E., Meinsma, D., van Dijk, M.A., Holthuizen, P., de Moor, C.H., Jansen. M. and Van den Brande, J.L. In: Modern Concepts of Insulin-like Growth
IGFs during development
IGF-I and -II are potent mitogenic growth factors which are capable of inducing cell proliferation and differentiation (Lowe, 1991). Transgenic mice for IGF-I exhibited an increased level ofIGF-I with an increase body weight (Mathrew et al., 1988). Conversely, embryonic mice with inactive IGF-I gene were significantly smaller than their normal litters (Powell-Braxton et al., 1993). They have severe muscle dystrophy and the majority of these mice die at birth. Mice lacking a functional IGF-II gene were viable but are 60 % of the size of wild-type litter mates (de Chiara et al., 1990). These observations suggest an important
role for IGF-I and -II in promoting both pre- and postnatal growth.
Developmental and tissue specific pattern of IGFs expression has been characterized with the rat model (Hogg et al., 1994; Brown et al., 1986; Rotwein et al. , 1987). Both IGF-I
and -II mRNAs were detectable in rat embryos as early as 11 days (Rotwein et al., 1987). Over the gestation period, IGF-II transcripts were more abundant than IGF-I. Brown et al.
(1986) found that IGF-II mRNAs were present in multiple tissues such as liver, kidney and
muscle from the fetal to postnatal period. In the fetal rat, IGF-II mRNA was found to be abundant in most tissues including liver, intestine, lung and brain but decreased markedly
at birth in all tissues except in the brain (Lund et al., 1986). During postnatal life, a decrease in IGF-II mRNA levels corresponded to a decrease in circulation levels of IGF-II (Moses et al., 1980). In the rat, IGF-I mRNA was higher in most fetal tissues, with the exception of liver where IGF-I mRNA level was higher in the adult (Lund et aL, 1986), paralleling an increase in plasma IGF-I level (Donovan et al., 1989). Han et al. (1988) found that IGF-I
and II mRNAs were present in human fetal tissues such as pancreas, liver, kidney and muscle at 16 to 20 weeks of gestation. The same authors reported that IGF-II mRNA was
present in greater quantities than that of IGF-I in most tissues during early fetal life. Similar to rat, human adult liver expressed higher IGF-I mRNA than fetal liver (Han et al., 1988). In ovine, the level of IGF-II mRNA was high in various tissues from early gestation and decreased with maturation (O'Mahoney et al., 1991). In the pig, IGFs mRNA levels were also detected in multiple tissues during the fetal life (Lee et al., 1993). Messenger RNA for IGF-I was most abundant in the skeletal muscle and least abundant in the liver, showing that
expression of IGF-I and -II are tissue and developmentally regulated.
IGFs are released from many cell lines in culture and synthesized in various tissues (Rutanen and Pekonen, 1990). Tissue IGF-I has been detected in the rat (D'Ercole et al.,
1980), the human (D'Ercole et aL, 1986) and the pig (Hausman et al., 1991). Multiple tissues express IGF-I peptide including liver, kidney and muscle, suggesting an autocrine and
/or paracrine role of IGF-I during development. Changes with age in circulating concentrations of IGFs have been characterized in humans (Ashton et al., 1985; Bala et al.,
1981) rats (Donovan et al., 1989) and pigs (Lee et al. 1991). In humans and rats, IGF-I
serum concentrations are low around birth, but rise postnatally (Ashton et al., 1985; Bala
et aL, 1981; Donovan et al., 1989). Concentration of IGF-II in rat was high prenatally and declined rapidly after birth (Moses et al., 1980), whereas, in humans, it was low prenatally and increased after birth (Enberg and Hall, 1984). Serum IGFs pattern in the pig is similar to human but different from that in the rat. In the pig, IGF-II concentration was higher than
IGF-I and both increased during development (Lee et al., 1991). All these findings suggest
that IGFs produced by the tissues and present in the serum act as important regulators of animal growth and development.
IGF receptors during development
The biological effects of IGFs are mediated through binding to high affinity receptors on the cell surface (Werner et al., 1991). Targeted disruption of the IGF-I receptor gene
resulted in growth-retarded mouse embryos (Liu et al., 1993). In fact, growth was retarded
to about 70 % of that seen in normal mouse embryos, strongly suggesting that the IGF-I receptor plays a major role in embryonic growth. Receptors of IGF-I are distributed in the majority of tissues and cells (Rechler and Nissley, 1985). Two types ofIGF receptors, based
on their relative affinities for IGF-I, IGF-II and insulin, have been identified (Werner et al.,
1991; Nissley et al., 1991). The type I receptor, like the insulin receptor, is a glycoprotein with a molecular weight between 300 kDa and 350 kDa which consists of two extracellular a-subunits (»130 kDa) and two |8-subunits (» 95 kDa) containing a transmembrane and a
tyrosine kinase domain (Werner et al., 1991). In the mature receptor, two a and ^ chains
are joined by disulfide bonds. The type I receptor shows both structural and functional similarities with the insulin receptor and has high affinity for IGF-I and IGF-II, but a much lower affinity for insulin. The signal transduction is thought to be mediated by activation of
the tyrosine kinase domain. By contrast, the type II receptor is a monomeric, transmembrane
250 kDa protein with a short cytoplasmic domain that lacks kinase activity (Nissley et al., 1991). The type II receptor has no structural homology with insulin or type I receptor. It is
identical to the cation-independent phosphate receptor which directs
mannose-6-phosphate-containing proteins to lysosomes. IGF-II binds with high affinity to type II receptor while IGF-I binds less avidly, and insulin does not bind at all to the type II
receptor. It has become increasingly clear that type I receptor mediates most of the well known biological effects of both IGF-I and -II. The role of type II receptor in IGF-I or -II-mediated transmembrane signalling is still obscure. In addition to the above receptors,
another receptor named IGFII-XR has been tentatively identified from placenta. Lack of this receptor results in reduced placental growth (Baker et al., 1993).
In the rat, levels of IGF-I and -II receptor mRNAs were determined in various tissues
from late fetal to early postnatal development (Werner et al., 1989; Sklar et al., 1992). The IGF-I and -II receptor mRNA levels were high in multiple tissues of fetuses and decreased to much lower levels during postnatal life (Werner et al., 1989; Sklar et al., 1992). The
IGF-II receptor is present and expressed in a variety of human tissues including pancreas,
liver and stomach (Funk et al., 1992). The highest amount of IGF-II receptor was detected
in kidney, heart and thymus and the lowest receptor content was measured in muscle and brain. In the pig, it was found that at day 20 of pregnancy, IGF-I receptors were present in the placenta, but only in endometrial cells (Chastant et al., 1994). In contrast, IGF-II receptors were detected on whole embryos from day 8 of pregnancy (Chastant et al., 1994).
The variable amounts of IGF receptors present in different tissues make them likely candidates for regulatory processes that might be involved in organ and tissue growth and
IGF binding proteins during development
In the circulation and body fluids, IGFs are bound to specific proteins which are synthesized in the liver and in other tissues (Clemmons, 1991). To date, six forms of IGF binding proteins (IGFBPs) that range in size from 24-45 kDa have been identified. Their cDNAs have been cloned and designated IGFBP-1 to -6 (Shimasaki and Ling, 1991). The predominant binding protein in serum of adult rat and human is IGFBP-3, which binds 95
% of endogenous IGF-I (Jones and Clemmons, 1995). IGFBP-1 has a similar affinity for IGF-I and IGF-II, while IGFBP-2 and IGFBP-3 have greater affinity for IGF-II and IGF-I respectively. The function of these proteins is not completely understood. It is hypothesized that the IGFBPs (1) act as transport proteins in plasma to control the efflux of IGFs from the vascular space, (2) serve as reservoir for IGFs prolonging the biological half-life of the IGFs (3) provide a means of tissue- and cell type-specific localization (McCusker and Clemmons, 1992). In the extracellular fluids, IGFBPs can alter the IGF-I and II binding capacity to
receptors on the surface of intact cells (Jones and Clemmons, 1995). It has also been
suggested that the IGFBPs function as major modulators of IGF action either as inhibitors
(Frost et aL, 1993) or enhancers (Conover, 1992). Transgenic mice overexpressing human
IGFBP-3 resulted in a liver, spleen and heart significantly heavier than that of normal mice (Murphy et aL, 1995). Transgenic mice that overexpressed rat IGFBP-1 had a significant reduction of 83-92% of the body weight (Rajkumar et al., 1995). The authors also found that the difference in body weight between transgenic and wild-type mice was most apparent
retardation. In addition, the transgene was highly expressed in brain, uterus, lung, kidney
and heart, but little expression was detected in the liver, thus showing that IGFBPs may function to inhibit IGFs action in vivo and this inhibition selectively impairs development of
specific organs.
Messenger RNAs of IGFBPs and their proteins were detected in various tissues during development (Clemmons, 1991). During the postnatal life in rat, IGFBP-3 mRNA was expressed in a large number of tissues (Albiston and Herington, 1992). The kidney had the greatest amount of IGFBP-3 mRNA with moderate mRNA levels in liver, stomach and
placenta. IGFBP-1 mRNA was present in many human fetal tissues, such as liver, gut,
kidney and lung (Hill et aL, 1990). Like IGFs, IGFBPs are also subject to different
developmental and tissue-specific regulation. In rat, levels of both IGFBP-1 and -2 mRNAs
were the highest in liver, with abundant IGFBP-2 mRNA present in fetal kidney, stomach and brain (Ooi et aL, 1990). Similar to rat, IGFBP-2 mRNA levels in ovine tissues were high in early gestation and decreased with maturation thus following the same pattern of expression as IGF-II (Delhanty and Han, 1993). Multiple isolated human fetal tissues release IGFBPs in vitro including fibroblasts and myoblasts (Hill et al., 1989), liver explants (Lewitt and Baxter, 1989), and pancreas explants (Hill et al., 1987). The immunopositive staining
for IGFBP-1, -2 and -3 was found in many human fetal tissues, being prominent in kidney,
pancreatic endocrine tissue and skeletal muscle fibres (Hill and Clemmons, 1992), supporting the idea that IGFBPs might exert differential effects in various tissues during development
postnatal life, the liver IGFBP-3 mRNA expression and serum IGFBP-3 concentrations increased with serum IGF-I levels (Lee et al., 1991; Kampman et al., 1994). These data suggest that mRNA levels as well as tissue and serum concentrations of IGFBPs are
influenced by age. The IGFBPs are present in multiple tissues and serum, implying that IGFBPs are important in regulating IGFs actions.
Biological action of IGF-I and IGF-II
The two main biological actions of the IGFs may be summarized as insulin-like metabolic and growth promoting actions. With the use of primary cell culture or organ explants, it has been demonstrated that both IGF-I and IGF-II stimulate glucose uptake, glycogen and lipid synthesis in adipose tissue and stimulate cell proliferation and differentiation (Froesch et al., 1985; Lowe et al., 1991). Anabolic effect of IGF-I in rats was reported by Tomas et al. (1993) who observed that administration of IGF-I over a 14 day
period to growing rats led to an increased body weight gain, an improved nitrogen retention and a greater food conversion efficiency. IGF-I is though to mediate many of the
physiological actions of GH on somatic growth (Copeland et al., 1980). Transgenic mice expressing GH exhibited increased whole body growth rate after IGF-I gene expression was induced (Mathrew et al., 1986). Targeted mutagenesis of the genes encoding IGF-I and -II demonstrated the importance ofIGFs in the growth process (Baker et al., 1993). The authors
conclude that IGF-I, a previously known mediator of postnatal GH action, is also involved
to be restricted to the period of embryogenesis in the mouse (de Chiara et al., 1990). However, Wolf et al. (1994) found that postnatally elevated IGF-II in transgenic mice displayed increased kidney, testicles and adrenal weight at the age of 4 to 12 weeks although body growth was not significantly changed.
IGFs and pancreas Specific receptors for IGF-I have been detected on rat pancreatic cells
and murine acinar tissues (Williams et al., 1984; Miettinen et al., 1993). Messenger RNAs of IGFs and IGFBPs were detected in rat pancreas (Hogg et al., 1994). Other studies have
shown that cultured fetal and neonatal rat islets and human fetal pancreatic explants release immunoreactive IGF-I (Scharfmann et al., 1989; Romanus et al., 1985; Hill et al., 1987) and IGF-II (Bryson et al., 1989) into the medium. By immunohistochemical localization, IGF-I was reported in A cells whereas IGF-II has been observed exclusively in B-cells in man, dog
and rat (Maake and Reinecke, 1993). Recently, Hayakawa et al. (1996) reported that following 95% pancreatectomy, gene expression of IGF-I and IGF-I peptide level was
rapidly induced in the remnant pancreas. The authors suggested that the newly synthesized
IGF-I may stimulate ornithine decarboxylase (ODC), which is an early event in cell
proliferation, inducing DNA replication and tissue regeneration. These observations suggest
that IGFs may be involved in pancreatic growth and development.
IGFs and liver The liver is believed to be the main producer of circulating IGF-I in adult rats and human (Daughaday and Rotwein, 1989; Scharf et al., 1995). It is also an important
source of circulating IGFBPs in the rat (Daughaday and Rotwein, 1989). Both IGF-I and -II are expressed in liver of rat (Zarrilli et al., 1992; Streck and Pintar, 1992) and pig (Lee et
al., 1993). It has also been observed that IGF-I receptors are present in the rat liver (Santos et al., 1994). During development, binding ofIGF-I to liver membranes is 4.5 times higher
in 20 day-old fetuses than in adult rats (Santos et al., 1994). It has been reported that IGFs
are involved in liver regeneration (Caro et al., 1988; Burguera et al., 1990). In fact, the number of IGF-I, IGF-II/M-6-P receptors and the level of IGF-II receptor mRNAs are
greater in regenerating hepatocytes than in normal liver cells. The [125I] IGF-II binding to
crude plasma membranes from regenerating liver was maximal 2 days after hepatectomy. This increase in binding in regenerating liver was associated with an increase in the concentration of IGF-II receptors (Burguera et al., 1990). It was also observed that gene encoding rat IGF-I and IGFBP-1 were induced in regenerating rat liver (Mohn et al., 1991). Thus, IGF-I and IGFBP-1 may interact with hepatocytes to promote liver regeneration. These studies also suggest that IGFs are important stimulators of liver growth and regeneration.
IGFs and kidney Several lines of evidence suggest that IGF-I can affect kidney growth and
renal function. Overexpression of IGF-I in transgenic mice induced kidney growth (Mathrew
et al., 1988). During development, high levels of IGFs and IGFBPs mRNAs have been detected in fetal kidney of human (Han et al., 1988; Suikkari et al., 1992) and rodent (Stylianopoulou et al., 1988; Price et al., 1995). In rat, the renal IGF-H mRNA levels rapidly decreased after birth (Stylianopoulou et al., 1988) whereas the IGF-I mRNA
increased after birth (Albiston and Herington, 1992). It was observed that the collecting duct of the kidney is a major source of IGF-I which is also produced by glomerular mesangial cells in culture (Bortz et al., 1988; Aron et al., 1989). Both IGFBPs and IGF-I are synthesized in the kidney (Aron et al., 1991). It has been shown that IGF-II receptors are
present in glomeruli and in both basolateral and brush border membranes ofproximal tubular
cells (Haskell et al., 1988). IGF-I mRNA level and peptide concentration as well as IGF-I
binding increased in the generative zone of the post-ischemic regenerating rat kidney
(Matejka and Jennische, 1992). In young male rat, unilateral nephrectomy resulted in a compensatory growth of the remaining kidney (Fagin and Melmed, 1987), where IGF-I mRNA level increased within 24 h, and remained at high level for at least 7 days. Levels of IGF-I and -II receptors and their mRNAs in whole kidney were also increased (Mulroney et al., 1992), suggesting that IGF-I has a trophic effect during kidney regeneration.
IGFs and skeletal muscle In the skeletal muscle, both IGF-I and -II exhibit a range of physiological effects that includes glucose uptake (Bevan et al., 1992), protein metabolism (Fryburg, 1994), acceleration of the rate of DNA synthesis, and enhancement of myoblast
differentiation (Rosen et al., 1993). Transgenic mice overexpressing IGF-I have myofiber
hypertrophy (Coleman et al., 1995). Messenger RNA for IGF-II has been detected in muscle of 12 day-old rat fetuses (Stylianopoulou et al., 1988). In the rat, mRNA of IGF-II receptor
was in great abundance in fetal muscle and decreased after birth, but it was still more
receptors for IGF-I is constant from birth to 4 weeks of age in the rat (Alexandrides et al., 1989). Using L6A rat myoblasts incubated with IGF-II, Bach et al. (1995) have demonstrated that IGF-II has a primary role in promoting the differentiation and growth of skeletal muscle predominatly through the IGF-I receptor (Bach et al., 1995). In addition, IGFs are believed to be involved in muscle regeneration and growth (Levinovitz et al., 1992) since during the regeneration process, levels of both IGF-I and -II mRNA as well as IGFs proteins were transiently induced. This suggests that tissue IGFs could act locally to stimulate tissue growth and /or differentiation.
1.4.2 Epidermal growth factor (EGF)
Epidermal growth factor is a 53 amino acid polypeptide with three disulfide bonds. It is a powerful stimulator of proliferation and differentiation of a variety of cell types in vitro as well as in vivo (Fisher and Lakshmanan, 1990). The EGF is initially synthesized as a large (130 kDa) precursor molecule with the mature EGF sequence located near the C-terminus (Carpenter and Wahl, 1990). The sequence shows two hydrophobic domains, one
representing a signal sequence and the other a transmembrane domain, indicating that the precursor is a transmembrane protein. The cytoplasmic domain of the precursor has no known function. The extracellular domain of the EGF precursor contains, in addition to the sequence for mature EGF, eight other EGF-like domains. The uncleaved precursor is capable
of binding to the EGF receptor and shows biological activity. Thus, pro-EGF functions not