HAL Id: hal-00527456
https://hal.archives-ouvertes.fr/hal-00527456
Submitted on 19 Oct 2011HAL is a multi-disciplinary open access archive for the deposit and dissemination of sci-entific research documents, whether they are pub-lished or not. The documents may come from teaching and research institutions in France or abroad, or from public or private research centers.
L’archive ouverte pluridisciplinaire HAL, est destinée au dépôt et à la diffusion de documents scientifiques de niveau recherche, publiés ou non, émanant des établissements d’enseignement et de recherche français ou étrangers, des laboratoires publics ou privés.
To cite this version:
Aicha Seklouli Sekhari, Abdelaziz Bouras, Denis Gien. A New Fuzzy Method for dealing with inconsis-tency - Production System Application. International Journal of Product Development, Inderscience, 2009, 7 (1/2), pp.170 - 181. �10.1504/IJPD.2009.022282�. �hal-00527456�
Copyright © 200x Inderscience Enterprises Ltd.
A new fuzzy method for dealing with inconsistency
Production System application
Aicha Seklouli Sekhari* and Abdelaziz Bouras
University of Lyon – PRISMa Laboratory – IUT Lumière Denis Gien: University of Blaise Pascal
160, Bd de l’Université, 69676 – BRON Cedex – France E-mail: [email protected]
E-mail: [email protected] *Corresponding author
Denis Gien
Blaise Pascal University – LIMOS Laboratory
Campus des Cézeaux, BP 265 – 63175 Aubière Cedex, France E-mail: [email protected]
Abstract: In many industrial branches, the enterprises have nearly the same
technical level and the differences in their success rates are mainly due to how they satisfy users’ needs. A close look at the manufacturing system level shows that the problem is not only to identify those needs, which are mostly qualitative and inconsistent, but to have the capacity and tools to assess this type of qualitative data and deal with its inconsistency. As regards qualitative data, many authors have worked on this problem using fuzzy set tools. However, reviewing the literature contents shows that only a few papers have concentrated their efforts on the inconsistency. In this paper, we propose a contribution consisting in a distance-based method which tries to preserve and transform the inconsistency by introducing a cover index.
Keywords: fuzzy inconsistency; Fuzzy Pairwise Comparison; FPC;
Lambda-Max method; distance-based method; cover index.
Reference to this paper should be made as follows: Sekhari, A.S., Bouras, A.
and Gien, D. (xxxx) ‘A new fuzzy method for dealing with inconsistency production system application’, Int. J. Product Development, Vol. X, No. Y, pp.000–000.
Biographical notes: Aicha Seklouli Sekhari received her PhD in Informatics
from Blaise Pascal University of Clermont Ferrand/Aubière in France. She joined the University of Lyon five years ago as a Research Engineer, and became an Associate Professor after that. Her current research interests cover the areas of production quality and Product Lifecycle Management (PLM). Abdelaziz Bouras is a Professor at the University of Lyon and the Information Systems for Production Management and Supply Chains (PRISMa) Laboratory. He is leading a research team on the integration between PLM and supply chains information. He is also a Guest Researcher at the National Institute of Standards and Technology (NIST) in Maryland, USA, where he is working on standards and testbeds for PLM.
Denis Gien has been a Professor at the French Institute of Advanced Mechanics (IFMA) since 1995, where he teaches automatic control and industrial engineering. As a Researcher, he works at System Modelling and Optimisation Laboratory (LIMOS), a joint laboratory between IFMA and Blaise Pascal University. Gien’s main research interests deal with quality assurance in manufacturing and educational systems. This concerns several levels and activities contributing to improving the quality levels for products and services, using fuzzy set theory to represent the information necessary to manage quality.
1 Overview
Manufacturing systems require knowledge of and a good definition of their objectives to be able to achieve them. In a recent research work (Seklouli and Gien, 2001), we proposed an approach to define such objectives. To rank these objectives according to their importance, the Fuzzy Pairwise Comparison (FPC) method (Barzilai, 1997) has been widely used and has been applied to many practical decision-making methodologies. In spite of its popularity, the method is often criticised for its inability to adequately handle the inconsistency associated with said importance.
Crisp pairwise comparison assumes that the decision-maker can compare any two objectives 0i and 0j at the same level of the hierarchy and provides a numerical value cij for the ratio of their importance. If objective 0i is preferred to objective 0j, then ratio cij > 1. Correspondingly, the reciprocal property cji =1/ ,c cij ij >0, for j=1,2,..., ,n
1,2,...,
i= n always holds (Mikhailov, 2003). Each set of comparisons for a level
with n objectives requires n(n-1)/2 judgements, which are further used to construct a positive reciprocal matrix of pairwise comparison { } nxn.
ij
C= c ∈ℜ The priority vector w = (w1,w2,w3,…,wn)T may be obtained from the comparison matrix C by applying some prioritisation methods, e.g., the eigenvalue method, the logarithmic least square method, the weighted least square method and the goal programming method (Barzilai, 1997; Saaty, 1988).
However, in many cases the importance of the model constructed by an individual (as a decision-maker) is uncertain and it is relatively difficult for the crisp numerical values of the comparison ratio to be provided or be known. A natural way to cope with uncertain judgements is to express the comparison ratio as a fuzzy set or a fuzzy number, which incorporates the vagueness of human thinking. When comparing two objectives 0i and 0j, the exact numerical ratio cij can be approximated by a fuzzy ratio ‘about cij’, which is represented by a fuzzy number. Thus, the fuzzy priority vector may be obtained from the fuzzy comparison matrix C%=⎡ ⎤⎣ ⎦c%ij , withc%ij =
(
α β γ δij ij ij ij)
.In FPCs, the main problem is to compute the corresponding fuzzy priority vector. This problem has been discussed in the literature and a Fuzzy Analytic Hierarchical Process (FAHP) has been used by many authors. Laarhoven (1983) used a logarithmic regression to estimate the fuzzy priority vector and based his work on the results given in Lootsma (1982). In his model, he could have multiple estimates for each pairwise comparison and could handle the problem of missing data (no estimates for certain comparisons). However, in Gogus and Boucher (1997), it is shown that this method can produce fuzzy weights: the component of fuzzy priority vector w% =( ,w w w w1 2, 3, 4),
matrix into a crisp matrix, used α_cuts and convex combinations, and then computed the eigenvector (or priority vector) from the crisp matrix. However, they did not obtain the fuzzy priority vector, and in our opinion, these works are not related to FAHP since their results have no fuzzy weights. Some other works, such as Fedrizzi and Marques Pereina (1995), in the spirit of Saaty’s (1998) Lambda Max method, first discuss a way of finding
max,
λ% where λ%max is the largest positive eigenvalue of a fuzzy, positive and reciprocal comparison matrix. The difficulties linked to such methods lie in computing fuzzy eigenvectors associated with λ%max.
Recently, there have been only a few papers (Buckley et al., 2001; Csutora and Buckley, 2001, etc.) criticising the methods deployed to compute the fuzzy priority vector. The criticism concerns Saaty’s measure of consistency for a positive reciprocal matrix. They remedy this problem by first checking the consistency of the fuzzy comparison matrix, to ensure that a decision-maker’s judgement is neither random nor illogical. When consistency is proven, they move towards the computation of the fuzzy priority vector. Csutora and Buckley’s (2001) Lambda-Max method may be considered as one of the most widely used methods. It is the direct fuzzification of the λmax method, used by Saaty (1998) in the analytical hierarchical process. However, some difficulty remains in computing the fuzzy eigenvalues and their associated fuzzy eigenvectors. Moreover, contradictory data can be found as a result even if the consistency of the fuzzy comparison matrix is proven.
In this paper we focus on the inconsistency problem. To tackle it, the method proposed here tries to modify the information contained in the fuzzy comparison matrix C% in order to approximate it, as closely as possible, to a resulting fuzzy comparison matrix X% This comparison matrix . X% is obtained from the computed fuzzy priority vector W% =
[ ]
w%i , where w% is a rectangular fuzzy number. A general i distance-based framework is developed and the Conjugate Gradient algorithm is used as an interesting optimisation tool.In this paper, we first briefly present our notation. Next, we review the results obtained from the deployment of the Lambda-Max method and discuss their reliability. Within this setting, a new fuzzy method for dealing with inconsistency is developed. To test our method, we compare the results to those obtained from the Lambda-Max method in Csutora and Buckley (2001). The last section presents the conclusions.
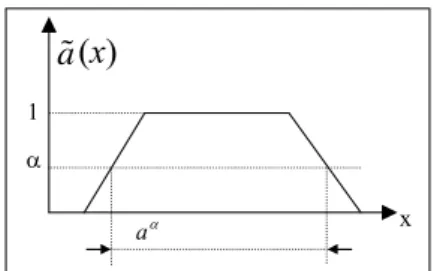
We place a tilde over a letter to denote a fuzzy set or fuzzy number. All our fuzzy sets will be subsets of real numbers. So a, b,...% % are all fuzzy subsets of ℜ. If a% is a fuzzy set, then a(x)% is the value of the membership function at x∈ℜ.
An α-cut of a,% written as a ,α is defined as
{
x / a(x)≥ αfor 0< α ≤1 .}
%
Figure 1 Fuzzy set
So A, B,C,...% % % denote fuzzy matrices, where a , b ,c ,...%ij %ij %ij are their fuzzy components.
α 1 x
(x)
α aa%
2 The limits of the Lambda-Max method
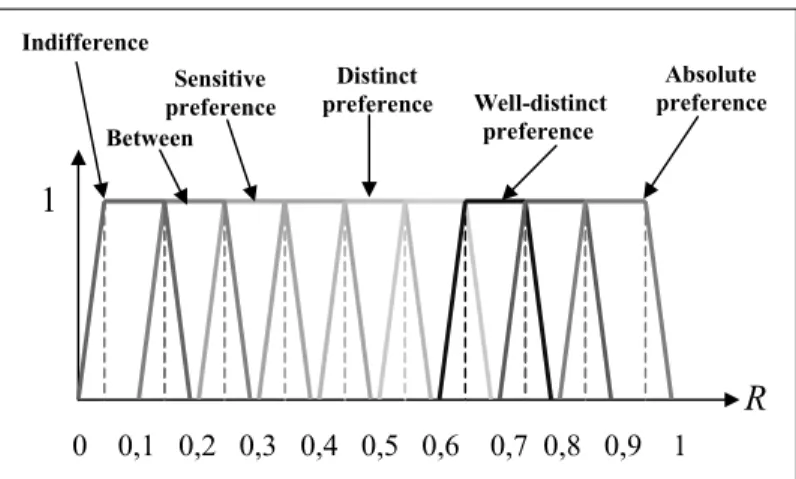
This section reviews the basic computations used in the Lambda-Max method to find the fuzzy priority vector. Many times, a decision-maker is asked to give a fuzzy ratio c%ij for each pairwise comparison between two objectives (Oi and Oj). Its value is represented by a fuzzy number, as shown in Figure 2. For example, when we state that objective Oi is preferred to Oj , the ratio c%ij is represented by (0, 4 0, 45 0,55 0,6).
Figure 2 A fuzzy scale
The ratio c%ij indicates the strength with which Oi dominates Oj. This step results in a fuzzy comparison matrix C% = ⎣ ⎦⎡ ⎤c ,%ij for which we have to prove consistency.
The crisp matrix C= ⎣ ⎦⎡ ⎤cij is said to be ‘consistent’ when, for all i, j and k,
ik kj ij
c ⋅c =c .
This means that, if the decision-maker states that cik = 2/1 for Oi versus Ok and gives ckj = 3/1 for Ok versus Oj, then to be logically consistent the decision-maker should state 6/1 for Oi versus Oj.
If the crisp matrix C is consistent, then the maximum eigenvalue λ is equal to its max dimension n
(
λmax =n)
. A measure of consistency is thus built around (λmax−n) /(n−1).To discuss total consistency, we can state that C is only ‘reasonably consistent’ when
max
(λ −n) /(n− ≤1) 0,1.
To talk about consistency in the case of a fuzzy, positive and reciprocal matrix C,% we first need to define the fuzzy multiplication c%ik⊗c .%kj
Let a% and b% denote fuzzy numbers.
We define
(
a b%⊗%)
, a fuzzy set in ℜ, by defining its α−cut a b,( ⊗%) ,α% as
(
a b⊗%)
α =aα ⊗aα.% The symbol ⊗ is the fuzzy multiplication operator (Klir and Yuan, 1995).
Since
(
a b%⊗ %)
is a closed interval for each α∈[ ]
0 1 , and a% and b% are fuzzy numbers,(
a b%⊗ %)
is also a fuzzy number.1
R
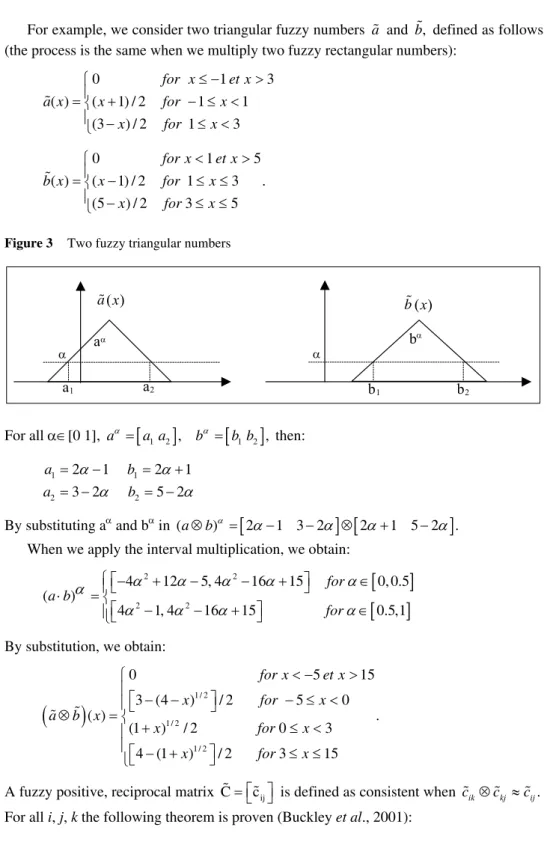
0 0,1 0,2 0,3 0,4 0,5 0,6 0,7 0,8 0,9 1 Indifference Sensitive preference Distinct preference Well-distinct preference Absolute preference BetweenFor example, we consider two triangular fuzzy numbers a% and b%, defined as follows (the process is the same when we multiply two fuzzy rectangular numbers):
0 1 3 ( ) ( 1) / 2 1 1 (3 ) / 2 1 3 for x et x a x x for x x for x ≤ − > ⎧ ⎪ =⎨ + − ≤ < ⎪ − ≤ < ⎩ % 0 1 5 ( ) ( 1) / 2 1 3 . (5 ) / 2 3 5 for x et x b x x for x x for x < > ⎧ ⎪ =⎨ − ≤ ≤ ⎪ − ≤ ≤ ⎩ %
Figure 3 Two fuzzy triangular numbers
For all α∈[0 1], aα =
[
a a1 2]
, bα =[
b b1 2]
, then:1 1 2 2 2 1 2 1 3 2 5 2 a b a b α α α α = − = + = − = − By substituting aα and bα in (a b⊗ )α =
[
2α−1 3 2− α] [
⊗ 2α+1 5 2 .− α]
When we apply the interval multiplication, we obtain:[
]
[
]
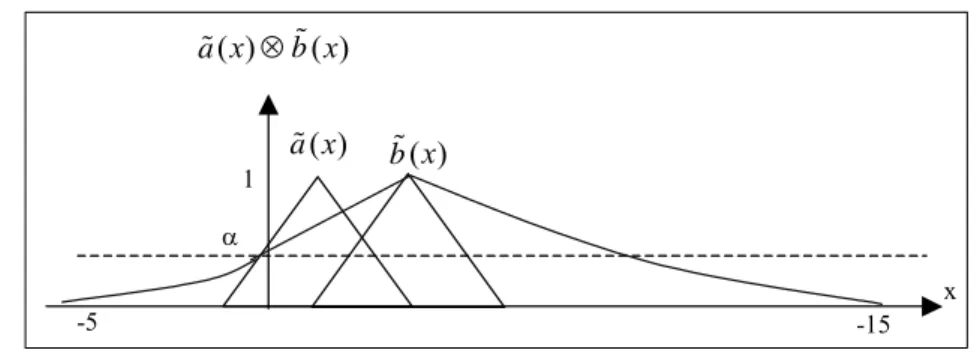
2 2 2 2 4 12 5, 4 16 15 0,0.5 ( ) 4 1, 4 16 15 0.5,1 for a b for α α α α α α α α α α ⎧⎡− + − − + ⎤ ∈ ⎪⎣ ⎦ ⋅ = ⎨ ⎡ − − + ⎤ ∈ ⎪⎣ ⎦ ⎩ By substitution, we obtain:(
)
1/ 2 1/ 2 1/ 2 0 5 15 3 (4 ) / 2 5 0 ( ) . (1 ) / 2 0 3 4 (1 ) / 2 3 15 for x et x x for x a b x x for x x for x < − > ⎧ ⎪ ⎡ − − ⎤ − ≤ < ⎪⎣ ⎦ ⊗ = ⎨ + ≤ < ⎪ ⎪⎡⎣ − + ⎤⎦ ≤ ≤ ⎩ % %A fuzzy positive, reciprocal matrix C% = ⎣ ⎦⎡ ⎤c%ij is defined as consistent when c%ik ⊗c%kj ≈c%ij.
For all i, j, k the following theorem is proven (Buckley et al., 2001):
α α a1 a2 b1 b2 ) (x (x) aα bα a% b%
Theorem Let C%= ⎣ ⎦⎡ ⎤c%ij be a fuzzy, positive, reciprocal matrix with
( , , , ). ij ij ij ij ij
c% = α β γ δ Choose a crisp number cij∈ ⎣⎡β γij ij⎤⎦ and form the crisp matrix Cc= ⎣ ⎦⎡ ⎤cij . If Cc is consistent, then the fuzzy matrix C%
is consistent.
Figure 4 A fuzzy multiplication
As a general rule, for all i, j, k, if cik⋅ckj≈cij (is approximately equal), then C% is ‘reasonably consistent’.
To compare the discussed methods, we apply them to mechanical production systems. We have to rank a set of four objectives defined on the enterprise strategic level, to be translated into adapted specifications and efficient improvement actions on the operational level:
O1 – reduce production cost O2 – reduce delivery delay O3 – reduce stocks
O4 – harmonise shareholder demands.
The decision-maker is requested to compare objective Oi to objective Oj. The matrix
ij 4x4
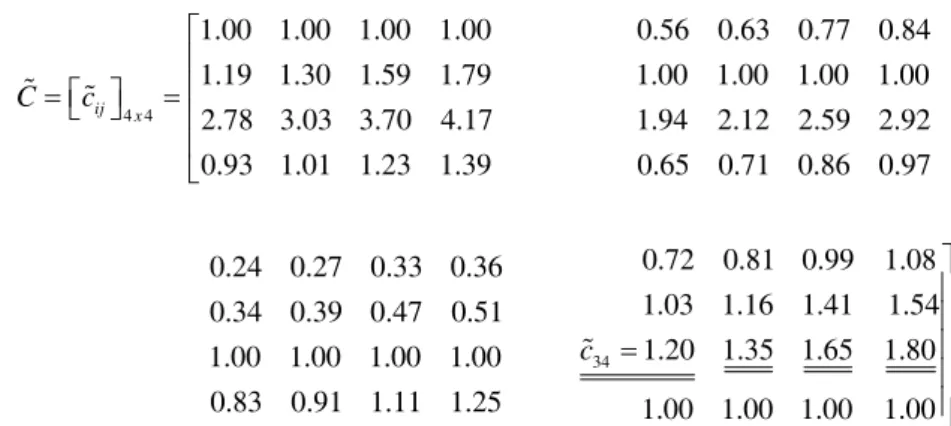
C% = ⎣ ⎦⎡ ⎤c% represented by matrix 1 displays the comparison ratios. Matrix 1 The fuzzy comparison matrix
4 4 1.00 1.00 1.00 1.00 0.56 0.63 0.77 0.84 1.19 1.30 1.59 1.79 1.00 1.00 1.00 1.00 2.78 3.03 3.70 4.17 1.94 2.12 2.59 2.92 0.93 1.01 1.23 1.39 0.65 0.71 0.86 0.97 0.24 0.27 0.33 0.36 0.3 ij x C c ⎡ ⎢ ⎢ ⎡ ⎤ =⎣ ⎦ = ⎢ ⎢ ⎣ % % 0.72 0.81 0.99 1.08 4 0.39 0.47 0.51 1.03 1.16 1.41 1.54 . 1.00 1.00 1.00 1.00 0.80 0.90 1.10 1.20 0.83 0.91 1.11 1.25 1.00 1.00 1.00 1.00 ⎤ ⎥ ⎥ ⎥ ⎥ ⎦ α ) (x (x) -5 -15 ) ( ) (x ⊗ x x 1 a% a% b% b%
According to Csutora and Buckley (2001) and Buckley et al. (2001), the consistency of
C% is equivalent to the consistency of its deduced crisp matrix Cc. For example:
12 c% =(0,56 0,63 0, 77 0,84), 12 0,63 0, 77 c 0, 7. 2 + = =
In this way, we deduce the crisp matrix Cc:
1.00 0.70 0.30 0.90 1.44 1.00 0.43 1.29 . 3.37 2.36 1.00 1.00 1.12 0.79 1.01 1.00 c C ⎡ ⎤ ⎢ ⎥ ⎢ ⎥ = ⎢ ⎥ ⎢ ⎥ ⎣ ⎦ max ( ) 4,077 4 For all , 0,026 0,1. 1 4 1 ij c n c C n λ − − ∈ = = < − −
The crisp matrix Cc is consistent. It implies the consistency of the fuzzy matrix .C% Once consistency is proven, the second step in the Lambda-Max method is to calculate the fuzzy priority vector W% =
[ ]
w%i , fori=1 to 4. Each fuzzy number w%i is obtained bycomputing its α-cuts for α ∈
{
0 0,25 0,5 0, 751 .}
Matrix 2 The fuzzy priority vector1 2 3 4 0,148 0,152 0,152 0,155 0,214 0,217 0,220 0,224 . 0,393 0,396 0, 408 0, 411 0,234 0,234 0,245 0,245 w w W w w ⎡ ⎤ ⎡ ⎤ ⎢ ⎥ ⎢ ⎥ ⎢ ⎥ ⎢ ⎥ = ⎢ ⎥ = ⎢ ⎥ ⎢ ⎥ ⎢ ⎥ ⎢ ⎥ ⎣ ⎦ ⎣ ⎦ % % % % %
To check the convergence of this result, we compare the matrix C% to the matrix ,
X= ⎢ ⎥⎡xij⎤
⎣ ⎦
% % where the fuzzy ratio x%ij =w w%i/ %j for ,i j∈
{
1,2,3, 4}
and ‘/’ is the division operator (Klir and Yuan, 1995).4 4 0.96 1.00 1.00 1.05 0.66 0.69 0.70 0.73 1.38 1.43 1.45 1.51 0.96 0.99 1.02 1.05 2.53 2.61 2.69 2.78 1.76 1.80 1.88 1.92 1.51 1.54 1.61 1.65 1.05 1.06 1.13 1.14 0.36 0.37 0.38 0.39 0 ij x X x ⎡ ⎢ ⎢ ⎡ ⎤ =⎣ ⎦ = ⎢ ⎢ ⎣ % % 0.61 0.62 0.65 0.66 .52 0.53 0.56 0.57 0.87 0.89 0.94 0.96 . 0.96 0.97 1.03 1.05 1.61 1.62 1.75 1.76 0.57 0.57 0.62 0.62 0.96 0.96 1.05 1.05 ⎤ ⎥ ⎥ ⎥ ⎥ ⎦
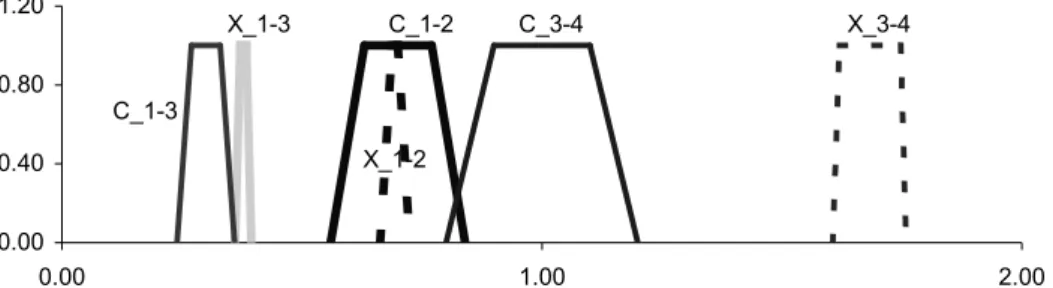
To comment on the results, we represent the given ratios c , c and c%12 %13 %34 and their corresponding computed ones x , x and x%12 %13 %34 as in Figure 5.
Figure 5 Given data versus the results with the Lambda-Max method 0.00 0.40 0.80 1.20 0.00 1.00 2.00 X_1-3 C_1-3 C_1-2 X_1-2 X_3-4 C_3-4
According to Figure 2, the ratio c%34 expresses an indifference opinion between the
objectives ‘reduce stock’ and ‘harmonise shareholder demands’; in fact, ratio x%34
expresses an opinion which is neither completely ‘indifference’ nor ‘sensitive preference’ between them. The ratio c%34 diverges from its computed ratio. The ratio c%13 is not
covered totally by its computed ratio and the inverse phenomenon is observed with the ratio c%12 and its computed ratio. It can be concluded that the Lambda-Max method, based
on the direct fuzzyfication of the λ method to compute the priority vector, leads to max
some divergent results even if the comparison matrix C~ is perfectly consistent.
3 The cover index-based framework for dealing with inconsistency
From the previous results, it can be observed that the problem of consistency in data can be considered some other way.
Regardless of the inconsistency test and depending on the fuzzy comparison matrix ,
C% we compute the fuzzy priority vector. We deduce the new fuzzy comparison matrix .
X% At this step, we introduce the cover index to calculate the distance of the given ratios
ij
c% from their calculated ones x~ij (Seklouli, 2004). We define the cover index as follows.
Definition of the cover index
We consider two fuzzy subsets x%ij =(xαij xβij x xγij δij) and c%ij =(c c c cαij βij γij δij). The
cover index is the sum of the distance between the support limit values of two fuzzy subsets x%ijandc%ij and the distance between the interval core of these two fuzzy subsets.
(
)
(
)
(
(
)
)
(
)
(
)
(
(
)
)
2 2 2 2 r ij ij ij ij ij ij ij ij i j ij ij cij cij ij ij ij ij c c x c x c x c x x c x c x c x c α α α α β β β β γ γ δ δ δ δ = − − − + − − − + − − − + − − −∑∑
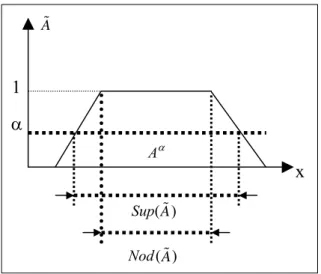
Definition of a fuzzy set (Figure 6)
The support of fuzzy set A% within a universal set X is the crisp set that contains all the elements of X that have nonzero membership grades in :A% Sup A
( ) {
% = x X A x∈ / ( ) 0 .% ≠}
Figure 6 A fuzzy set
We converge to the optimal solution by minimising the distance between the limits of these two fuzzy sets:
constraints and min with and . r ij ij ij ij ij ij ij ij ij ij ij ij i N j Z c x x c c x x c c x x c c α β α β β γ β γ γ δ γ δ ∀ ∈ ∈ Ν = ⎧ ≤ ⎧ ≤ ⎪ ≤ ⎪ ≤ ⎨ ⎨ ⎪ ≤ ⎪ ≤ ⎩ ⎩
We consider the same numerical example introduced in the previous section, highlighting the Lambda-Max method. We first consider the case where the comparison matrix C% is consistent. 4 4 1.00 1.00 1.00 1.00 0.56 0.63 0.77 0.84 1.19 1.30 1.59 1.79 1.00 1.00 1.00 1.00 2.78 3.03 3.70 4.17 1.94 2.12 2.59 2.92 0.93 1.01 1.23 1.39 0.65 0.71 0.86 0.97 0.24 0.27 0.33 0.36 0.3 ij x C c ⎡ ⎢ ⎢ ⎡ ⎤ =⎣ ⎦ = ⎢ ⎢ ⎣ % % 0.72 0.81 0.99 1.08 4 0.39 0.47 0.51 1.03 1.16 1.41 1.54 . 1.00 1.00 1.00 1.00 0.80 0.90 1.10 1.20 0.83 0.91 1.11 1.25 1.00 1.00 1.00 1.00 ⎤ ⎥ ⎥ ⎥ ⎥ ⎦
We apply the proposed distance-based method. Several optimisation algorithms have been tested to resolve the system. They lead sensibly to similar results. Here the fuzzy priority vector W% is given by conjugated gradient method.
α
1
x
) ( Sup ) ( Nod α A A% A% A%Matrix 3 The fuzzy priority vector 1 2 3 4 0,12 0,13 0,17 0,19 0,18 0,19 0,25 0,27 . 0,25 0,28 0, 49 0,52 0,18 0,18 0,31 0,31 w w W w w ⎡ ⎤ ⎡ ⎤ ⎢ ⎥ ⎢ ⎥ ⎢ ⎥ ⎢ ⎥ = ⎢ ⎥ = ⎢ ⎥ ⎢ ⎥ ⎢ ⎥ ⎢ ⎥ ⎣ ⎦ ⎣ ⎦ % % % % %
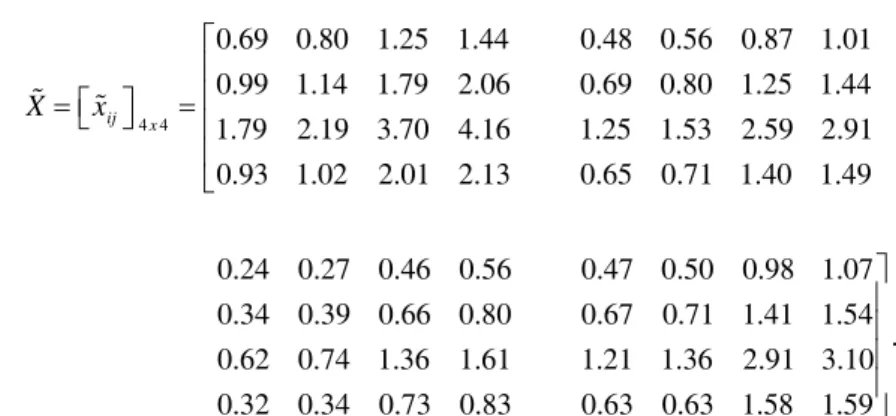
We compute the fuzzy ratio x%ij =w w%i/ %j for ,i j∈
{
1,2,3, 4 :}
4 4 0.69 0.80 1.25 1.44 0.48 0.56 0.87 1.01 0.99 1.14 1.79 2.06 0.69 0.80 1.25 1.44 1.79 2.19 3.70 4.16 1.25 1.53 2.59 2.91 0.93 1.02 2.01 2.13 0.65 0.71 1.40 1.49 0.24 0.27 0.46 0.56 0. ij x X x ⎡ ⎢ ⎢ ⎡ ⎤ =⎣ ⎦ = ⎢ ⎢ ⎣ % % 0.47 0.50 0.98 1.07 34 0.39 0.66 0.80 0.67 0.71 1.41 1.54 . 0.62 0.74 1.36 1.61 1.21 1.36 2.91 3.10 0.32 0.34 0.73 0.83 0.63 0.63 1.58 1.59 ⎤ ⎥ ⎥ ⎥ ⎥ ⎦
Comparing Figure 7 to Figure 5, we observe that ratio c%13, marked in Figure 7 by ‘c_1-3’, and ratio c%12, marked in Figure 7 by ‘c_1-2’, are wholly covered by the computed ratios. The gap between ratio c ,%34 marked in Figure 7 by ‘c_3-4’, and its computed ratio is reduced to zero with a total covering. By using this formulation, we can obtain the rank order closer to the original information on the importance of objectives.
Figure 7 Given data versus the results under consistency
0.00 0.20 0.40 0.60 0.80 1.00 1.20 0.00 0.50 1.00 1.50 2.00 2.50 3.00 x_3-4 c_3-4 c_1-3 x_1-3 c_1-2 x_1-2
We introduce now some perturbation on the fuzzy ratio c%34 that belongs to the consistent comparison matrix C% to force it to show inconsistency, in order to see how the new method deals with this inconsistency.
Matrix 4 The inconsistency matrix
4 4 1.00 1.00 1.00 1.00 0.56 0.63 0.77 0.84 1.19 1.30 1.59 1.79 1.00 1.00 1.00 1.00 2.78 3.03 3.70 4.17 1.94 2.12 2.59 2.92 0.93 1.01 1.23 1.39 0.65 0.71 0.86 0.97 0.24 0.27 ij x C c ⎡ ⎢ ⎢ ⎡ ⎤ =⎣ ⎦ = ⎢ ⎢ ⎣ % % 34 0.72 0.81 0.99 1.08 0.33 0.36 1.03 1.16 1.41 1.54 0.34 0.39 0.47 0.51 1.20 1.35 1.65 1.80 1.00 1.00 1.00 1.00 0.83 0.91 1.11 1.25 1.00 1.00 1.00 1.00 c ⎤ ⎥ ⎥ ⎥ = ⎥ ⎥⎦ %
We deploy the steps of the proposed distance-based method. The results converge to the same fuzzy priority vector W% calculated in the case with consistency (Figure 8).
Figure 8 Given data versus the results under inconsistency
0.00 0.20 0.40 0.60 0.80 1.00 1.20 0.00 0.50 1.00 1.50 2.00 2.50 3.00 3.50 c_1-2 x_1-2 c_1-3 x_1-3 c_3-4 x_3-4 4 Concluding remarks
In this paper, we have developed a new method to deal with inconsistency of data in fuzzy comparison methods. Contrary to the Lambda-Max method, which is based on a consistency test before the computational process of the rank vector, here we compute this vector with the hypothesis that data can be inconsistent and can be conserved and converted into fuzzy quantities by introducing the cover index to minimise this inconsistency.
References
Barzilai, J. (1997) ‘Deriving weights from pairwise comparison matrices’, Journal of Operational
Research Society, Vol. 48, pp.26–32.
Buckley, J.J., Feuring, T. and Hayashi, B.Y. (2001) ‘Fuzzy hierarchical analysis revisited’,
European Journal of Operational Research, Vol. 129, No. 1, pp.48–64.
Chen, S.M. (1997) ‘Evaluating weapon system using fuzzy arithmetic operations’, Fuzzy Sets and
Systems, Vol. 77, pp.265–276.
Csutora, R. and Buckley, J.J. (2001) ‘Fuzzy hierarchical analysis: the Lambda-Max method’, Fuzzy
Sets and Systems, No. 120, pp.181–195.
Fedrizzi, M. and Marques Pereina, R.A. (1995) ‘Positive fuzzy matrices, dominant eigenvalues and extension of Saaty’s analytical hierarchy process’, Proceedings of IFSA World Congress, Sao Paulo, Brazil, Vol. II, pp.245–247.
Gogus, O. and Boucher, T.O. (1997) ‘A consistency test for rational weights in multi criterion decision analysis with fuzzy pairwise comparisons’, Fuzzy Sets and Systems, Vol. 86, pp.129–138.
Klir, G.J. and Yuan, Bo. (1995) Fuzzy Set and Fuzzy Logic: Theory and Applications, Prentice Hall PTR.
Laarhoven, P.J.M. (1983) ‘A fuzzy extension of Saaty’s priority theory’, Fuzzy Sets and Systems, Vol. 11, pp.229–241.
Lootsma, F.A. (1982) ‘Performance evaluation of nonlinear optimization via multi-criteria decision analysis and via linear model analysis’, in M.J.D. Powell (Ed.) Nonlinear Optimization, pp.419–453.
Mikhailov, L. (2003) ‘Deriving priorities from fuzzy pairwise comparison matrix’, Fuzzy Sets and
Systems, Vol. 134, pp.365–385.
Saaty, T.L. (1988) Multicriteria Decision Making: The Analytic Hierarchy Process, Pittsburgh, PA: RWS Publication.
Saaty, T.L. (1998) ‘Ranking by eigenvector versus other methods in the analytic hierarchy process’, Appl. Math. Lett., Vol. 11, No. 4, pp.121–125.
Seklouli, A. (2004) ‘Traitement d’informations floues pour l’amélioration progressive du fonctionnement global des systèmes de production’, Thesis.
Seklouli, A. and Gien, D. (2001) ‘A new QFD-based method for manufacturing system improvement’, International IFIP Conference on Feature Modeling and Advanced Design for