Copyright WILEY‐VCH Verlag GmbH & Co. KGaA,69469 Weinheim,Germany,2011
Supporting Information
for Small,DOI: 10.1002/
smll.201100457
In-Situ Observation of Nucleation and Growth of PbSe
Magic-Sized Nanoclusters and Regular Nanocrystals
Kui Yu,* Jianying Ouyang, and Donald M. Leek
Supporting Information
In Situ Observation of PbSe Nucleation and Growth of Magic-Sized
Nanoclusters and Regular Nanocrystals
Kui Yu,* Jianying Ouyang, Donald M. Leek
Steacie Institute for Molecular Sciences, National Research Council of Canada, Ottawa, Ontario, K1A 0R6, Canada.
_____________________________________________ *To whom correspondence should be addressed.
Phone: 1-(613)-993-9273. E-mail: kui.yu@nrc.ca.
F625
F755 F885 F1015 F1130 F
F695 F825 F955 F1070 F Regular
nuclei
nucleation and/or quantized growth via cluster-cluster aggregation and monomer addition
continuous growth via monomer addition accompanied by the decrease of the size distribution
Regular NCs
(oleate)2Pb + DPP/DOP/TOP ⇒ Pb-P complex ⇒ PbSe monomer
(Indirect reaction pathway, dominate) TOPSe
Contents of Main Text
Abstract and Keywords
1. Introduction (Scheme S1)
2. Results and Discussion (Table S1)
2.1 With commercially available TOP 90% and TOP 97%, formation of PbSe NCs with a 1Pb-to-2.5SeTOP feed molar ratio
(Figures 1 and S1)
2.2 Formation of PbSe MSNCs with 1Pb-to-2.5SeTOP and DPP addition vs RNCs without DPP addition
(Figures 2, 3 and S2) 2.3 Formation of PbSe MSNCs vs RNCs with 8Pb-to-1SeTOP and addition of DPP
(Figures 4, 5 and S3-S5) 2.4 Possible Mechanisms.
2.4.1. Formation of PbSe monomers. (Figures 6 and S6)
2.4.2. Degree of supersaturation of the monomer affecting formation of PbSe MSNCs
and/or RNCs. (Scheme 1)
2.4.3. Surface-determined cluster-cluster aggregation: quantized growth for the RNCs at the very initial growth stage and for the MSNCs.
(Scheme 2, Figure 7 and S7) 3. Conclusions
4. Experimental Section Acknowledgements References (total 35)
Contents of Supporting Information
Scheme S1. Schematic drawing of the progression of PbSe NCs via the formation of PbSe
monomers and their combination leading to nucleation and growth. S3
Table S1. Summary of the formulation and experimental condition of the batches presented
and the collection of absorption spectra. S4
Figure S1 absorbance at 400 nm of Figure 1 batches. S5
Figure S2A. Investigation on the effect of the addition of 0.5 uL and 5 uL DPP affecting the
formation of PbSe MSNCs vs RNCs ….. with 1Pb-to-2.5SeTOP at 50 °C S6
Figure S2B. Large PbSe MSNCs obtained from Fig 2 and S2A Batch 5 uL DPP at 50 °C. S7
Figure S2C. Investigation on the effect of the addition of 5 uL DPP affecting the formation of
PbSe MSNCs vs RNCs ….. with 1Pb-to-2.5SeTOP at 55 °C S8
Figure S2D. Investigation on the effect of the addition of 2.5-5-20 uL DPP affecting the
formation of PbSe MSNCs vs RNCs ….. with 1Pb-to-2.5SeTOP at 65 °C S9
Figure S3A. Investigation on the effect of feed [Se] affecting the evolution of PbSe NCs with
0.6DPP-to-8Pb-to-1SeTOP at 50 °C. S10
Figure S3B. Large views of Fig S3A Batch [Se] 10 mmol kg-1, showing that the
disappearance of F695 is accompanied with the presence of F825, while the
disappearance of F755 is accompanied with the presence of F885. S12
Figure S4A. Investigation on the effect of the amounts of DPP added with
(0.12-1.24)DPP-to-8Pb-to-1SeTOP at 50 °C. S13
Figure S4B. Observation of nucleation of Fig S4A batches and later growth. S13
Figure S4C. Batch 0.01DPP-to-8Pb-to-1SeTOP at 50 °C. S14
Figure S5. Absorbance at 400 nm of the batches shown in Section 2. 3 (Figures 4, S3 and S4). S15 Figure S6. NMR study with the summary on Ref 16 and 18. S16
Figure S7. In situ observation of nucleation of the six Figure 4 batches. S22
Figure S8. XRD and TEM study of one reaction flask sample. S23
Figure S9. The optical properties of PbSe MSNCs from reaction flasks. S25
Scheme S1. Schematic drawing of the progression of PbSe NCs via the formation of PbSe
monomers and their combination leading to nucleation and growth.[16] The formation
mechanisms proposed by Refs 16 and 18 are summarized in Figure S6, together with the one proposed in the present study.
Pb precursors PbSe monomers
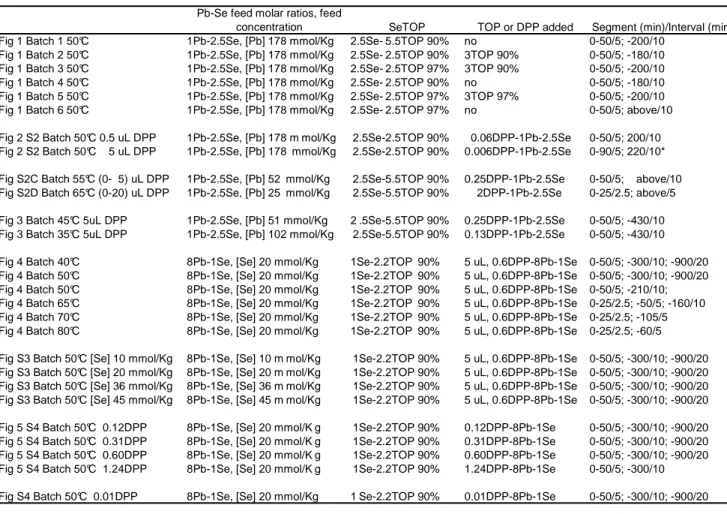
Table S1. Summary on the preparation of the batches shown in Figures 1-5 and S2-S4, as well as
in situ collection of the temporal evolution of absorption from these batches.
All the reactions started with 3.5 mL cuvettes; Se-precursor solutions were added to PbOA2 solutions in ODE under stir. For example, for Figure 1 batches, the Se precursor was
TOPSe made with 1Se-to-2.2TOP (90%, Batch 1) and 1Se-to-1TOP (90% for Batches 2 and 4; 97% for Batches 3, 5, and 6) feed molar ratios. Additional TOP (90%, 90%, and 97%) was added for Batches 2, 3, and 5, respectively.
The absorption spectra of Figure 1 were collected with a 5-min time interval in the first 50 min and a 10-min time interval afterwards.
For Figure 4 Batches 40 °C and 50 °C, the temporal evolution of the absorption spectra was collected with a 5-min time interval up to 50 min, a 10-min time interval up to 300 min, and a 20-min time interval afterwards up to 900 min. The red absorption spectra stand for the growth periods of 200, 400, 600, and 800 min. For Batch 60 °C, the absorption spectra were acquired
Pb-Se feed molar ratios, feed
concentration SeTOP TOP or DPP added Segment (min)/Interval (min) Fig 1 Batch 1 50°C 1Pb-2.5Se, [Pb] 178 mmol/Kg 2.5Se- 5.5TOP 90% no 0-50/5; -200/10
Fig 1 Batch 2 50°C 1Pb-2.5Se, [Pb] 178 mmol/Kg 2.5Se- 2.5TOP 90% 3TOP 90% 0-50/5; -180/10 Fig 1 Batch 3 50°C 1Pb-2.5Se, [Pb] 178 mmol/Kg 2.5Se- 2.5TOP 97% 3TOP 90% 0-50/5; -200/10 Fig 1 Batch 4 50°C 1Pb-2.5Se, [Pb] 178 mmol/Kg 2.5Se- 2.5TOP 90% no 0-50/5; -180/10 Fig 1 Batch 5 50°C 1Pb-2.5Se, [Pb] 178 mmol/Kg 2.5Se- 2.5TOP 97% 3TOP 97% 0-50/5; -200/10 Fig 1 Batch 6 50°C 1Pb-2.5Se, [Pb] 178 mmol/Kg 2.5Se- 2.5TOP 97% no 0-50/5; above/10 Fig 2 S2 Batch 50°C 0.5 uL DPP 1Pb-2.5Se, [Pb] 178 m mol/Kg 2.5Se-2.5TOP 90% 0.06DPP-1Pb-2.5Se 0-50/5; 200/10 Fig 2 S2 Batch 50°C 5 uL DPP 1Pb-2.5Se, [Pb] 178 mmol/Kg 2.5Se-2.5TOP 90% 0.006DPP-1Pb-2.5Se 0-90/5; 220/10* Fig S2C Batch 55°C (0- 5) uL DPP 1Pb-2.5Se, [Pb] 52 mmol/Kg 2.5Se-5.5TOP 90% 0.25DPP-1Pb-2.5Se 0-50/5; above/10 Fig S2D Batch 65°C (0-20) uL DPP 1Pb-2.5Se, [Pb] 25 mmol/Kg 2.5Se-5.5TOP 90% 2DPP-1Pb-2.5Se 0-25/2.5; above/5 Fig 3 Batch 45°C 5uL DPP 1Pb-2.5Se, [Pb] 51 mmol/Kg 2 .5Se-5.5TOP 90% 0.25DPP-1Pb-2.5Se 0-50/5; -430/10 Fig 3 Batch 35°C 5uL DPP 1Pb-2.5Se, [Pb] 102 mmol/Kg 2.5Se-5.5TOP 90% 0.13DPP-1Pb-2.5Se 0-50/5; -430/10 Fig 4 Batch 40°C 8Pb-1Se, [Se] 20 mmol/Kg 1Se-2.2TOP 90% 5 uL, 0.6DPP-8Pb-1Se 0-50/5; -300/10; -900/20 Fig 4 Batch 50°C 8Pb-1Se, [Se] 20 mmol/Kg 1Se-2.2TOP 90% 5 uL, 0.6DPP-8Pb-1Se 0-50/5; -300/10; -900/20 Fig 4 Batch 50°C 8Pb-1Se, [Se] 20 mmol/Kg 1Se-2.2TOP 90% 5 uL, 0.6DPP-8Pb-1Se 0-50/5; -210/10; Fig 4 Batch 65°C 8Pb-1Se, [Se] 20 mmol/Kg 1Se-2.2TOP 90% 5 uL, 0.6DPP-8Pb-1Se 0-25/2.5; -50/5; -160/10 Fig 4 Batch 70°C 8Pb-1Se, [Se] 20 mmol/Kg 1Se-2.2TOP 90% 5 uL, 0.6DPP-8Pb-1Se 0-25/2.5; -105/5 Fig 4 Batch 80°C 8Pb-1Se, [Se] 20 mmol/Kg 1Se-2.2TOP 90% 5 uL, 0.6DPP-8Pb-1Se 0-25/2.5; -60/5 Fig S3 Batch 50°C [Se] 10 mmol/Kg 8Pb-1Se, [Se] 10 m mol/Kg 1Se-2.2TOP 90% 5 uL, 0.6DPP-8Pb-1Se 0-50/5; -300/10; -900/20 Fig S3 Batch 50°C [Se] 20 mmol/Kg 8Pb-1Se, [Se] 20 m mol/Kg 1Se-2.2TOP 90% 5 uL, 0.6DPP-8Pb-1Se 0-50/5; -300/10; -900/20 Fig S3 Batch 50°C [Se] 36 mmol/Kg 8Pb-1Se, [Se] 36 m mol/Kg 1Se-2.2TOP 90% 5 uL, 0.6DPP-8Pb-1Se 0-50/5; -300/10; -900/20 Fig S3 Batch 50°C [Se] 45 mmol/Kg 8Pb-1Se, [Se] 45 m mol/Kg 1Se-2.2TOP 90% 5 uL, 0.6DPP-8Pb-1Se 0-50/5; -300/10; -900/20 Fig 5 S4 Batch 50°C 0.12DPP 8Pb-1Se, [Se] 20 mmol/K g 1Se-2.2TOP 90% 0.12DPP-8Pb-1Se 0-50/5; -300/10; -900/20 Fig 5 S4 Batch 50°C 0.31DPP 8Pb-1Se, [Se] 20 mmol/K g 1Se-2.2TOP 90% 0.31DPP-8Pb-1Se 0-50/5; -300/10; -900/20 Fig 5 S4 Batch 50°C 0.60DPP 8Pb-1Se, [Se] 20 mmol/K g 1Se-2.2TOP 90% 0.60DPP-8Pb-1Se 0-50/5; -300/10; -900/20 Fig 5 S4 Batch 50°C 1.24DPP 8Pb-1Se, [Se] 20 mmol/K g 1Se-2.2TOP 90% 1.24DPP-8Pb-1Se 0-50/5; -300/10 Fig S4 Batch 50°C 0.01DPP 8Pb-1Se, [Se] 20 mmol/Kg 1 Se-2.2TOP 90% 0.01DPP-8Pb-1Se 0-50/5; -300/10; -900/20
with a 5-min time interval up to 50 min and a 10-min time interval up to 210 min, with the red absorption spectra being suggestive of the growth periods of 100 and 200 min. For Batch 65 °C, the absorption spectra were collected with a 2.5-min time interval up to 25 min, a 5-min time interval up to 50 min, and a 10-min time interval afterwards up to 160 min. The red absorption spectra denote the growth period of 100 min. For Batch 70 °C, the absorption spectra were obtained with a 2.5-min time interval up to 25 min and a 5-min time interval afterwards up to 105 min. For Batch 80 °C, the absorption spectra were collected with a 2.5-min time interval up to 60 min. The red absorption lines for Batches 70 °C and 80 °C represent the growth period of 50 min. The ready observation of the PbSe MSNCs was by Batches 40 °C and 50 °C, while that of the PbSe RNCs by Batch 80 °C.
For * of Figure S2 Batch 5 uL DPP, the change of light path was carried out from 10 mm to 4 mm. See Figure S2 below.
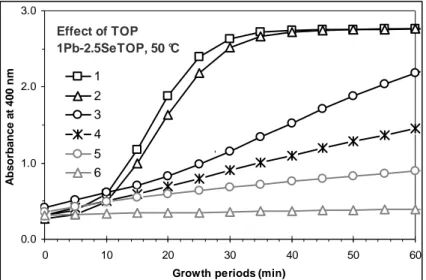
Figure S1. Investigation on the use of commercially-available TOP 90% and 97% affecting the
development of the PbSe NCs, with the absorbance at 400 nm obtained from in situ observation of absorption of Batches 1 to 6 presented in Figure 1.
Effect of TOP 1Pb-2.5SeTOP, 50 °C 0.0 1.0 2.0 3.0 0 10 20 30 40 50 60
Growth periods (min)
A b s o rb a n c e a t 4 0 0 n m 1 2 3 4 5 6 ,
Figure S2A. (Top) Batch 0 uL DPP (top-left) is Figure 1 Batch 4. Investigation on the effect of
the addition of DPP affecting the formation of PbSe MSNCs vs RNCs, via in situ observation of the temporal evolution of absorption of the NCs from three synthetic batches with the 1Pb-to-2.5SeTOP feed molar ratio and [Pb] ~178 mmol kg-1 at 50 °C.
For Batches 0 uL (top-left) and 0.5 uL (top-right), the temporal evolution of the
absorption spectra was collected with a 5-min time interval up to 50 min, a 10-min time interval up to 300 min, and a 20-min time interval afterwards up to 900 min.
For Batch 5 uL DPP (bottom-left), the absorption spectra was collected with a 5-min time interval up to 30 min and 10 mm light path. Afterwards (bottom-right), the light path was
changed to 4 mm (with 10 min for background collection), with a 10-min time interval up 220 min. 0.5 uL DPP 1Pb-2.5Se-2.5TOP [Pb] 178 mmol/Kg 50 °C, 0 - 200 min 0.00 0.60 1.20 1.80 400 500 600 700 800 900 1000 1100 1200 Wavelength (nm) A b s o rp ti o n 10 min 5 min 0 uL DPP 1Pb-2.5Se-2.5TOP [Pb] 178 mmol/Kg 50 °C, 0 - 180 min 0.00 0.15 0.30 0.45 400 500 600 700 800 900 1000 1100 1200 Wavelength (nm) A b s o rp ti o n 5 uL DPP 1Pb-2.5Se-2.5TOP [Pb] 178 mmol/Kg 50 °C, 0 - 30 min 0.00 0.83 1.66 2.49 400 500 600 700 800 900 1000 1100 1200 Wavelength (nm) A b s o rp ti o n 5 min 0 min 5 uL DPP 1Pb-2.5Se-2.5TOP 50 °C, 40 - 220 min 0.00 0.70 1.40 2.10 400 500 600 700 800 900 1000 1100 1200 Wavelength (nm) A b s o rp ti o n
See Figure S2B for Batch 5 uL the later stage growth 230 - 920 min. Note that for a clear view, the interval is 20 min from 230-330 min, 30 min from 330-360min, and 40 min from 360-920min. The red absorption spectrum stands for the growth periods of 400 min and 800 min.
It is clear that without the addition of DPP (top-left), the formation of RNCs was
preferred; with the DPP addition (the rest), MSNCs were formed with the nucleation taking place at 5 – 10 minutes (Batch 0.5 uL) and at 0 – 5 minutes (Batch 5 uL).
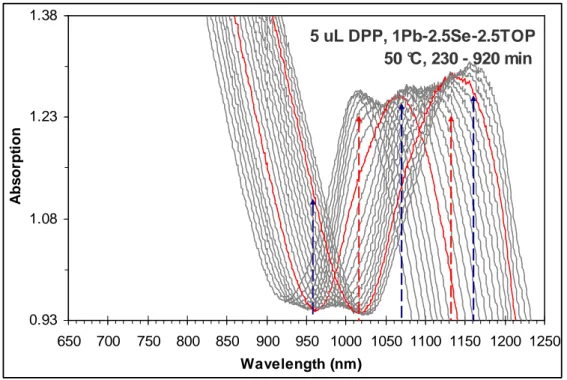
Figure S2B. Various magic-sized families are obtained, including (F625, F695, F755, F825,
F885, F955,) F1015, F1070, F1130, and F(>1170). 5 uL DPP, 1Pb-2.5Se-2.5TOP 50 °C, 230 - 920 min 0.93 1.08 1.23 1.38 650 700 750 800 850 900 950 1000 1050 1100 1150 1200 1250 Wavelength (nm) A b s o rp ti o n
Figure S2C.
Investigation on the effect of the addition of DPP affecting the formation of PbSe MSNCs vs RNCs, via in situ observation of the temporal evolution of absorption of the NCs from two synthetic batches with the 1Pb-to-2.5SeTOP feed molar ratio and [Pb] ~52 mmol kg-1 at 55 °C. The temporal evolution of the absorption spectra was collected with a 5-min time interval up to 50 min, and a 10-min time interval up to 300 min. The red absorption spectra stand for the growth periods of 100 and 200 min.
It is clear that without the addition of DPP (top), the formation of RNCs is preferred; with the DPP addition (bottom), MSNCs are formed.
5 uL DPP 1Pb-2.5Se-5.5TOP [Pb] 52 mmol/Kg 55 °C, 0 - 300 min 0.00 0.83 1.66 2.49 400 500 600 700 800 900 1000 1100 1200 Wavelength (nm) A b s o rp ti o n 0 uL DPP 1Pb-2.5Se-5.5TOP [Pb] 52 mmol/Kg 55 °C, 0 - 300 min 0.00 0.15 0.30 0.45 400 500 600 700 800 900 1000 1100 1200 Wavelength (nm) A b s o rp ti o n
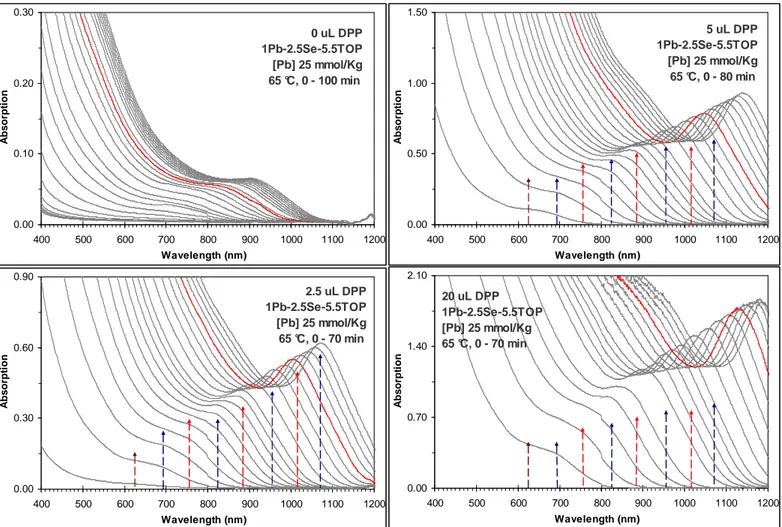
Figure S2D. Investigation on the effect of the addition of DPP affecting the formation of PbSe
MSNCs vs RNCs, via in situ observation of the temporal evolution of absorption of the NCs from four synthetic batches with the 1Pb-to-2.5SeTOP feed molar ratio and [Pb] ~25 mmol kg-1 at 65 °C. The temporal evolution of the absorption spectra was collected with a 2.5-min time interval up to 25 min, and a 5-min time interval afterwards. The red absorption spectra stand for the growth periods of 50 min.
It is clear that without the addition of DPP (left-top), the formation of RNCs is preferred; with the DPP addition (the rest), MSNCs are formed.
0 uL DPP 1Pb-2.5Se-5.5TOP [Pb] 25 mmol/Kg 65 °C, 0 - 100 min 0.00 0.10 0.20 0.30 400 500 600 700 800 900 1000 1100 1200 Wavelength (nm) A b s o rp ti o n 2.5 uL DPP 1Pb-2.5Se-5.5TOP [Pb] 25 mmol/Kg 65 °C, 0 - 70 min 0.00 0.30 0.60 0.90 400 500 600 700 800 900 1000 1100 1200 Wavelength (nm) A b s o rp ti o n 5 uL DPP 1Pb-2.5Se-5.5TOP [Pb] 25 mmol/Kg 65 °C, 0 - 80 min 0.00 0.50 1.00 1.50 400 500 600 700 800 900 1000 1100 1200 Wavelength (nm) A b s o rp ti o n 20 uL DPP 1Pb-2.5Se-5.5TOP [Pb] 25 mmol/Kg 65 °C, 0 - 70 min 0.00 0.70 1.40 2.10 400 500 600 700 800 900 1000 1100 1200 Wavelength (nm) A b s o rp ti o n
Figure S3A. Investigation on the effect of feed Se concentrations affecting the evolution of
PbSe NCs, via in situ observation of the temporal evolution of absorption of the PbSe NCs from four synthetic batches with the 0.6DPP-to-8Pb-to-1SeTOP feed molar ratio and the reaction temperature of 50 °C. The feed [Se] concentrations are indicated, together with the growth periods. Here, the temporal evolution of the absorption spectra was collected with a 5-min time
[Se] 10 mmol/Kg 0 - 900 min 0.00 0.33 0.66 0.99 400 500 600 700 800 900 1000 1100 1200 Wavelength (nm) A b s o rp ti o n [Se] 20 mmol/Kg 0 - 900 min 0.00 0.83 1.66 2.49 400 500 600 700 800 900 1000 1100 1200 Wavelength (nm) A b s o rp ti o n [Se] 10 mmol/Kg 0 - 45 min 0.00 0.02 0.04 0.06 400 450 500 550 600 650 700 750 800 Wavelength (nm) A b s o rp ti o n 40 min 35 min 30 min [Se] 20 mmol/Kg 0 - 45 min 0.00 0.20 0.40 0.60 400 450 500 550 600 650 700 750 800 Wavelength (nm) A b s o rp ti o n 25 min 20 min 10 min [Se] 36 mmol/Kg 0 - 110 min 0.00 0.83 1.66 2.49 400 500 600 700 800 900 1000 1100 1200 Wavelength (nm) A b s o rp ti o n 15 min 10 min [Se] 45 mmol/Kg 0 - 60 min 0.00 0.83 1.66 2.49 400 500 600 700 800 900 1000 1100 1200 Wavelength (nm) A b s o rp ti o n 10 min 5 min
interval up to 50 min, a 10-min time interval up to 300 min, and a 20-min time interval
afterwards up to 900 min. The red absorption spectra stand for the growth periods of 200, 400, 600, and 800 min for Batch 10 mmol kg-1 and Batch 20 mmol kg-1. The latter is that of Figure 4 Batch 50 °C. Also, the red absorption spectra stand for the growth periods of 50 min for Batch 36 mmol kg-1 and Batch 45 mmol kg-1. For the first batch, see Figure S3B also for a precise observation of the growth of the MSNCs.
Figure S3B. A large view of Batch [Se] 10 mmol kg-1 for a precise observation of the growth of the PbSe MSNCs; again, the MSNC families are identified by arrowed lines. The disappearance of F695 is accompanied with the presence of F825; the disappearance of F755 is accompanied with the presence of F885.
[Se] 10 mmol/Kg, 45 - 300 min
0.00 0.18 0.36 0.54 650 700 750 800 850 900 950 1000 Wavelength (nm) A b s o rp ti o n
[Se] 10 mmol/Kg, 300 - 900 min
0.28 0.48 0.68 0.88 900 950 1000 1050 1100 Wavelength (nm) A b s o rp ti o n
Figure S4A. Investigation on the effect of DPP amounts affecting the evolution of PbSe NCs,
via in situ observation of the temporal evolution of absorption of the PbSe NCs from four
synthetic batches with the 8Pb-to-1SeTOP feed molar ratio and [Se] ~20 mmol kg-1. The reaction temperature was 50 °C. The DPP amounts are indicated as DPP-to-8Pb feed molar ratios. The growth periods are indicated. Here, the temporal evolution of the absorption spectra was collected with a 5-min time interval up to 50 min, a 10-min time interval up to 300 min, and a 20-min time interval afterwards up to 900 min. The red absorption spectra stand for the growth periods of 100, 200, 400, 600, and 800 min. See Figure S4B for details.
0.12DPP, 0 - 900 min 0.00 0.33 0.66 0.99 400 500 600 700 800 900 1000 1100 1200 Wavelength (nm) A b s o rp ti o n 0.31DPP, 0 - 900 min 0.00 0.50 1.00 1.50 400 500 600 700 800 900 1000 1100 1200 Wavelength (nm) A b s o rp ti o n 0.62DPP, 0 - 900 min 0.00 0.83 1.66 2.49 400 500 600 700 800 900 1000 1100 1200 Wavelength (nm) A b s o rp ti o n 1.24DPP, 0 - 300 min 0.00 0.83 1.66 2.49 400 500 600 700 800 900 1000 1100 1200 Wavelength (nm) A b s o rp ti o n
1.24DPP, 45 - 300 min 0.83 1.66 2.49 A b s o rp ti o n 0.62DPP, 45 - 300 min 0.00 0.50 1.00 1.50 650 700 750 800 850 900 950 1000 Wavelength (nm) A b s o rp ti o n 0.31DPP, 45 - 300 min 0.00 0.33 0.66 0.99 650 700 750 800 850 900 950 1000 Wavelength (nm) A b s o rp ti o n 0.12DPP, 45 - 300 min 0.00 0.21 0.42 0.63 650 700 750 800 850 900 950 1000 Wavelength (nm) A b s o rp ti o n 0.12DPP, 5 - 50 min 0.01 0.02 0.03 0.04 400 450 500 550 600 650 700 750 800 Wavelength (nm) A b s o rp ti o n 50 min 45 min 40 min 0.31DPP, 0 - 45 min 0.01 0.05 0.09 0.13 400 450 500 550 600 650 700 750 800 Wavelength (nm) A b s o rp ti o n 35 min 30 min 20 min [Se] 20 mmol/Kg 0 - 45 min 0.00 0.20 0.40 0.60 400 450 500 550 600 650 700 750 800 Wavelength (nm) A b s o rp ti o n 25 min 20 min 10 min 1.24DPP, 0 - 45 min 0.30 0.60 0.90 A b s o rp ti o n 15 min 10 min
Figure S4C. Investigation on the effect of DPP amounts affecting the evolution of PbSe NCs,
via in situ observation of the temporal evolution of absorption of the PbSe NCs from this synthetic batch with the 8Pb-to-1SeTOP feed molar ratio and [Se] ~20 mmol kg-1. The reaction temperature was 50 °C. The DPP amount is indicated as DPP-to-8Pb feed molar ratios. The growth periods are indicated. The nucleation, the presence of F625 was monitored at 90 min, for this Batch. Here, the temporal evolution of the absorption spectra was collected with a 5-min time interval up to 50 min, a 10-min time interval up to 300 min, and a 20-min time interval afterwards up to 900 min. The red absorption spectra stand for the growth periods of 100, 200, 400, 600, and 800 min. 0.01DPP, 70 - 120 min 0.00 0.04 0.08 0.12 400 450 500 550 600 650 700 750 800 Wavelength (nm) A b s o rp ti o n 120 min 110 min 100 min 90 min 0.01DPP, 0 - 900 min 0.00 0.22 0.44 0.66 400 500 600 700 800 900 1000 1100 1200 Wavelength (nm) A b s o rp ti o n 0.01DPP, 0 - 900 min 0.00 0.20 0.40 0.60 500 550 600 650 700 750 800 850 900 Wavelength (nm) A b s o rp ti o n 0.01DPP, 0 - 900 min 0.00 0.25 0.50 0.75 700 750 800 850 900 950 1000 1050 1100 Wavelength (nm) A b s o rp ti o n
Figure S5. Investigations on the effects
of growth temperature (top), feed [Se] (middle), and the amount of DPP added (bottom) affecting the evolution of the PbSe NCs, via in situ observation of the absorbance at 400 nm from the various Batches studied. With the feed molar ratio of 0.62DPP-to-8Pb-to-1TOPSe and [Se] 20 mmol kg-1, the effect of the growth temperature in the range of 40─80°C is shown in the top part; these six batches are also shown in Figure 4. With the feed molar ratio of 0.62DPP-to-8Pb-to-1TOPSe and the growth
temperature of 50°C, the effect of the feed [Se] is shown in the middle part; these four batches are shown in Figure S3. With the feed molar ratio of 8Pb-to-1TOPSe and [Se] 20 mmol kg-1 and the growth temperature of 50°C, the effect of the amount of DPP added is shown in the bottom part; these four batches are shown in Figures 4 and S4.
Effect of Temperature 0.0 1.0 2.0 3.0 0 10 20 30 40 50
Growth periods (min)
A b s o ra n c e a t 4 0 0 n m 80 °C 70 °C 65 °C 65 °C 50 °C 40 °C Effect of feed [Se] 0.0 1.0 2.0 3.0 0 10 20 30 40 50
Growth periods (min)
A b s o ra n c e a t 4 0 0 n m 45mmol/Kg 36mmol/Kg 20mmol/Kg 10mmol/Kg Effect of DPP amounts 0.0 1.0 2.0 3.0 0 10 20 30 40 50
Growth periods (min)
A b s o ra n c e a t 4 0 0 n m 1.24 0.62 0.31 0.12 0.00
Figure S6A. 31P NMR detected no DOPSe (δ 4.7 ppm18) but some DOP (δ -68.9 ppm18), together with TOPSe (δ 36.9 ppm18) and TOP (δ -31.7 ppm18) from our ~1.0 M TOPSe/TOP solution, with external standard 85% H3PO4. The NMR sample was prepared in a glovebox,
where 12.6569 g (34.15 mmol) TOP 90% and 1.2256 g (15.52 mmol) Se were mixed. The mixture was stirred overnight at room temperature in the glovebox. The mixture was loaded in a NMR tube and properly sealed. The NMR measurements were carried out at 25 °C and 80 °C/10min. The magnification of the insets is indicated. It is noteworthy that another Se-containing species (~48.4 ppm) was detected.
31
P NMR, thus, suggests that DOP/TOP + Se ⇒ TOPSe (no DOPSe).
TOPSe
TOP
Se=P(C
8H
17)
3DOPSe
4.7 ppm
25 ºC (1) 80 ºC (2) (1) (2) X 32DOP
(1) (2) X 256 (1) (2) X 128PH(C
8H
17)
2P(C
8H
17)
3Se=PH(C
8H
17)
2Figure S6B. 31P NMR detected no DPPSe (δ 7.5 ppm18) with the addition of DPP (δ -39.5 ppm18) to the ~1.0 M TOPSe/TOP (TOPSe δ 36.9 ppm18 and TOP δ -31.7 ppm) solution, with external standard 85% H3PO4. The NMR sample was prepared in a glovebox, where 0.43 mL
(0.44 mmol) of the 1.0 M TOPSe stock solution was mixed with 0.31 mL (1.75 mmol) DPP. The mixture was loaded in a NMR tube and properly sealed. The NMR measurements were performed at 25 °C and 80 °C/10 min. The magnification of the insets is 256. It is noteworthy that another Se-containing species (~48.4 ppm) was detected.
31
P NMR, thus, suggests that TOPSe + DPP, still TOPSe and no DPPSe.
25 ºC (1) 80 ºC (2) (1) (2) X 256 (1) (2) X 256 (1) (2) X 256 TOPSe DPP TOP Se=PH(Ph)2 DPPSe 7.5 ppm DOP PH(Ph)2 PH(C8H17)2 Se=P(C8H17)3 25 ºC (1) 80 ºC (2) (1) (2) X 256 (1) (2) X 256 (1) (2) X 256 TOPSe DPP TOP Se=PH(Ph)2 DPPSe 7.5 ppm DOP PH(Ph)2 PH(C8H17)2 Se=P(C8H17)3
Figure S6C. 31P NMR detected new peaks, such as at 26.8 ppm (DPPO16) and -7.8 ppm (unknown, which might be a Pb-P complex), from a reaction of 0.7986 g (0.54 mmol) of our PbOA2 stock solution and 0.1 mL (0.57 mmol) DPP (δ -39.1 ppm,) with external standard 85%
H3PO4. The NMR sample was prepared in a glovebox, and the mixture was loaded in a NMR
tube and properly sealed. The NMR spectra were collected from 30 °C to 80 °C. The magnification of the inset is indicated.
26.8ppm
X 128
30 ºC (1) 40 ºC/20min (2) 50 ºC/20min (3) 60 ºC/20min (4) 80 ºC/20min (5) 80 ºC/60min (6) 80 ºC/90min (7)-12.5 ppm
X 64
-7.8ppm
X 256
(1) (2) (3) (4) (5) (6) (7)DPPO
O=PH(Ph)
2DPP
-39.1ppm
JACS 2006 (Ref 16) JACS 2010 (Ref 18) Present study
TOPO 54.2 53.5 54.6
TOPSe 36.9, 36.7 36.8 36.9
DPPO 24.5 27.1 26.8
DPPSe N/A 7.5 (in tol-d8), 5.9 not detected
DOPSe N/A 4.7, 4.3 not detected
TOP -20.4 -31.7 -31.7
DPP -39.9 -40.2 (in tol-d8) -39.1/-39.5
DOP N/A -69.1 -68.9
Figure S6D. We summarized the chemical shifts (ppm) of the various species reported from the
two 31P NMR studies documented in JACS 2006 (Ref 16) and JACS 2010 (Ref 18). For the present study, an external standard 85% H3PO4 was used.
Figure S6E. We summarized the two formation mechanisms of PbSe monomers proposed in
2006 (top, Ref 16) and 2010 (middle, Ref 18), with some detail (bottom) in their difference for the two routes a and b.
(oleate)2Pb + Se=P(C8H17)3 [(oleate)-Pb-Se-P(C8H17)3] ⊕+ (oleate) Θ(a-2006) (oleate)2Pb + Se=P(C8H17)3 [(oleate)-Pb-Se-P(C8H17)3] ⊕+ (oleate) Θ(a-2006) (oleate)2Pb + Se=PH(Ph2) (oleate)-Pb-Se-P(Ph)2 + oleic acid (a-2010) (oleate)2Pb + Se=PH(Ph2) (oleate)-Pb-Se-P(Ph)2 + oleic acid (a-2010)
(oleate)2Pb + DPP (oleate)2-Pb-PH-(Ph)2 Pb0+ (oleate)-P⊕H-P(Ph) 2+ (oleate) Θ (b-2006) (oleate)2Pb + DPP (oleate)2-Pb-PH-(Ph)2 Pb0+ (oleate)-P⊕H-P(Ph) 2+ (oleate) Θ (b-2006)
(oleate)2Pb + DPP (oleate)-Pb-P(Ph)2 + oleic acid Ph2P-Pb-PPh2+ oleic acid Pb0+ Ph
2P-PPh2 (b-2010)
DPP (oleate)2Pb + DPP (oleate)-Pb-P(Ph)2 + oleic acid
Ph2P-Pb-PPh2+ oleic acid Pb0+ Ph
2P-PPh2 (b-2010)
DPP (oleate)2Pb + TOPSe ⇒ PbSe monomer
+ TOPO + oleic anhydride (a-2006)
(oleate)2Pb + DPP/DOP/TOP ⇒ Pb0 ⇒ PbSe monomer
+ TOP (b-2006) TOPSe
(oleate)2Pb + DPPSe ⇒ PbSe monomer
(a-2010, dominate) (oleate)2Pb + DPP ⇒ Pb0 ⇒ PbSe monomer
(b-2010, unlikely) TOPSe
Figure S7. In situ observation of nucleation of the six Figure 4 batches, whose experimental
conditions including the growth periods are indicated. For a meaningful examination, the absorption spectra are offset; and the optical density of Batch 70 °C Curve (4)* was one-tenth of its true value. For Batches 50 °C, the emergence and disappearance of the PbSe NCs peaking at
0.6DPP-8Pb-1SeTOP [Se] 20 mmol/Kg, 40 °C F625 0.00 0.01 0.02 0.03 400 450 500 550 600 650 700 750 800 Wavelength (nm) A b s o rp ti o n (1) 0 min (2) 5 min (3) 10 min (4) 15 min (5) 20 min (6) 25 min (7) 30 min (7) (6) (5) (4) (3) (2) (1) 0.6DPP-8Pb-1SeTOP [Se] 20 mmol/Kg, 50 °C F625 0.00 0.01 0.02 0.03 400 450 500 550 600 650 700 750 800 Wavelength (nm) A b s o rp ti o n (1) 0 min (2) 5 min (3) 10 min (3) (2) (1) 0.6DPP-8Pb-1SeTOP [Se] 20 mmol/Kg, 60 °C F625 0.00 0.01 0.02 0.03 400 450 500 550 600 650 700 750 800 Wavelength (nm) A b s o rp ti o n (1) 0 min (2) 5 min (3) 10 min (3) (2) (1) 0.6DPP-8Pb-1SeTOP [Se] 20 mmol/Kg, 65 °C F625 0.000 0.015 0.030 0.045 400 450 500 550 600 650 700 750 800 Wavelength (nm) A b s o rp ti o n (1) 0 min (2) 5 min (3) 10 min (4) 15 min (4) (3) (2) (1) 0.6DPP-8Pb-1SeTOP [Se] 20 mmol/Kg 70 °C 0.00 0.01 0.02 0.03 400 450 500 550 600 650 700 750 800 Wavelength (nm) A b s o rp ti o n (1) 0 min (2) 2.5 min (3) 5 min (4) 10 min (4)* (3) (2) (1) 0.6DPP-8Pb-1SeTOP [Se] 20 mmol/Kg 80 °C 0.00 0.01 0.02 0.03 400 450 500 550 600 650 700 750 800 Wavelength (nm) A b s o rp ti o n (1) 0 min (2) 2.5 min (2) (1)
570 nm is worthy of notice, together with the development of the NCs peaking at 625 nm. The cluster peaking at 570 nm does not seem to be magic-sized according to its growth pattern monitored.[23-26] For Batch 80 °C, nucleation might take place at 0 min with the presence of one ensemble peaking at ~660 nm.
Figure S8. XRD (top-right) and TEM (bottom) study of one purified PbSe NC ensemble (whose
absorption was shown (top-left)) from a reaction flask with the feed molar ratios of 2.2OA-1Pb-2.6SeTOP-0.12DPP and [Pb] 129 mmol kg-1. The TOPSe solution was made with a feed molar ratio of 1Se-2.2TOP. The growth period of the ensemble was 30 min at 50 °C. The TEM image shows a certain degree of aggregation.
For the present study with the coexistence of various PbSe nanocrystals, it seems that traditional characterization tools such as XRD, TEM, elementary analysis, and XPS, for size and composition of one particular family, exhibit limitation. For our small-sized PbSe RNCs, EDX and XPS were used to study the Pb-to-Se atomic number ratios [Ref 19a].
Particularly, TEM has been widely used in the characterization of size and size
distribution; however, for ~2 nm NCs, TEM has its limitation. Meanwhile, for such small NCs, the aggregation during TEM sample preparation is significant. Accordingly, it is challenging to accurately obtain the size information of each PbSe MSNC family [Ref 25] and small-sized PbSe NCs [Ref 19]. For small-sized NCs, the use of their first excitonic absorption peak positions instead of their sizes can be practical to minimize the confusion due to the discrepancy in size determination by different techniques or by the same technique but used in various research groups [Ref 13 and 19].
Purified 50 °C/30 min PbSe from a reaction flask 2.2OA-1Pb-2.6SeTOP-0.12DPP [Pb] 129 mmol-Kg Tetrachloroethylene (TCE) 500 600 700 800 900 1000 1100 1200 1300 1400 Wavelength (nm) A b s o rp ti o n 15 25 35 45 55 65 75
Two theta (degree)
In te n s it y ( a . u .) (1 1 1 ) (2 0 0 ) (2 2 0 ) (3 1 1 ) (2 2 2 ) (4 0 0 ) (33 1 ) (4 2 0 ) (4 2 2 )
Purified 50 °C/30 min PbSe from a reaction flask 2.2OA-1Pb-2.6SeTOP-0.12DPP
Figure S9. The temporal evolution of absorption (top, offset) from two reaction flasks (left and
right) for the synthesis of PbSe F625. Highly-synthetic reproducibility was demonstrated. For the two flasks, the feed molar ratios and [Se] are indicated. The TOPSe solutions were added at 40 °C; the growth was carried out at 130 °C and the growth periods are indicated. For each PbSe from a reaction flask
17.6OA-8Pb-1Se2.2TOP [Se] 31 mmol-Kg, 130 °C Tetrachloroethylene (TCE) 0.0 0.1 0.2 0.3 350 450 550 650 750 850 Wavelength (nm) A b s o rp ti o n (1) 0 min (2) 30 min (3) 60 min (3) (2) (1)
PbSe from a reaction flask 17.6OA-8Pb-1Se3.5TOP [Se] 35 mmol-Kg, 130 °C Tetrachloroethylene (TCE) 0.0 0.1 0.2 0.3 350 450 550 650 750 850 Wavelength (nm) A b s o rp ti o n (1) 0 min (2) 10 min (3) 20 min (4) 30 min (5) 45 min (6) 60 min (7) 90 min (8) 105 min (4) (3) (2) (1) (8) (7) (6) (5)
Left - 45 min PbSe TEC, Exc 500 nm 0.0E+00 1.5E+05 3.0E+05 4.5E+05 400 500 600 700 800 900 Wavelength (nm) P L I n te n s it y ( a . u .) 0.00 0.05 0.10 0.15 A b s o rp tio n PL Abs
Figure S10. The temporal evolution of absorption (offset) from one reaction flask with the same
recipe as that of Batch Figure S9–left but the weight of ~16 g instead of ~8 g. The TOPSe solution was added at 40 °C; the growth periods and temperature are indicated. For each spectrum, 100 uL sample was dispersed in 1 mL TCE for the measurement. The presence of the PbSe ensemble exhibiting absorption peaking at ~520 nm is worthy of notice.
PbSe from a reaction flask 17.6OA-8Pb-1Se3.5TOP [Se] 35 mmol-Kg Tetrachloroethylene (TCE) 0.0 0.1 0.2 0.3 350 450 550 650 750 850 Wavelength (nm) A b s o rp ti o n (1) 60 min-130 °C (2) 5 min-150 °C (2) (1)


![Figure S3B. A large view of Batch [Se] 10 mmol kg -1 for a precise observation of the growth of the PbSe MSNCs; again, the MSNC families are identified by arrowed lines](https://thumb-eu.123doks.com/thumbv2/123doknet/14131679.469151/14.918.113.676.97.868/figure-batch-precise-observation-growth-families-identified-arrowed.webp)

![Figure S4C. Investigation on the effect of DPP amounts affecting the evolution of PbSe NCs, via in situ observation of the temporal evolution of absorption of the PbSe NCs from this synthetic batch with the 8Pb-to-1SeTOP feed molar ratio and [Se] ~20 mm](https://thumb-eu.123doks.com/thumbv2/123doknet/14131679.469151/17.918.75.852.106.637/investigation-affecting-evolution-observation-temporal-evolution-absorption-synthetic.webp)
![Figure S5. Investigations on the effects of growth temperature (top), feed [Se]](https://thumb-eu.123doks.com/thumbv2/123doknet/14131679.469151/18.918.116.520.117.956/figure-s-investigations-effects-growth-temperature-feed-se.webp)
