Publisher’s version / Version de l'éditeur:
The Astrophysical Journal, 806, 1, 2015
READ THESE TERMS AND CONDITIONS CAREFULLY BEFORE USING THIS WEBSITE. https://nrc-publications.canada.ca/eng/copyright
Vous avez des questions? Nous pouvons vous aider. Pour communiquer directement avec un auteur, consultez la première page de la revue dans laquelle son article a été publié afin de trouver ses coordonnées. Si vous n’arrivez pas à les repérer, communiquez avec nous à PublicationsArchive-ArchivesPublications@nrc-cnrc.gc.ca.
Questions? Contact the NRC Publications Archive team at
PublicationsArchive-ArchivesPublications@nrc-cnrc.gc.ca. If you wish to email the authors directly, please see the first page of the publication for their contact information.
NRC Publications Archive
Archives des publications du CNRC
This publication could be one of several versions: author’s original, accepted manuscript or the publisher’s version. / La version de cette publication peut être l’une des suivantes : la version prépublication de l’auteur, la version acceptée du manuscrit ou la version de l’éditeur.
For the publisher’s version, please access the DOI link below./ Pour consulter la version de l’éditeur, utilisez le lien DOI ci-dessous.
https://doi.org/10.1088/0004-637X/806/1/133
Access and use of this website and the material on it are subject to the Terms and Conditions set forth at
A Gemini/GMOS study of intermediate luminosity early-type Virgo
cluster galaxies. I. Globular cluster and stellar kinematics
Li, Biao; Peng, Eric W.; Zhang, Hong-xin; Blakeslee, John P.; Côté, Patrick J
D (Pat); Ferrarese, Laura; Jordán, Andrés; Liu, Chengze; Mei, Simona;
Puzia, Thomas H.; Takamiya, Marianne; Trancho, Gelys; West, Michael J.
https://publications-cnrc.canada.ca/fra/droits
L’accès à ce site Web et l’utilisation de son contenu sont assujettis aux conditions présentées dans le site LISEZ CES CONDITIONS ATTENTIVEMENT AVANT D’UTILISER CE SITE WEB.
NRC Publications Record / Notice d'Archives des publications de CNRC:
https://nrc-publications.canada.ca/eng/view/object/?id=40e943c3-ac42-409c-a4df-e2aede52aed6 https://publications-cnrc.canada.ca/fra/voir/objet/?id=40e943c3-ac42-409c-a4df-e2aede52aed6
A GEMINI/GMOS STUDY OF INTERMEDIATE LUMINOSITY EARLY-TYPE VIRGO CLUSTER GALAXIES. I.
GLOBULAR CLUSTER AND STELLAR KINEMATICS
Biao Li1,2, Eric W. Peng1,2, Hong-xin Zhang1,2,3,4,6,15, John P. Blakeslee5, Patrick Côté5, Laura Ferrarese5, Andrés Jordán6,7, Chengze Liu8,9, Simona Mei10,11, Thomas H. Puzia6, Marianne Takamiya12, Gelys Trancho13, and
Michael J. West14
1Department of Astronomy, Peking University, Beijing 100871, China;biaolee@pku.edu.cn,peng@pku.edu.cn 2Kavli Institute for Astronomy and Astrophysics, Peking University, China
3Chinese Academy of Sciences South America Center for Astronomy, Camino EI Observatorio #1515, Las Condes, Santiago, Chile 4National Astronomical Observatories, Chinese Academy of Sciences, Beijing 100012, China
5National Research Council of Canada, Herzberg Astronomy and Astrophysics Program, 5071 West Saanich Road, Victoria, BC V9E 2E7, Canada 6Instituto de Astrofísica, Facultad de Física, Pontificia Universidad Católica de Chile, Av.Vicuña Mackenna 4860, 7820436 Macul, Santiago, Chile
7Millennium Institute of Astrophysics, Av.Vicuña Mackenna 4860, 7820436 Macul, Santiago, Chile 8Department of Physics, Shanghai Jiao Tong University, 800 Dongchuan Road, Shangai 200240, China 9Shanghai Key Lab for Particle Physics and Cosmology, Shanghai Jiao Tong University, Shanghai 200240, China
10GEPI, Observatoire de Paris, PSL Research Institute CNRS, University of Paris Diderot, 61, Avenue de l’Observatoire 75014, Paris, France 11Université Paris Denis Diderot, Université Paris Sorbonne Cité, F-75205 Paris Cedex 13, France
12Institute for Astronomy, University of Hawaii, 2680 Woodlawn Dr., Honolulu, HI 96822, USA 13Giant Magellan Telescope Organization, 251 South Lake Avenue, Pasadena, CA 91101, USA
14Maria Mitchell Observatory, 4 Vestal Street, Nantucket, MA, 02554, USA
Received 2015 February 10; accepted 2015 April 22; published 2015 June 12
ABSTRACT
We present a kinematic analysis of the globular cluster (GC) systems and diffuse stellar light of four intermediate luminosity (sub-L*) early-type galaxies in the Virgo cluster based on Gemini Multi-Object Spectrographs (GMOS) data. Our galaxy sample is fainter (−23.8< MK < −22.7) than most previous studies, nearly doubling the number of galaxies in this magnitude range that now have GC kinematics. The data for the diffuse light extends to 4Re, and the data for the GCs reaches 8–12Re. We find that the kinematics in these outer regions are all different despite the fact that these four galaxies have similar photometric properties, and are uniformly classified as “fast rotators” from their stellar kinematics within 1Re. The GC systems exhibit a wide range of kinematic morphology. The rotation axis and amplitude can change between the inner and outer regions, including a case of counter-rotation. This difference shows the importance of wide-field kinematic studies, and shows that stellar and GC kinematics can change significantly as one moves beyond the inner regions of galaxies. Moreover, the kinematics of the GC systems can differ from that of the stars, suggesting that the formation of the two populations are also distinct.
Key words:galaxies: elliptical and lenticular, cD – galaxies: kinematics and dynamics –
galaxies: star clusters: general 1. INTRODUCTION
Early-type galaxies (ETGs) are thought to be the final products of mergers and accretion processes in a hierarchical universe. This history of collapse and merging is preserved in the motions of their stars. Stellar kinematics can therefore be used to constrain galactic formation and evolution. Absorption line profiles measured from integrated spectroscopy can measure these bulk stellar motions. However, these observa-tions are usually restricted to within 1–2 effective radii (R ⩽ 1–2Re) of galaxy centers (Gerhard et al. 2001; Pinkney et al.2003; Proctor et al.2005; Spolaor et al.2008) due to the faintness of the stellar halo. With the development of integral field units (IFUs), this technique has given us a new two-dimensional (2D) view of the line-of-sight velocity distribution in galaxies (Bacon et al.2001; Cappellari et al.2011; Sánchez et al. 2012; Emsellem et al.2014; Bundy et al.2015; Guérou et al.2015). Cappellari et al. (2011) observed 260 ETGs in the nearby universe with the Spectrographic Areal Unit for Research on Optical Nebulae (SAURON) IFU in the ATLAS3D project. They were able to measure the projected
angular momentum per unit mass, and used this parameter to
classify 260 ETGs as either “fast” or “slow” rotators, finding that nearly all but the most massive ETGs are fast rotators (Emsellem et al.2011). They argue for a shift in the existing paradigm for ETGs, where galaxies generally classified morphologically into disc-like S0 galaxies and spheroidal-like
Esystems should instead be classified kinematically.
However, like earlier studies, the ATLAS3Dproject is limited
to 1Re, where relaxation processes make inferring formation histories increasingly difficult, and where feedback processes complicate things even further. The fraction of the total mass in this region may only be ∼15%–30% (Wu et al. 2014). In addition, the outer regions may present more obvious signatures of merging or accretion events. There are only a few studies that extend out to ∼2–4Re (Mehlert et al. 2000; Proctor et al. 2009; Weijmans et al. 2009; Forestell & Gebhardt 2010; Arnold et al. 2014). Proctor et al. (2009) developed a new technique for extracting integrated spectra of the field stars, or galaxy diffuse light (GDL), contained in multi-slit observations, and found a variety of rotation profiles beyond 1Re for five ETGs. They found that the stellar kinematics in their galaxies’ inner regions were not necessarily predictive of those in the outer regions. One possibility is that dissipation processes in gas-rich major mergers produce © 2015. The American Astronomical Society. All rights reserved.
dramatic kinematic differences between the inner and outer regions (Hoffman et al.2010). Alternatively, the galaxies could have formed in two separate phases, with the inner region forming early by dissipation, and the outer region forming later by accretion of smaller galaxies (Oser et al. 2010). Further studying stellar kinematics at large radius is clearly an important direction to pursue.
Compared to stellar kinematics, which are limited by low surface brightness, observations of globular clusters (GCs) can extend out to much larger distances (∼10Re) from the galaxy center. Because GCs are compact and luminous, they are easily observed in the halos of galaxies. GCs are old, coeval collections of stars that can survive a Hubble time, and they preserve information on the assembly history of their host galaxies.
In recent years, large samples of GC velocities around ETGs have been produced (e.g., M87, Strader et al.2011; NGC 1399, Schuberth et al.2010; NGC 5128, Peng et al.2004b, Woodley et al. 2010). For practical reasons, much of the work in this field has focused on massive ETGs and their rich GC systems. ETGs at intermediate mass, however, are much more common, and perhaps less complicated than their more massive counterparts. For these ETGs, with luminosities at or fainter than the knee of the galaxy luminosity function (MK = −24.2 mag, Cole et al. 2001, h = 0.7), there are only a few studies (NGC 3115, Arnold et al.2011; NGC 3379, Puzia et al.2004, Pierce et al. 2006, Bergond et al. 2006; NGC 4494, Foster et al. 2011; NGC 821, 3377, 1400, 4278, 7454, Pota et al. 2013). Due to lower surface brightnesses and sparser GC systems, these galaxies generally lack kinematic data at large radii.
Romanowsky et al. (2003) and Douglas et al. (2007) used planetary nebulae as kinematic tracers and found some intermediate luminosity ETGs (NGC 3379, NGC 821, and NGC 4494) with low mass-to-light ratios, which appeared to conflict with the dark matter fractions predicted in cosmolo-gical simulations. Compared to massive ETGs, intermediate luminosity ETGs may also have more sporadic merger histories with different mass ratios, potentially preserving the wide range of assembly processes at work, and making them important and interesting targets of study.
In this paper, we study the GC and stellar kinematics of four intermediate luminosity ETGs in the Virgo cluster out to large radii. We compare GC and stellar kinematic trends (rotation amplitude and position angle (PA)) with each other, and at different radii. In our next paper (B. Li et al., 2015, in
preparation), we will study the mass distribution and dark matter content of these intermediate luminosity ETGs.
2. SAMPLE, OBSERVATIONS, AND DATA
2.1. Sample
We selected four intermediate-luminosity ETGs from the ACS Virgo Cluster Survey (ACSVCS; Côté et al. 2004), a homogeneous Hubble Space Telescope survey of 100 ETGs in the nearby Virgo cluster of galaxies using the Advanced Camera for Surveys (ACS; Ford et al. 1998). These deep images, with their high spatial resolution, allow for excellent selection of GCs (Jordán et al.2009). This is crucial for our sample galaxies, as they do not have very rich GC systems, and contamination from foreground and background sources can significantly reduce the spectroscopic yield.
The four galaxies in our study are VCC 1231, 2000, 1062, and 685 (NGC 4473, 4660, 4442, and 4350, respectively, see Table 1). They span the interesting L* to sub-L* luminosity range (−20.5<MB < − ), making them fainter than galaxies19 targted in typical GC kinematic studies. For its luminosity range, this sample now doubles the number of galaxies with GC kinematics. According to NED, two have morphological type E5, and the other two are classified as S0. All galaxies are classified as “fast rotators” by ATLAS3D (Emsellem
et al.2011).
2.2. Observation
We observed these galaxies with the Gemini Multi-Object Spectrographs (GMOS, Hook et al.2004), twin instruments on the Gemini North and Gemini South telescopes. Our target galaxies have sizes (Re∼10–18″) that fit well within the GMOS field of view (5.5 arcmin2), providing coverage out to
10–16Re. Each galaxy contained ∼50 targetable GCs with
V<23mag. VCC 1231, VCC 1062, and VCC 2000 data were taken with GMOS-South, whereas data for VCC 685 was taken with GMOS-North. We observed three masks for each galaxy to overcome the issue of slit-crowding at the galaxy centers. VCC 685 was only observed with one mask due to it being lower priority in the queue. Table2summarizes the observing information. Because there are two gaps in the GMOS CCD focal plane, we observed with two wavelength centers, 5080 and 5120 Å, dithering exposures between the two. For each central wavelength, we took two exposures. We used the B600_G5323(GMOS North) and B600_5303(GMOS South) grisms with 1. 0″ wide slits, giving a dispersion of 0.5 and
Table 1 Sample Properties
ID Type R.A.(J2000) decl.(J2000) Vsys Re D MK PAK (b a)K
(deg) (deg) (km s−1) (kpc) (Mpc) (mag) (degree)
(1) (2) (3) (4) (5) (6) (7) (8) (9) (10)
VCC1231 (NGC4473) E5 187.453659 +13.429320 2260 1.2 15.2 −23.77 275 0.54 VCC2000 (NGC4660) E5 191.133209 +11.190533 1087 0.8 15.0 −22.69 280 0.5 VCC1062 (NGC4442) SB0 187.016220 +09.803620 547 1.3 15.3 −23.63 82 0.51 VCC0685 (NGC4350) SA0 185.990891 +16.693356 1210 0.9 15.4 −23.13 30 0.3 Note.Hubble types (2) are from the NED database. The position of galaxy center, R.A. (3) and decl. (4), the galaxy systemic velocity (5) and the K-band absolute magnitude (8) are all from ATLAS3Dproject (Cappellari et al.2011), where (8) are derived from the 2MASS extended source catalog (Jarrett et al.2000). The
effective radii (6) are from Ferrarese et al. (2006). The distances (7) are from Blakeslee et al. (2009), except VCC 685 which is from the GC luminosity function estimates by Jordán et al. (2007). The photometric position angle (9) and axis ratio (10) are from 2MASS (Skrutskie et al.2006).
0.45Åpixel−1, respectively. Both grisms give a spectral resolution of R = 1688. (Puzia et al.2013)
2.3. Data Reduction
The data reduction was performed by using the Gemini/ GMOS IRAF package (Version 1.11). (1) The cosmic ray rejection was done using the GSCRSPEC script, which was originally written by Bryan Mlller. GSCRSPEC is an MEF wrapper for the spectroscopic version of the Laplacian Cosmic Ray Identification routine (van Dokkum 2001). (2) The bias subtraction and flat-fielding were done by the GSDEDUCE. (3) We used GSWAVELENGTH to establish the wavelength calibration from the CuAr arc frames. Typical wavelength solution residuals were ∼0.1–0.3Å. (4) The wavelength calibration was applied to the object frames by using GSTRANSFORM. (5) We used GSSKYSUB to do the sky-subtracted interactively and GSEXTRACT to extract 1D spectra from each object frame. (6) Finally, we used the SCOMBINE to median combine extracted spectra from the same slits.
After extracting the target spectrum from each of the mask slitlets, we get a “background” spectrum for each slitlets. For slits closer to the galaxy center, this “background” spectrum contains not only sky but also useful amounts of host GDL. If the slit is far from the galaxy center, the spectrum should be dominated by “pure sky.” In order to recover information from the slits with significant amounts of galaxy light, we carefully choose slits at the greatest distance (∼7Re) from the galaxy
center and combine their spectra to produce a pure sky spectrum for non-local sky subtraction. We do not use slits located near the edges of the mask where the vignetting effects are serious. After subtracting the sky spectrum from the remaining “background” spectra we are left with the GDL spectra. Figure 1 shows GC and GDL spectra with different signal-to-noise ratio (S/N). Our spectra typically cover a wavelength range from 3500 to 6500 Å, but the wavelength range depends on the slit position on the mask and some spectra can reach wavelengths as red as 7200 Å.
2.4. Radial Velocity Determination
We use the FXCOR task in IRAF to measure the GC and GDL velocities. The template we use for FXCOR is a K-type M31 GC spectrum from a list of SAO spectral templates. For the GDL, we also use the penalized pixel-fitting method (pPXF) as implemented by Cappellari & Emsellem (2004) to measure radial velocities and velocity dispersions. For pPXF,
we use the MILES library of stellar spectra as templates (Sánchez-Blázquez et al.2006). The radial velocities measured using FXCOR and pPXF are very consistent, so we choose to use the FXCOR velocities. The velocity uncertainties are estimated by FXCOR and scaled to those determined with repeated measurements of science targets. For velocity dispersion, we use the region of 4850 to 5350 Å which contains the Hβ, Mg b and Fe5270 spectroscopic features. To be conservative, we only measure the velocity dispersion within 3Re. The S/N of the spectra are typically too low to measure accurately the velocity dispersion in the outer regions. We divide our GCs into red and blue populations according to the g( −z)0 color distributions in Peng et al. (2006). The
colors of GCs are from the ACSVCS and the Next Generation Virgo Survey (NGVS, Ferrarese et al.2012). The NGVS data are used for objects that fall outside the ACS field of view. The transformation that we use between the ACSVCS and NGVS filters are:
gACS−gNGVS=0.12±0.06 (1)
zACS−zNGVS= −0.06±0.10. (2) The number of spectroscopically confirmed blue and red GCs in our galaxy sample is listed in Table 3. Most of the GCs belonging to VCC 685 and VCC 2000 are blue.
In addition to the Gemini/GMOS spectra of the GCs and GDL, all four of our sample galaxies have published IFU
Table 2
Summary of Gemini/MOS Observation
Mask R.A.(J2000) Decl.(J2000) Exp.Time Slits Night
(deg) (deg) (seconds)
GS2008AQ008–01 191.134109 +11.176211 3040 22 2008 Apr 06 GS2008AQ008–02 191.134109 +11.176211 3040 23 2008 Apr 07 GS2008AQ008–03 191.134109 +11.176211 3040 20 2008 Apr 08 GS2008AQ008–04 187.453537 +13.427367 3040 30 2008 Mar 14 GS2008AQ008–05 187.453537 +13.427367 3040 25 2008 Apr 01 GS2008AQ008–06 187.453537 +13.427367 3040 27 2008 Apr 05 GS2008AQ008–07 187.024216 +09.806433 2700 21 2008 Mar 02 GS2008AQ008–08 187.024216 +09.806433 2700 21 2008 Mar 09 GS2008AQ008–09 187.024216 +09.806433 2700 21 2008 Mar 14 GN2008AQ073–01 186.002594 +16.686339 2820 24 2008 Mar 31
Figure 1.Reduced GC and GDL spectra. The red lines are the best-fitt PPXF templates. The S/N is calculated from 4500 to 4750 Å.
spectroscopy from SAURON (Emsellem et al. 2004; Cappel-lari et al. 2011). Since we have some GDL slits in the SAURON regions, we compare our measured radial velocity and velocity dispersion with those obtained with SAURON (Figure 2). The velocities and velocity dispersions of SAURON data are from a 2D interpolation of their radial velocity and velocity dispersion field. The solid line is a 1:1 relation. We found generally good agreement between these two data sets. SAURON velocities are a little bit larger than our GDL velocities. The offset is 16 and 4 km s−1for the velocity
and velocity dispersion, respectively, between our GDL data and SAURON data. To facilitate comparison to the SAURON data, we add a 16 km s−1 velocity offset to our measured
velocities. We do not change our velocity dispersion measure-ments, as 4 km s−1is well within the estimated uncertainties.
One possible problem of obtaining stellar kinematics with the GDL technique is that the “background” spectrum may be contaminated by residual GC light. To check whether this is a problem, we compare the velocity of the GC and GDL from the same VCC 1231 slits. In Figure 3, we show that there is no correlation between these two velocities, suggesting that the effect of the GC light on the GDL is negligible.
We present the full table of GC and GDL positions, velocities, velocity dispersions (GDL only), and uncertainties in Tables8 and9. The radial velocity distribution is shown in Figure4.
3. KINEMATICS ANALYSIS
3.1. Two-dimensional Velocity Field
For each galaxy, we show the 2D velocity fields as derived from GCs (e.g., left panel of Figure 5). We use a Gaussian kernel function to smooth the velocity field. At each point, the value of the velocity field is estimated by:
(
)
V x y v , j (3) j j j j∑
∑
ω ω ′ ′ ′ = Table 3All GC Kinematics Fitting Results
ID Nblue Nred Vm Vrot Bias σ Vrotσ PAkin
(km s−1) (km s−1) (km s−1) (km s−1) (degree) (1) (2) (3) (4) (5) (6) (7) (8) (9) VCC1231 39 12 2268 35 ± 40 31 171 ± 24 0.2 ± 0.2 216 ± 78 VCC2000 42 1 1062 100 ± 42 5 128 ± 20 0.8 ± 0.4 198 ± 32 VCC1062 28 12 484 153 ± 28 8 108 ± 18 1.4 ± 0.4 92 ± 12 VCC685 15 0 1244 66 ± 120 106 195 ± 45 0.3 ± 0.6 92 ± 91 Note.GC kinematics results for our galaxy sample. The number of blue GCs, red GCs, the mean velocity, rotation velocity (amplitude), bias of the rotation velocity, velocity dispersion, dominance parameter (Vrot σ), and kinematic position angle (PA) are shown in columns (2) to (9), respectively. See Section3.2for details on the
estimation of these parameters.
Figure 2. Comparison of our GDL radial velocity and velocity dispersion measurememts with those from the SAURON survey. Different colored data points represent difference galaxy data sets. The solid line is a 1:1 relation. The mean offset is 16 and 4 km s−1 for the velocity and velocity dispersion,
respectively. The two surveys show good agreement.
Figure 3.Velocity comparison between the GDL and the target observed in the same slits. We see the data point is random, which suggest there is no correlation between the velocity measured for the target and the GDL.
Figure 4.GC and GDL velocity distribution as function of radius. The blue, red circle, and green stars represent blue GCs, red GCs, and GDL, respectively. The galaxy systemic velocity is plotted as a dashed line.
Figure 5.2D velocity fields of our sample galaxies. Left column: smoothed GC velocity fields. Squares represent the location of the GCs, and the triangles represent the point-symmetric counterparts. The color represents the value of the smoothed velocity field at that point, with the color scale on the right hand side of each panel. The ellipses represent 1 and 3 effective radii, the values of which are listed in Table1. Right column: stellar velocity field as derived from the GDL data without smoothing. The circles represent the location of our slits, and the diamonds represent the point-symmetric counterparts. The SAURON data are plotted in a contiguous rectangle at the galaxy center. Note that the spatial and velocity scales differ in each plot in order to best display the dynamic range. In all plots, north is up, and east is to the left.
π D 1 2 exp 2 (4) j 2 2 ω σ σ = −
whereω depends on D, which is the distance from jth point toj
(x y′ ′), and σ which is the width of the Gaussian kernel. The, Gaussian kernel can have a fixed bandwidth (Peng et al.2004b) or vary as a function of local density (Coccato et al.2009). The Gaussian kernel we used has a fixed width ofσ= kpc, which is1 close to 1Refor our galaxy sample. We note that our final result is not strongly sensitive to the exact kernel width, so we choose 1 kpc as a reasonable compromise. We also found that the fixed kernel did not lead to information loss in the outer region of galaxy. In the very inner regions, where it might matter, we typically have few data points due to slit crowding.
To reduce the noise due to the finite spatial sampling of our GCs and GDL, we assume the galaxy is point-symmetric in
phase space, a valid assumption for triaxial potentials. Each point (x y v, , ) thus has a mirror counterpart ( x− − − ),, y, v
where the x and y are the position of the GC/GDL on the sky, and v is the radial velocity of GC/GDL minus the galaxy’s systemic velocity. This technique has been adopted in Arnaboldi et al. (1998), Peng et al. (2004b), and Coccato et al. (2009). For the GCs, we plot the smoothed point-symmetric 2D velocity fields for our galaxy sample (e.g., left panel of Figure 5). For the GDL, we only plot the point-symmetric 2D velocity fields. In order to compare our GDL data to the SAURON data (Emsellem et al.2004; Cappellari et al.2011), we plot the SAURON data in the central regions (e.g., right panel of Figure5). The raw radial velocity fields without smoothing, and without the assumption of point-symmetry (and hence without doubling the data) are shown in the appendix. The point-symmetric velocity fields are only used
Table 4
Blue and Red GC Kinematics Fitting Results
ID Vrot,B Vrot,R BiasB BiasR σB σR PAkin,B PAkin,R
(km s−1) (km s−1) (km s−1) (km s−1) (km s−1) (km s−1) (degree) (degree)
(1) (2) (3) (4) (5) (6) (7) (8) (9)
VCC1231 73 ± 43 83 ± 115 21 80 157 ± 24 183 ± 51 235 ± 48 96 ± 87
VCC2000 97 ± 44 L 7 L 127 ± 20 L 196 ± 30 L
VCC1062 145 ± 37 183 ± 57 9 20 108 ± 21 104 ± 30 88 ± 16 100 ± 24 Note.Blue (B) and red (R) GC kinematics results for our galaxy sample.
Figure 6.Kinematic fitting results as a function of radius in VCC 1231. The top panel shows the rotation amplitude. The middle panel shows the velocity dispersion. The bottom panel shows the kinematic position angle. The red stars represent the fitting results for the SAURON data. The lines represent the fitting results from the multislit galaxy diffuse light data (green line), red and blue GCs (red and blue), with the shaded regions showing the 1σ uncertainty of the fit. The green triangles represent the velocity dispersion measured in each individual slit within 3Re. The photometric major and minor axes are represented with the dotted and dashed line in
the bottom panel, respectively. The GDL measurements have a rotation axis similar to that of the SAURON data. However, the rotation amplitude (top panel) is generally lower than for the SAURON data. Red and blue GCs have the same rotation velocity but rotate around the difference axes (although with low significance). The velocity dispersion of the GDL data is consistent with that of the SAURON data. The velocity dispersion profile of blue and red GC stays flat out to large distance.
for illustration purposes; all quantitative results in the following sections use the original, non-symmetrized data.
3.2. Rotation Amplitude and Rotation Axis
One of the main kinematic characteristics we wish to explore for halo systems is the degree of rotational support, if any. To obtain the rotation amplitude and axis for the GC systems and stars, we use methods which have been used previously (Foster et al. 2011; Strader et al. 2011; Pota et al. 2013). For this kinematic analysis, we use the original data without point-symmetric folding or smoothing. For each bin in radius, if we assume the radial velocity distribution is Gaussian, then the equivalent χ is:2
(
)
(
)
v v v v ( ) ln (5) i i p i p i 2 mod 2 2 2 2 2∑
χ σ σ = − + Δ + + Δ)
(
v v V q 1 tan PA PA , (6) i mod 0 rot kin kin 2 = ± +⎛ − ⎝ ⎜ ⎜ ⎞ ⎠ ⎟ ⎟where viis the radial velocity, vΔ is the velocity error,σ is thep
velocity dispersion, Vrotis the rotation amplitude, and v0is the
galaxy systemic velocity. PAi, PAkin, and qkin are the PA of
each data point, PA of the kinematic major axis, and the kinematic axis ratio, respectively. For the GCs, we minimize the Equation (3). For the GDL, the χ is de02 fined as follows:
(
)
(
)
v v v v ( ) ln (7) i i i i 0 2 mod 2 2 2∑
χ = − Δ + ΔFor both the GCs and GDL, we assume qkin is equal to the photometric axis ratio of the galaxy light since qkin is difficult to constrain with our data. We also fit with qkin=1(round), and the results do not show any significant differences. We use Monte Carlo simulations to estimate the errors of the fitted parameters. At each data point, we generate the velocity with the Gaussian distribution defined by the intrinsic dispersion and observed velocity error. After 1000 Monte Carlo simulations, we used the 68% confidence intervals as the 1σ uncertainties of the fitted parameters.
As discussed in Strader et al. (2011), allowing the PA of the rotation axis to be a free parameter creates a tendency to overestimate the rotation amplitude. We use Monte Carlo simulations, similar to those described in Pota et al. (2013), to estimate the magnitude of this bias. The bias depends on
V
( rot σ , bin size and the azimuthal distribution of data points.) When V( rot σ) and bin size are small, the bias will increase. Sometimes, the estimated bias is comparable to or larger than the measured vrot(i.e., for VCC 685). We list the estimated bias
in Table 3. However, in both cases where the bias is comparable to the rotation amplitude, the uncertainty in the rotation amplitude is also large. Thus, our conclusions are based on the rotation amplitudes without bias correction.
To compare the SAURON data, GDL, and GCs, we carry out rolling fits with the raw data binned in elliptical annuli. The
Figure 7.Radial velocities vs. position angle in VCC 1231. The black circles represent the GC data and pink triangles represent the GDL data. The black and pink solid lines represent the best-fitting rotation curve for the GCs and GDL, respectively. GCs show no rotation or very small rotation. The GDL shows small rotation. The curves are not perfect sinusoids in PA because we include the ellipticity of the system in the fit.
number of GCs in each bin depend on the sampling of the GC system. There are 10–20 GCs and 7–10 GDL slits in one bin. We move the bins one data point at a time. The galaxy systemic velocity is fixed to the value in Table 1. The fitting results for the GC systems are listed in Tables 3–5.
4. RESULTS
4.1. VCC 1231
The 2D velocity field of VCC 1231 is shown in Figure 5. The GC and stellar velocity fields are shown in the left and right panels, respectively. The velocity field of the GCs does not show any obvious ordered motion or significant rotation.
The central stellar kinematics as shown by the SAURON data, however, show clear rotation, with a peak amplitude of Vrot∼
60 km s−1. Our GDL data goes out farther in radius than the
SAURON data and is consistent with the SAURON data in the overlap region. In the outer regions, the rotation amplitude declines. Recently, Foster et al. (2013) also use a similar method to get GDL kinematics in VCC 1231, and their results show both minor and major axis rotation in the outer regions. They argue that it is tell-tale sign of triaxiality (e.g., Peng et al.2004b). Although we do not see this kinematic structure in our GDL data, it possibly due to the fact that most of the slits where we can derive stellar kinematics are along the major axis, so it is difficult to see any major axis rotation. We also lack the data to confirm the minor axis rotation out to 5 kpc.
In Figure 6, we plot the rotation amplitude, Vrot, velocity
dispersion, σ, and rotation axis, PAkin, profiles with radius. We
can see that σ and the kinematic PA of the stars in the outer regions (GDL, green solid line or triangle) is generally consistent with that measured by SAURON in the inner regions (red stars). In the region where they overlap, Vrotand
PAkinof the stars in the outer regions are a little bit offset from
the SAURON data. One possibility is that our GDL kinematics are not determined from a uniform spatial distribution, which can lead to fitting bias. Moreover, the radial bin size for the SAURON profile is much smaller than for our GDL profile. The Vrotof GDL data is in agreement with SAURON data in 2σ
confidence.
The GDL rotation amplitude is smaller than that in the inner regions. It decreases with radius and Vrot∼ 20 km s−1at 3 kpc. The PAkin is 120∼ o and stays the same out to 3 kpc. Similar
results were also found in Foster et al. (2013, their Figure 3). We plot the GDL velocity dispersion profile in the middle
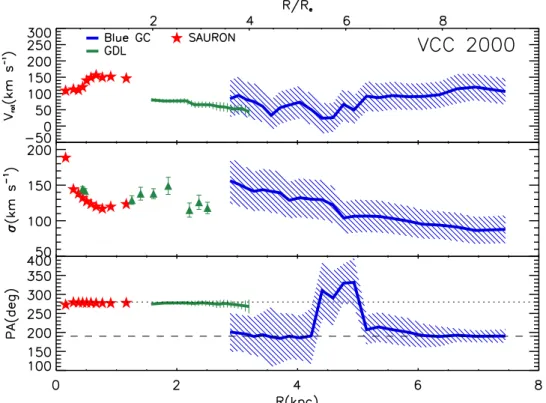
Figure 9.Kinematics fitting result as a function of radius in VCC 2000. The symbols are shown in the upper left. The SAURON data and GDL show rotation around the same axis, but the GDL data (which is at larger radius) has a smaller rotation amplitude than the SAURON data. The velocity dispersion profile of the GCs decreases with radius. The PAkinof the blue GCs is largely not coincident with the PAkinof the GDL.
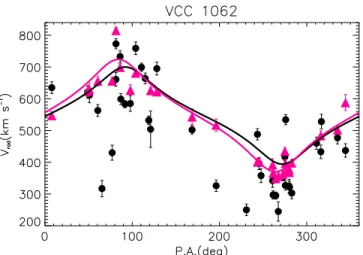
Figure 10.Radial velocities vs. position angle in VCC 2000. The GCs and the GDL both show rotation, but with different rotation axes.
panel of Figure6. Each green triangle represents the measured velocity dispersion from one slit. We derived the SAURON velocity dispersion profile (red stars) by taking the mean velocity dispersion within an elliptical annulus on the 2D velocity dispersion map. These two measurements are not entirely equivalent, making GDL profile noisier than the SAURON velocity dispersion profile. However, on average, these two datas show a good agreement at the same position (see Figure 2).
The Vrotof red and blue GCs are similar and both nominally
larger than that of the GDL, but the error is large and the low number of GCs (10≲ N≲ 20) in each bin may lead to the Vrot
being overestimated. After the bias correction, the rotation velocity of red and blue GC is 3±115 km s−1 and 52±43 km s−1. The red GC rotation is consistent with zero,
within the uncertainties.
Although the rotation amplitudes for the two GC subpopula-tions are similar, the best-fit rotation axes are very different, which is intriguing. The red GCs appear to rotate around the photometric minor axis, which is consistent with the stars in the inner regions, while the blue GCs appear to rotate around an axis somewhere between the photometric major and minor axes. These very different PAs lead to the whole GC system showing no significant rotation (see Figure7). The best-fitting
Figure 11.Same as in Figure5, but for VCC 1062.
Figure 12.Kinematic fitting results as a function of radius in VCC 1062. Red GCs, blue GCs, and the GDL all show significant rotation around the same rotation axis. The velocity dispersion profile of the red and blue GCs stays flat between 3 and 5 kpc, but the blue GC dispersion profile increases beyond 5 kpc.
rotation amplitude for the full GC system is 35±40 km s−1
with PAkin= 216±78°. To test the significance of this
rotation signal, we use the method of “scrambling” the properties of the observed GCs and refitting the kinematics. This method had been applied in testing the rotation of the M87 UCD system (Zhang et al.2015) and the GC systems of low-mass galaxies (Toloba et al.2015b). We fix the GC PAs and randomly shuffle the velocity and velocity error of each GC. We repeated this exercise 1000 times and each time we apply the same kinematics fitting as we did for our original data. We find that 88% and 33% of the simulations for the red and blue GCs, respectively, have rotation amplitudes at least as high as what we fit for our observed data. We conclude that the significance of these rotation amplitudes is not high, but future observations to obtain more GC velocities may shed further light on this issue.
In Figure7, we also plot the GDL best-fitting rotation curve. The GDL best-fitting amplitude is 41±6 km s−1with PA
kin=
129± °, which is smaller than the SAURON data in the inner7 region.
4.2. VCC 2000
The right panel of Figure8 shows the 2D velocity field of stars in VCC 2000. Both the SAURON and GMOS data show obvious rotation with the same PAkin, although the rotation
velocity in the inner regions seems larger than in the outer regions. The GCs show rotation in the inner region 3Reand outer region. In the middle region, however, the rotation velocity dips to 40 km s∼ −1. There are 42 blue GCs and only 1
red GC in VCC 2000, so we only plot the blue GCs in Figure9. Although there is little overlap between the SAURON and GMOS data for the stars, the stellar rotation axis (PAkin) is
consistent across both data sets, with both showing rotation about the photometric minor axis. However, the amplitude of the rotation appears to decline with radius. The rotation amplitude of the GC system is consistent with that of the stars in their region of overlap, but the axis of rotation is off by 90°, with the GCs rotating about the photometric major axis. The GCs and the stars appear kinematically decoupled in this galaxy. The velocity dispersion of the GCs monotonically declines.
The best fitting PA versus Vradcurve is shown in Figure10.
The GC best-fitting amplitude is 100±42 km s−1with PA kin=
198 ±32°. The GDL best-fitting amplitude is 76±6 km s−1
with PAkin= 275± °. This again shows that the GCs and4
stars both show rotation, but with the different PAs for their rotation axes. The rotation velocity of the GDL is smaller than that derived from the SAURON data in the inner regions.
4.3. VCC 1062
The 2D velocity fields of VCC 1062 are shown in Figure11. In this galaxy, both the stars and GCs show strong rotation about the minor axis at all radii. The blue and red GCs also exhibit similar kinematics. In Figure 12, we can see that the rotation amplitude of the stars and GCs at large radii (R > 2 kpc) stays flat at around 200 km s−1. The GCs also
have a rotation axis similar to that fit to the stellar SAURON data in the inner region.
The best fitting rotation curve of VCC 1062 is shown in Figure13. We can see that the stars (GDL) and GC both show
Figure 13.Radial velocities vs. position angle in VCC 1062. The GCs and GDL both show significant rotation about the same axis.
a significant rotation with the same PAkin. The GCs best-fitting
amplitude is 153± 28 km s−1 with PA
kin= 92± 12°. The
GDL best-fitting amplitude is 177 ±3 km s−1 with PAkin=
84± °. The peak rotation is essentially along the photometric1 major axis (i.e., rotating about the minor axis). The rotation velocity of the GDL is larger than that for the SAURON data in the inner region.
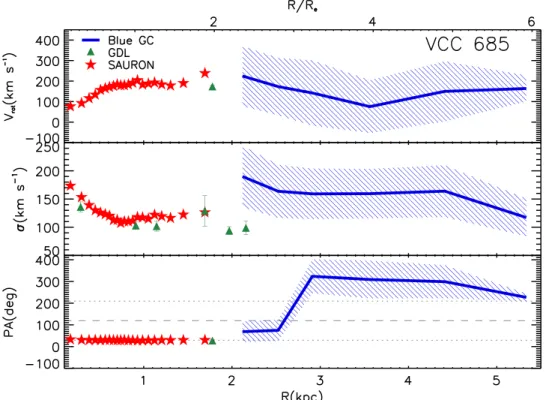
4.4. VCC 685
VCC 685 is also classified as a fast rotator in the ATLAS3D
project. The stars clearly rotate about the photometric minor
axis (Krajnović et al.2011). Our GMOS GDL measurements are consistent with the SAURON data, and we can clearly see rotation in the 2D velocity field of the stars out to 3Re (Figure 14, right panel, Figure 15, top panel). In these inner regions, the GCs also show strong rotation about the photometric minor axis, but there is a remarkable shift at
R= 3–4 kpc. At these radii, the rotation axis of the GCs flips and exhibits counter-rotation. To better quantify this, we divide the GCs into two groups: 9 GCs in the inner region (<3.5 kpc) and 6 GCs in the outer region (>3.5 kpc). The best-fitting rotation curve for the inner and outer GC samples are shown in Figure16. The purple and green circles represent the inner and outer region GCs, respectively. The inner region GCs’ best-fitting amplitude is 282 ± 129 km s−1with PA
kin= 64±38°.
The outer region GCs best-fitting amplitude is 245 ± 85 km s−1
with PAkin= 224±13°.
Given that we only have 15 GCs in this galaxy, we wanted to see if this situation could occur randomly. To test the significance of the counter rotation, we used the scrambling method discussed earlier where we fix the PAs of the GCs and randomly scramble the velocities and velocity errors. After 100,000 trials, we find that only 520 have kinematics similar to what we observe (Vrot,inner ⩾282, Vrot,outer⩾245, and
121° < ΔPAkin<239°). With only 0.52% of trials randomly producing the observed kinematics, we conclude that this detection of counter-rotation in the GCs is significant.
In Figure16, we show that the best-fitting amplitude of GDL is 174 ± 7 km s−1with the PA
kinis 28± °. This is consistent5
with the results from fitting the SAURON data. These stellar kinematics are roughly (but not exactly) consistent with the kinematics of the inner GCs.
Figure 15.Kinematics fitting result as a function of radius in VCC 685. The blue GCs exhibit counter-rotation, showing rotation in both the inner and outer regions, but around different rotation axes. The velocity dispersion profile of GC stays flat with radius.
Figure 16.Radial velocities vs. position angle in VCC 685. The purple and green circles represent the inner and outer region GCs, respectively. The fits show strong counter-rotation. The magenta curve and points represents the rotation of the GDL, which lines up more with the rotation of the inner GCs.
5. DISCUSSION
5.1. The Kinematics of GC Systems and Their Hosts
The four galaxies in our sample are similar in many respects. All are classified as “fast rotators” by the ATLAS3D project,
have similar morphological classifications, have nearly iden-tical surface brightness profiles (Sersić n ∼ 3–4) and GC surface density profile shapes (Sérsic n ∼ 1.2–1.8). Yet, their GC systems show different kinematics: VCC 1231ʼs GCs show little or no rotation. VCC 2000 GCs have a rotation amplitude consistent with the stars, but with a different rotation axis (PAkin). VCC 1062ʼs GCs show fast rotation consistent with
the stars both in amplitude and PA. VCC 685ʼs GC system exhibits counter-rotation. This diversity suggests that these galaxies, despite their otherwise similar characteristics, had different assembly histories. Below, we discuss each of the galaxies in more detail.
1. VCC 1231: Although the GC system as a whole does not show significant rotation, the red and blue GC individu-ally appear to have rotation around nearly opposite kinematic axes, and with the red GCs aligned with the rotation of the stars. This finding is currently of low significance due to the low number of GCs in each sample. Many observations suggest that the red GCs are more associated with the stellar main body (Peng et al. 2004a; Faifer et al.2011; Strader et al.2011; Pota et al.2013). It will be interesting to observe more GCs to test if the metal-poor GCs are truly counter-rotating with respect to the metal-rich GCs and the stars. If true, and if the metal-poor GCs are accreted from low-mass
progenitors (e.g., Cote et al. 1998), then this galaxy requires a formation scenario where the angular momenta of the dry merged components and the gaseous components are nearly opposite.
2. VCC 2000: This galaxy’s GC system is a more significant example of where the kinematics of blue GCs are different from those of the stars (see Figure 10). In this case the rotation axis of the blue GCs is orthogonal to that of the stars. This galaxy GC system is consistent with a scenario where blue GCs are accreted from low-mass progenitor, and where the kinematics of these outer components are decoupled from the material that eventually settles to form the stellar disk.
3. VCC 1062: This galaxy’s kinematics are the “simplest” in our sample. The red and blue GCs both have kinematics consistent with the stars. All three components of this galaxy show fast rotation about a common axis, the minor axis. In this case, the angular momenta of the progenitors that formed these components were all aligned.
4. VCC 685: The kinematics of the GCs in VCC 685 are the most complex and tantalizing. Kinematically decoupled cores, or kinematically distinct components (KDCs), have been found in the stellar kinematics in the central regions of many galaxies. This designation refers to an abrupt kinematic change between then the inner and outer regions of a galaxy (Rix et al.1992; Mehlert et al.1998; Wernli et al. 2002; Krajnović et al. 2011; Arnold et al. 2014; Toloba et al. 2014). In VCC 685, we find evidence that the GCs in the inner and outer regions are counter-rotating with respect to one another, with the inner component roughly aligned with the stars. This suggests discrete merging events. Indeed, for stellar KDCs, gas-rich mergers are often invoked as an explanation. In this case, however, the kinematic transition happens at much larger radii than for the stellar KDCs that are traditionally discussed (although Arnold et al.2014find evidence of this behavior in some of their sample galaxies). More GC data, more stellar kinematic data at larger radii, and realistic simulations are needed to investigate the counter-rotation in this galaxy.
Lastly, we also analyze the kinematics of GCs subdivided by GC luminosity. Table 5 shows the rotation and velocity dispersion fitting results for subsamples of bright and faint GCs. We choose to divide the GC sample at the magnitude at which we have equal numbers of GCs in the two subsamples. The divided magnitude is shown in the last column of Table5. For VCC 1231, we find that the brighter GCs have significantly more rotation than the fainter ones, which are consistent with no rotation. This is possibly because the brightest GCs are more likely to be blue, and hence their kinematics mirror the blue GCs. The fainter sample contains both blue and red GCs, and
Figure 17.Comparison ofλ1Dandλ2D. The black points and the red points
represent the slow and fast rotator. The black line is a 1:1 relation. The blue line show the best fitting linear relation to the data.
Table 5
Bright and Faint GC Kinematics Fitting Results
ID Vrot,b Vrot,f Biasb Biasf σb σf PAkin,b PAkin,f g
(km s−1) (km s−1) (km s−1) (km s−1) (km s−1) (km s−1) (degree) (degree) (magnitude)
(1) (2) (3) (4) (5) (6) (7) (8) (9) (10)
VCC1231 118 ± 62 28 ± 56 17 54 171 ± 31 162 ± 30 224 ± 45 94 ± 98 22.274 VCC2000 119 ± 64 99 ± 46 20 16 138 ± 31 119 ± 27 204 ± 45 182 ± 31 22.250 VCC1062 139 ± 29 170 ± 50 8 13 77 ± 17 134 ± 28 88 ± 16 94 ± 20 22.458 Note.Column (2–9): Bright (b) and faint (f) GC kinematics results for our galaxy sample. Column (10): The divided g-band magnitude for the bright and faint group.
so their kinematics are a combination of these apparently counter-rotating populations. The other two galaxies do not show very significant differences in the rotation properties between the bright and faint GCs. VCC 1062ʼs bright GCs, however, have a noticeably lower velocity dispersion (77 ± 17 km s−1) compared to their fainter counterparts
(134 ± 28 km s−1). These differences are worth further
explora-tion in the future with larger data sets.
5.2. Specific Angular Momentum
To provide a more quantitative look at the kinematics of ETGs, we use the specific angular momentum. An early study of the M87 GC system used a dimensionless spin parameter (Kissler-Patig & Gebhardt 1998). We use the dimensionless
Table 6
General Properties of Literature Galaxies
ID Re MK D star NGC λ1D,GC,=0 λ1D,GC,=star Rotation References
(kpc) (mag) (Mpc) <1Re (1) (2) (3) (4) (5) (6) (7) (8) (9) (10) NGC 4494 4.3 −24.2 16.6 0.13 117 0.46 ± 0.04 0.48 ± 0.04 F F + 11 NGC 3379 2.0 −23.7 10.2 0.15 52 0.10 ± 0.03 0.13 ± 0.03 F P + 04; P + 06; B + 06 NGC 4636 6.1 −24.3 14.2 0.16 459 0.21 ± 0.02 0.22 ± 0.02 S S + 12 NGC 4472 (VCC 1226, M49) 7.7 −25.6 16.7 0.19 263 0.17 ± 0.04 0.22 ± 0.05 S C + 03 NGC 4649 (VCC 1978, M60) 7.7 −25.3 16.3 0.19 121 0.53 ± 0.02 0.56 ± 0.02 F H + 08 NGC 4486 (VCC 1316, M87) 13.1 −25.3 16.5 0.14 1004 0.20 ± 0.01 0.19 ± 0.01 S S + 11; Z + 15a
Note.The effective radii (2) are from Ferrarese et al. (2006) and Emsellem et al. (2011). The K-band absolute magnitude (3) and distance (4) are from Pota et al. (2013), Tables1and7, where (3) is derived from 2MASS apparent magnitude and (4) are from Tonry et al. (2001) and Mei et al. (2007). (5) is the ellipticity with
b a
1−( )k, where the axis ratio are from 2MASS. (6) is the total number of GCs with measured radial velocities. (7) and (8) are the projected specific angular
momentum with=0and=star. (9) Whether a galaxy is classified as a fast or slow rotator in ATLAS3D(Emsellem et al.2011). (10) References: F + 11(Foster
et al.2011) ; P + 04(Puzia et al.2004); P + 06 (Pierce et al.2006); B + 06(Bergond et al.2006); S + 12(Schuberth et al.2012); C + 03(Côté et al.2003); H + 08 (Hwang et al.2008); S + 11(Strader et al.2011); Z + 15(Zhang et al.2015).
aNew GC data from our MMT observations, described by Zhang et al. (2015
), are combined with previously published data. Table 7
Specific Angular Momentum
ID λ2D λ1D λ1D λ1D,GC,=0 λ1D,GC,=star (SAURON) (SAURON) (GDL) (GCs) (GCs) (1) (2) (3) (4) (5) (6) VCC1231 0.23 0.34 0.17 ± 0.02 0.04 ± 0.04 0.08 ± 0.06 VCC2000 0.55 0.70 0.49 ± 0.02 0.30 ± 0.06 0.32 ± 0.06 VCC1062 0.36 0.51 0.84 ± 0.01 0.82 ± 0.03 0.88 ± 0.02
Note.(2)λ2Dmeasurement from SAURON data, (3)λ1Dmeasurement from SAURON data, (4)λ1Dmeasurement from Gemini (GDL), (5) and (6)λ1D,GCfor the
GCs assuming different ellipticities. The uncertainties for the SAURON data are very small, and they are not listed in the table.
Figure 18.Specific angular momentum of GCs and SAURON data as function of ellipticity. The red circles represent theλ1D of the GC. The blue circles
represent theλ1Dof the SAURON data. The dash lines link the same galaxy.
The solid line isλ1D=0.38× . Most stellar slow rotators also show slow rotation in their GC systems, withλGC∼0.2. Stellar fast rotators display a large range inλGC.
Figure 19.λ1Dand the ellipticity profiles as radius for VCC 1231, 2000, and
1062. In the top panel, the solid curve represents theλ1Dprofile measurements
from SAURON data. The dash curve represents theλ1Dprofile measurement
from the GDL. The individualλ1D profiles (SAURON and GDL) are each
cumulative with radius, but the two data sets are treated separately to allow for a comparison.
Table 8 Globular Cluster
ID R.A.(J2000) Decl.(J2000) vlos g z g − z E(B − V)
(deg) (deg) (km s−1) (mag) (mag) (mag) (mag)
(1) (2) (3) (4) (5) (6) (7) (8) VCC 1231 VCC1231GC-01 187.420170 13.436530 2450 ± 19 21.280 ± 0.016 20.229 ± 0.024 0.991 ± 0.007 0.028 VCC1231GC-02 187.422675 13.437170 2107 ± 22 21.960 ± 0.026 20.922 ± 0.029 0.973 ± 0.033 0.028 VCC1231GC-03 187.428810 13.436997 2377 ± 20 22.192 ± 0.022 20.893 ± 0.020 1.253 ± 0.028 0.028 VCC1231GC-04 187.413315 13.420913 2429 ± 15 22.233 ± 0.030 20.788 ± 0.019 1.374 ± 0.024 0.028 VCC1231GC-05 187.418970 13.424147 2357 ± 17 23.033 ± 0.032 22.196 ± 0.031 0.817 ± 0.022 0.028 VCC1231GC-06 187.411215 13.419499 2229 ± 21 23.147 ± 0.038 22.185 ± 0.031 0.907 ± 0.025 0.028 VCC1231GC-07 187.405065 13.453014 2007 ± 18 22.096 ± 0.007 21.359 ± 0.016 0.703 ± 0.012 0.028 VCC1231GC-08 187.429815 13.401846 2058 ± 49 22.933 ± 0.013 22.271 ± 0.037 0.551 ± 0.030 0.028 VCC1231GC-09 187.432710 13.444921 2282 ± 20 22.855 ± 0.022 21.790 ± 0.021 1.018 ± 0.025 0.028 VCC1231GC-10 187.441245 13.429025 2435 ± 28 21.842 ± 0.037 20.977 ± 0.018 0.799 ± 0.039 0.028 VCC1231GC-11 187.437780 13.422738 2599 ± 24 21.821 ± 0.012 20.903 ± 0.020 0.832 ± 0.019 0.028 VCC1231GC-12 187.447410 13.432945 2324 ± 20 21.209 ± 0.029 20.154 ± 0.020 0.992 ± 0.028 0.028 VCC1231GC-13 187.450110 13.433290 2533 ± 21 21.813 ± 0.019 20.817 ± 0.012 0.946 ± 0.020 0.028 VCC1231GC-14 187.454700 13.403273 2250 ± 24 22.485 ± 0.018 21.570 ± 0.016 0.871 ± 0.022 0.028 VCC1231GC-15 187.452990 13.445077 2356 ± 20 21.861 ± 0.017 20.343 ± 0.013 1.436 ± 0.016 0.028 VCC1231GC-16 187.456470 13.424834 2389 ± 27 22.005 ± 0.020 20.962 ± 0.015 0.990 ± 0.021 0.028 VCC1231GC-17 187.463295 13.427741 2367 ± 17 21.306 ± 0.014 20.320 ± 0.017 0.920 ± 0.019 0.028 VCC1231GC-18 187.474695 13.439762 2151 ± 26 22.359 ± 0.022 21.412 ± 0.016 0.885 ± 0.022 0.028 VCC1231GC-19 187.468155 13.427391 2523 ± 17 21.806 ± 0.032 20.469 ± 0.011 1.274 ± 0.028 0.028 VCC1231GC-20 187.475715 13.426306 2107 ± 29 22.550 ± 0.020 21.521 ± 0.019 0.967 ± 0.022 0.028 VCC1231GC-21 187.469025 13.435520 2337 ± 20 22.932 ± 0.025 21.607 ± 0.014 1.278 ± 0.024 0.028 VCC1231GC-22 187.479150 13.444892 2148 ± 23 22.673 ± 0.023 21.639 ± 0.015 1.014 ± 0.026 0.028 VCC1231GC-23 187.485810 13.446020 2412 ± 15 21.166 ± 0.032 20.194 ± 0.022 0.880 ± 0.022 0.028 VCC1231GC-24 187.496295 13.436360 2200 ± 11 21.183 ± 0.004 20.467 ± 0.008 0.647 ± 0.007 0.028 VCC1231GC-25 187.429695 13.433433 1909 ± 15 22.667 ± 0.017 21.218 ± 0.019 1.384 ± 0.019 0.028 VCC1231GC-26 187.424715 13.427611 1988 ± 23 22.616 ± 0.017 21.261 ± 0.018 1.294 ± 0.019 0.028 VCC1231GC-27 187.422900 13.414083 2226 ± 26 22.785 ± 0.056 21.737 ± 0.062 0.909 ± 0.021 0.028 VCC1231GC-28 187.422360 13.402969 2364 ± 14 21.274 ± 0.003 20.445 ± 0.007 0.763 ± 0.006 0.028 VCC1231GC-29 187.450515 13.431453 2198 ± 31 21.206 ± 0.014 20.287 ± 0.018 0.849 ± 0.014 0.028 VCC1231GC-30 187.447620 13.429241 2418 ± 23 21.843 ± 0.025 20.514 ± 0.016 1.262 ± 0.027 0.028 VCC1231GC-31 187.442595 13.426672 2151 ± 20 21.411 ± 0.016 20.467 ± 0.013 0.876 ± 0.015 0.028 VCC1231GC-32 187.461765 13.411035 2351 ± 16 22.139 ± 0.080 21.053 ± 0.022 0.999 ± 0.074 0.028 VCC1231GC-33 187.434585 13.434356 2397 ± 16 22.953 ± 0.027 21.884 ± 0.025 0.990 ± 0.025 0.028 VCC1231GC-34 187.444185 13.431620 2155 ± 69 22.671 ± 0.023 21.758 ± 0.023 0.826 ± 0.023 0.028 VCC1231GC-35 187.457610 13.433330 2013 ± 24 22.274 ± 0.020 21.276 ± 0.020 0.931 ± 0.023 0.028 VCC1231GC-36 187.452285 13.459685 2012 ± 38 22.952 ± 0.034 21.852 ± 0.026 1.031 ± 0.031 0.028 VCC1231GC-37 187.460490 13.472438 2140 ± 21 21.361 ± 0.005 20.300 ± 0.007 1.046 ± 0.006 0.028 VCC1231GC-38 187.473540 13.428547 2033 ± 35 22.964 ± 0.053 22.082 ± 0.042 0.821 ± 0.064 0.028 VCC1231GC-39 187.493505 13.426348 1929 ± 34 20.809 ± 0.002 19.955 ± 0.005 0.755 ± 0.005 0.028 VCC1231GC-40 187.428210 13.420699 2371 ± 32 23.131 ± 0.017 21.801 ± 0.012 1.271 ± 0.019 0.028 VCC1231GC-41 187.429515 13.423301 2199 ± 48 23.347 ± 0.025 22.404 ± 0.022 0.885 ± 0.029 0.028 VCC1231GC-42 187.451670 13.442974 2538 ± 16 22.347 ± 0.016 21.181 ± 0.025 1.114 ± 0.029 0.028 VCC1231GC-43 187.457820 13.406286 2272 ± 15 21.564 ± 0.016 20.385 ± 0.018 1.075 ± 0.014 0.028 VCC1231GC-44 187.465260 13.417413 2467 ± 11 20.955 ± 0.024 19.776 ± 0.012 1.126 ± 0.023 0.028 VCC1231GC-45 187.453365 13.425970 2230 ± 14 21.304 ± 0.021 20.272 ± 0.015 0.957 ± 0.017 0.028 VCC1231GC-46 187.438560 13.435633 2014 ± 17 22.761 ± 0.015 21.614 ± 0.020 1.070 ± 0.020 0.028 VCC1231GC-47 187.445190 13.432550 2213 ± 36 23.151 ± 0.026 21.727 ± 0.022 1.358 ± 0.031 0.028 VCC1231GC-48 187.461540 13.434665 2125 ± 27 22.784 ± 0.024 21.886 ± 0.016 0.837 ± 0.026 0.028 VCC1231GC-49 187.474830 13.443451 2450 ± 20 22.730 ± 0.021 21.425 ± 0.020 1.236 ± 0.026 0.028 VCC1231GC-50 187.468185 13.430573 2459 ± 38 23.187 ± 0.015 21.905 ± 0.026 1.206 ± 0.021 0.028 VCC1231GC-51 187.476593 13.420838 2161 ± 24 22.740 ± 0.012 21.886 ± 0.028 0.678 ± 0.021 0.028 VCC 2000 VCC2000GC-01 191.092740 11.213082 1081 ± 12 20.572 ± 0.002 19.893 ± 0.005 0.611 ± 0.004 0.034 VCC2000GC-02 191.122215 11.219080 949 ± 42 22.741 ± 0.027 21.912 ± 0.027 0.778 ± 0.025 0.034 VCC2000GC-03 191.125230 11.215344 907 ± 28 22.478 ± 0.029 21.556 ± 0.029 0.906 ± 0.022 0.034 VCC2000GC-04 191.128680 11.213797 1016 ± 19 22.727 ± 0.066 21.802 ± 0.052 0.889 ± 0.028 0.034 VCC2000GC-05 191.109285 11.205482 920 ± 17 21.151 ± 0.015 20.243 ± 0.014 0.889 ± 0.022 0.034 VCC2000GC-06 191.138010 11.200358 1074 ± 24 22.548 ± 0.069 21.258 ± 0.023 1.181 ± 0.070 0.034 VCC2000GC-07 191.135130 11.198518 789 ± 22 21.885 ± 0.032 20.882 ± 0.063 0.863 ± 0.032 0.034
Table 8 (Continued)
ID R.A.(J2000) Decl.(J2000) vlos g z g − z E(B − V)
(deg) (deg) (km s−1) (mag) (mag) (mag) (mag)
(1) (2) (3) (4) (5) (6) (7) (8) VCC2000GC-08 191.131050 11.197987 917 ± 33 22.523 ± 0.032 21.546 ± 0.013 0.895 ± 0.035 0.034 VCC2000GC-09 191.114865 11.196526 1009 ± 18 22.778 ± 0.027 21.642 ± 0.014 1.071 ± 0.028 0.034 VCC2000GC-10 191.149545 11.201708 990 ± 25 22.250 ± 0.023 21.305 ± 0.020 0.888 ± 0.025 0.034 VCC2000GC-11 191.143635 11.196664 1344 ± 48 22.456 ± 0.036 21.622 ± 0.029 0.760 ± 0.031 0.034 VCC2000GC-12 191.140995 11.196223 1263 ± 42 22.247 ± 0.019 21.427 ± 0.014 0.752 ± 0.020 0.034 VCC2000GC-13 191.146065 11.194601 1133 ± 17 22.156 ± 0.019 20.993 ± 0.015 1.116 ± 0.021 0.034 VCC2000GC-14 191.151405 11.193774 972 ± 78 22.561 ± 0.020 21.807 ± 0.013 0.705 ± 0.022 0.034 VCC2000GC-15 191.167200 11.189954 1085 ± 28 21.389 ± 0.004 20.758 ± 0.011 0.576 ± 0.007 0.034 VCC2000GC-16 191.119545 11.199561 1171 ± 22 22.462 ± 0.017 21.455 ± 0.015 0.959 ± 0.019 0.034 VCC2000GC-17 191.125890 11.190406 1250 ± 18 22.211 ± 0.033 20.846 ± 0.015 1.279 ± 0.025 0.034 VCC2000GC-18 191.107575 11.187544 982 ± 31 22.356 ± 0.015 21.531 ± 0.021 0.742 ± 0.021 0.034 VCC2000GC-19 191.123100 11.191837 1267 ± 15 21.029 ± 0.024 20.032 ± 0.022 0.907 ± 0.021 0.034 VCC2000GC-20 191.129370 11.193860 1270 ± 19 21.611 ± 0.027 20.632 ± 0.019 0.903 ± 0.011 0.034 VCC2000GC-21 191.111385 11.195764 1214 ± 43 23.032 ± 0.029 22.234 ± 0.030 0.719 ± 0.034 0.034 VCC2000GC-22 191.141985 11.195713 921 ± 27 22.467 ± 0.032 21.466 ± 0.018 0.942 ± 0.033 0.034 VCC2000GC-23 191.138505 11.193366 841 ± 17 21.266 ± 0.019 20.263 ± 0.013 0.933 ± 0.017 0.034 VCC2000GC-24 191.146710 11.191358 1022 ± 18 20.553 ± 0.058 19.691 ± 0.052 0.787 ± 0.023 0.034 VCC2000GC-25 191.155815 11.187847 982 ± 23 21.848 ± 0.029 20.955 ± 0.023 0.870 ± 0.031 0.034 VCC2000GC-26 191.150445 11.183163 942 ± 21 21.543 ± 0.031 20.743 ± 0.034 0.731 ± 0.011 0.034 VCC2000GC-27 191.145060 11.197882 863 ± 28 22.877 ± 0.024 22.085 ± 0.020 0.729 ± 0.026 0.034 VCC2000GC-28 191.159205 11.174632 1154 ± 24 21.152 ± 0.003 20.439 ± 0.008 0.635 ± 0.006 0.034 VCC2000GC-29 191.138430 11.210131 760 ± 32 22.579 ± 0.030 21.743 ± 0.021 0.768 ± 0.026 0.034 VCC2000GC-30 191.127015 11.186158 1095 ± 29 22.510 ± 0.032 21.358 ± 0.017 1.079 ± 0.024 0.034 VCC2000GC-31 191.119665 11.189951 845 ± 16 20.777 ± 0.022 19.771 ± 0.019 0.937 ± 0.022 0.034 VCC2000GC-32 191.130135 11.184649 1261 ± 19 21.572 ± 0.020 20.567 ± 0.008 0.900 ± 0.019 0.034 VCC2000GC-33 191.133315 11.183667 1010 ± 27 22.594 ± 0.032 21.563 ± 0.024 0.970 ± 0.036 0.034 VCC2000GC-34 191.110065 11.210609 1112 ± 33 22.839 ± 0.022 22.013 ± 0.020 0.825 ± 0.023 0.034 VCC2000GC-35 191.122260 11.178163 1087 ± 28 22.925 ± 0.038 21.779 ± 0.016 1.083 ± 0.035 0.034 VCC2000GC-36 191.116050 11.230333 1109 ± 20 20.599 ± 0.002 19.878 ± 0.006 0.629 ± 0.004 0.034 VCC2000GC-37 191.140260 11.163837 1189 ± 26 22.380 ± 0.012 21.439 ± 0.014 0.902 ± 0.016 0.034 VCC2000GC-38 191.138190 11.176321 1004 ± 38 21.193 ± 0.030 20.322 ± 0.026 0.792 ± 0.017 0.034 VCC2000GC-39 191.147055 11.198483 1149 ± 43 23.000 ± 0.026 22.169 ± 0.025 0.777 ± 0.023 0.034 VCC2000GC-40 191.146830 11.172589 970 ± 56 23.030 ± 0.033 22.174 ± 0.033 0.809 ± 0.024 0.034 VCC2000GC-41 191.155275 11.201397 1060 ± 14 21.365 ± 0.015 20.465 ± 0.011 0.851 ± 0.013 0.034 VCC2000GC-42 191.161890 11.205892 1086 ± 22 22.710 ± 0.037 21.815 ± 0.026 0.843 ± 0.031 0.034 VCC2000GC-43 191.167455 11.181426 942 ± 37 22.561 ± 0.010 21.812 ± 0.028 0.658 ± 0.019 0.034 VCC 1062 VCC1062GC-01 187.040970 9.794455 683 ± 12 22.890 ± 0.020 21.534 ± 0.020 1.325 ± 0.023 0.022 VCC1062GC-02 187.000530 9.817132 444 ± 19 21.895 ± 0.013 20.964 ± 0.013 0.886 ± 0.014 0.022 VCC1062GC-03 187.004025 9.816408 512 ± 23 22.575 ± 0.045 21.757 ± 0.062 0.729 ± 0.060 0.022 VCC1062GC-04 186.995685 9.807220 306 ± 18 24.395 ± 0.038 23.127 ± 0.057 1.231 ± 0.059 0.022 VCC1062GC-05 186.999240 9.805346 518 ± 15 21.978 ± 0.024 21.020 ± 0.018 0.902 ± 0.022 0.022 VCC1062GC-06 186.989805 9.792907 342 ± 21 22.503 ± 0.029 21.568 ± 0.029 0.859 ± 0.023 0.022 VCC1062GC-07 186.991335 9.802511 229 ± 30 23.130 ± 0.020 22.134 ± 0.022 0.980 ± 0.023 0.022 VCC1062GC-08 186.985650 9.798775 326 ± 21 22.977 ± 0.016 21.823 ± 0.026 1.109 ± 0.020 0.022 VCC1062GC-09 187.012260 9.817571 421 ± 21 22.418 ± 0.012 21.570 ± 0.025 0.791 ± 0.017 0.022 VCC1062GC-10 187.009785 9.810227 417 ± 21 22.582 ± 0.021 21.196 ± 0.017 1.305 ± 0.023 0.022 VCC1062GC-11 187.017090 9.809849 619 ± 18 22.279 ± 0.023 21.295 ± 0.017 0.908 ± 0.020 0.022 VCC1062GC-12 187.026240 9.811627 595 ± 23 21.870 ± 0.032 20.928 ± 0.051 0.805 ± 0.021 0.022 VCC1062GC-13 187.025115 9.796717 679 ± 20 21.588 ± 0.025 20.716 ± 0.038 0.778 ± 0.017 0.022 VCC1062GC-14 187.037430 9.792029 516 ± 13 21.699 ± 0.017 20.740 ± 0.012 0.914 ± 0.020 0.022 VCC1062GC-15 187.030080 9.811315 547 ± 18 22.869 ± 0.026 21.944 ± 0.024 0.891 ± 0.021 0.022 VCC1062GC-16 187.047585 9.805256 583 ± 17 22.437 ± 0.021 21.309 ± 0.016 1.088 ± 0.021 0.022 VCC1062GC-17 187.044615 9.816442 301 ± 25 22.926 ± 0.020 21.979 ± 0.015 0.900 ± 0.022 0.022 VCC1062GC-18 187.054260 9.809342 645 ± 21 23.102 ± 0.038 21.681 ± 0.027 1.413 ± 0.025 0.022 VCC1062GC-19 187.000560 9.796535 380 ± 19 22.458 ± 0.039 20.965 ± 0.037 1.487 ± 0.020 0.022 VCC1062GC-20 187.005885 9.798541 472 ± 17 22.254 ± 0.049 20.662 ± 0.061 1.482 ± 0.033 0.022 VCC1062GC-21 186.994635 9.807293 309 ± 21 22.574 ± 0.020 21.113 ± 0.018 1.414 ± 0.022 0.022 VCC1062GC-22 187.003020 9.802365 279 ± 11 21.228 ± 0.017 20.009 ± 0.020 1.165 ± 0.019 0.022 VCC1062GC-23 186.999375 9.790121 234 ± 18 23.134 ± 0.033 22.105 ± 0.017 1.038 ± 0.030 0.022
parameter defined by Emsellem et al. (2007) to distinguish fast and slow rotators based on SAURON data within 1Re. The expression for λ is given by:
R F V R F V (8) i i i i i i2 i2 λ σ = ∑ ∑ +
where Fi, Ri, Vi, and σi are the flux, radius, velocity, and velocity dispersion in the ith bin, respectively. Emsellem et al. (2011) define the dividing line between slow and fast rotators at
0.31 (9)
λ= ×
where ϵ is the ellipticity of the system. However, Emsellem et al. (2011)ʼs IFU study of ETG specific angular momentum was generally limited to stars within≲1Re.
Unlike for filled IFU observations, our GC and GDL data only sparsely sample the outer halos of our sample galaxies. The density of our data, therefore, is not an exact representation
of the true density of the GC or stars. Therefore, rather than sum over the full 2D velocity field, which we do not have, we calculate λ in one-dimension as follows. (1) Through our kinematic fitting, we obtain the rotation velocity and velocity dispersion profile with radius. This is done in elliptical annuli whose ellipticities are alternately set to two values: zero and the mean ellipticity of the stars. (2) For every bin in radius, we replace Fiin Equation (8) with the number of GCs expected at that radius, and use the rotation velocity at that radius. We call the λ calculated in this way λ . There is certainly a bias in1D
using a one-dimensional (1D) method compared to λ calculated with full 2D data (which we now call λ2D). This
bias is due to the fact that the 1D method assigns the peak velocity amplitude to every position at a given radius. In reality, the velocity along the minor axis will be smaller than along the major axis. We can calibrate this bias, however, by comparing λ1D and λ2D for galaxies where we have full IFU
coverage. To do this, we apply our 1D method to the 260 ETG galaxies from ATLAS3D. The result is shown in Figure17. We
Table 8 (Continued)
ID R.A.(J2000) Decl.(J2000) vlos g z g − z E(B − V)
(deg) (deg) (km s−1) (mag) (mag) (mag) (mag)
(1) (2) (3) (4) (5) (6) (7) (8) VCC1062GC-24 186.986835 9.806428 311 ± 14 22.979 ± 0.016 21.892 ± 0.028 1.094 ± 0.019 0.022 VCC1062GC-25 187.014075 9.808210 461 ± 19 22.665 ± 0.033 21.234 ± 0.024 1.293 ± 0.017 0.022 VCC1062GC-26 187.018665 9.791675 486 ± 13 21.268 ± 0.019 20.328 ± 0.015 0.859 ± 0.019 0.022 VCC1062GC-27 187.012890 9.792312 310 ± 18 22.946 ± 0.019 21.573 ± 0.021 1.289 ± 0.020 0.022 VCC1062GC-28 187.028310 9.813976 605 ± 19 22.592 ± 0.020 21.547 ± 0.017 0.991 ± 0.018 0.022 VCC1062GC-29 187.037685 9.798342 743 ± 19 21.771 ± 0.058 20.911 ± 0.051 0.866 ± 0.016 0.022 VCC1062GC-30 187.025085 9.798357 488 ± 57 23.113 ± 0.030 22.145 ± 0.051 0.866 ± 0.037 0.022 VCC1062GC-31 187.050615 9.787901 648 ± 17 22.409 ± 0.009 21.621 ± 0.021 0.718 ± 0.015 0.022 VCC1062GC-32 187.067940 9.802051 567 ± 11 21.506 ± 0.004 20.749 ± 0.010 0.720 ± 0.007 0.022 VCC1062GC-33 187.004535 9.801900 281 ± 12 24.777 ± 0.062 23.460 ± 0.066 1.271 ± 0.068 0.022 VCC1062GC-34 187.011405 9.804032 401 ± 11 21.189 ± 0.016 20.091 ± 0.020 1.012 ± 0.016 0.022 VCC1062GC-35 187.018740 9.803278 569 ± 24 21.804 ± 0.017 20.602 ± 0.019 1.157 ± 0.021 0.022 VCC1062GC-36 187.026120 9.804276 717 ± 18 22.399 ± 0.021 21.325 ± 0.021 1.002 ± 0.024 0.022 VCC1062GC-37 187.023465 9.805268 414 ± 23 22.974 ± 0.022 21.496 ± 0.045 1.366 ± 0.030 0.022 VCC1062GC-38 187.036740 9.806686 757 ± 15 22.842 ± 0.027 21.257 ± 0.025 1.534 ± 0.033 0.022 VCC1062GC-39 187.001925 9.804249 336 ± 10 20.526 ± 0.020 19.357 ± 0.023 1.111 ± 0.023 0.022 VCC1062GC-40 186.992850 9.808851 287 ± 18 22.179 ± 0.008 21.139 ± 0.014 0.991 ± 0.011 0.022 VCC 685 VCC685GC-01 185.989590 16.651251 1341 ± 24 22.262 ± 0.008 21.616 ± 0.026 0.609 ± 0.017 0.028 VCC685GC-02 185.959680 16.679079 1334 ± 27 22.130 ± 0.021 21.205 ± 0.014 0.868 ± 0.019 0.028 VCC685GC-03 185.975325 16.684580 1422 ± 22 21.954 ± 0.014 20.998 ± 0.011 0.897 ± 0.016 0.028 VCC685GC-04 185.978040 16.679291 1285 ± 31 22.256 ± 0.014 21.422 ± 0.017 0.754 ± 0.017 0.028 VCC685GC-05 185.988135 16.683411 918 ± 42 22.367 ± 0.021 21.238 ± 0.022 1.021 ± 0.016 0.028 VCC685GC-06 185.985465 16.692770 1025 ± 23 21.566 ± 0.019 20.658 ± 0.017 0.844 ± 0.010 0.028 VCC685GC-07 185.989155 16.688009 1062 ± 28 21.987 ± 0.026 21.125 ± 0.018 0.811 ± 0.024 0.028 VCC685GC-08 185.989965 16.701780 1168 ± 14 21.484 ± 0.021 20.311 ± 0.013 1.115 ± 0.023 0.028 VCC685GC-09 185.991735 16.694599 1588 ± 17 21.529 ± 0.012 20.532 ± 0.018 0.903 ± 0.017 0.028 VCC685GC-10 185.994150 16.696199 1520 ± 38 21.916 ± 0.023 20.950 ± 0.028 0.910 ± 0.018 0.028 VCC685GC-11 185.991225 16.709190 1343 ± 21 20.597 ± 0.018 19.737 ± 0.012 0.811 ± 0.006 0.028 VCC685GC-12 185.997015 16.701620 1178 ± 22 21.662 ± 0.016 20.724 ± 0.012 0.878 ± 0.020 0.028 VCC685GC-13 185.996025 16.711010 1208 ± 15 21.145 ± 0.015 19.992 ± 0.012 1.084 ± 0.017 0.028 VCC685GC-14 186.006900 16.716101 925 ± 33 22.649 ± 0.019 21.725 ± 0.015 0.871 ± 0.021 0.028 VCC685GC-15 186.000240 16.730289 1098 ± 31 21.078 ± 0.003 20.493 ± 0.012 0.508 ± 0.008 0.028 Note. Column (1): Object ID; Column (2): Right ascension in decimal degrees (J2000); Column (3): Declination in decimal degrees (J2000); Column (4): Heliocentric radial velocity and uncertainty; Columns.(5,6): g and z band magnitudes from the ACSVCS and NGVS (not corrected for Galactic extinction); Column (7): g−zcolor; Column (8): The Galactic reddening determined by Schlegel et al. (1998). The corrections for foreground reddening were taken to be