HAL Id: hal-01819020
https://hal.archives-ouvertes.fr/hal-01819020
Submitted on 19 Jun 2018
HAL is a multi-disciplinary open access
archive for the deposit and dissemination of
sci-entific research documents, whether they are
pub-lished or not. The documents may come from
teaching and research institutions in France or
abroad, or from public or private research centers.
L’archive ouverte pluridisciplinaire HAL, est
destinée au dépôt et à la diffusion de documents
scientifiques de niveau recherche, publiés ou non,
émanant des établissements d’enseignement et de
recherche français ou étrangers, des laboratoires
publics ou privés.
Continuous improvement of HSM process by data
mining
Victor Godreau, Mathieu Ritou, Etienne Chové, Benoit Furet, Didier Dumur
To cite this version:
Victor Godreau, Mathieu Ritou, Etienne Chové, Benoit Furet, Didier Dumur. Continuous
improve-ment of HSM process by data mining. Journal of Intelligent Manufacturing, Springer Verlag
(Ger-many), 2019, 30 (7), pp.2781-2788. �10.1007/s10845-018-1426-7�. �hal-01819020�
Journal of Intelligent Manufacturing https://doi.org/10.1007/s10845-018-1426-7
Continuous improvement of HSM process by data mining
Victor Godreau
1, 2, Mathieu Ritou
1*, Etienne Chové
2, Benoit Furet
1, Didier Dumur
3(mathieu.ritou@univ-nantes.fr)
1 LS2N (Laboratory of Digital Sciences of Nantes, UMR CNRS 6004), University of Nantes, 1 Quai de Tourville, 44000 Nantes, France 2 Europe Technologies, rue de la fonderie, 44470 Carquefou, France
3 L2S (Laboratory of Signals and Systems, UMR CNRS 8506), Centrale Supélec, 3 rue Joliot Curie, 91192 Gif sur Yvette, France
Abstract The efficient use of digital manufacturing data is a key leverage point of the factories of the future. Automatic analysis tools are required to provide smart and comprehensible information from large process databases collected on shopfloor machines-tools. In this paper, an original and dedicated approach is proposed for the data mining of HSM (High Speed Machining) flexible productions. It relies on an unsupervised learning (by statistical modelling of machining vibrations) for the classification of machining critical events and their aggregation. Moreover, a contextual clustering is suggested for a better data selection, and a visualization of machining KPI for decision aiding. It results in new leverages for decision making and process improvement; through automatic detection of the main faulty programs, tools or machine conditions. This analysis has been performed over two spindle lifespans (18 months) of industrial HSM production in aeronautics and results are presented, which assess the proposed approach.
Keywords: Monitoring, Machining, Data mining. 1. Introduction
A huge and increasing amount of digital data is generated in every industry and business area, and conducts to Big Data challenges [1]. If collected, the manufacturing data contains valuable information and knowledge that enables the improvement of decision making and productivity. The huge amounts of data in manufacturing databases, which contain large numbers of records, with many attributes that need to be simultaneously explored to discover useful information and knowledge, make manual analysis impractical [2]. Intelligent and automated data analysis methodologies are therefore needed.
Concerning machining, abundant digital data is also available in modern shopfloors. Most of data is not collected (notably real-time data for machine-tool control) or remains almost unused, whereas it is key leverage point for process improvement. In an Industry 4.0 approach, data from the CNC (Computer Numerical Control) and from additional sensors can be collected. Indeed, the CNC contains interesting information, concerning for example the speed and power consumption of spindle and axes, the current cutting tool and program, etc. It can be collected in the HMI [3], by field bus [4] or through standard protocols such as MTconnect [5] and OPC UA [6] (which enable interoperability).
Additional sensors also provide useful in-process information, as classically for Tool Condition Monitoring [7][8][9][10]. Then, advanced signal processing is performed; such as wavelet transform [11], statistics [12], mechanical model [13], Artificial Intelligence (e.g. neural network [14]) or Machine Learning (e.g. Bayesian network [15], support vector machine [16]). But the learnings (in machining literature) are always supervised and based on a limited number of cutting tests performed in laboratory [9][17]. No approach was conducted on months of data issued from real industrial HSM productions, with their very wide variety of workpieces and tools engagements (several thousands). It would be much more arduous and require an unsupervised learning. Indeed, generally, machining incidents (chatter occurrence or tool breakage) cannot be collected in HSM companies. Besides, most studies focus on tool monitoring and do not deal with HSM process improvement, whereas it could be an input.
Several research projects are developing solutions for in-process monitoring and data collection [18][4]. Others focus on post-machining workpiece inspection data [19]. Different architectures are proposed for the management of process digital data at shopfloor level [20][21]. However, there is a lack of data mining approach to answer to the HSM specific questions [9]. The main issues concern productivity and workpiece quality. General performance indicators, based on smart shopfloor data, are missing to ease the improvement of HSM process. It is particularly true for HSM flexible productions. For example, in aeronautics, several machines-tools produce a very large variety of high added value parts, with a large number of tools, during very long machining operations (several hours). In that case, it is difficult to identify the main cause of machining incidents that decrease productivity or quality. Therefore, a global approach based on HSM in-process data is suitable. Moreover, since a large amount of data needs to be considered; it makes impossible a manual analysis and requires a data mining approach.
In this paper, a new data mining method for the continuous improvement of HSM flexible production is introduced. The in-process monitoring and data collecting device is presented. After data selection by contextual clustering, a new data aggregation method dedicated to machining vibrations is proposed, in order to reveal the machining critical events. It relies on new monitoring criteria based on mechanical models and on their unsupervised learning through statistical modelling. Key Performance Indicators (KPI) for the cutting tool, program
and machine-tool and their visualization are then proposed. Lastly, the new data mining method is applied to an industrial HSM production database and results are presented to validate the approach.
Figure 1. Data mining method. 2. Data mining method for HSM
The proposed method for data mining in HSM follows four steps (Fig.1) which lead to the computing of KPI for the process continuous improvement. The first step collects the data. The second one is the data selection by contextual clustering. The third one aggregates data with new operators and thresholds determined by statistic modeling. The last step computes KPI from the aggregated data in order to identify the main faulty elements.
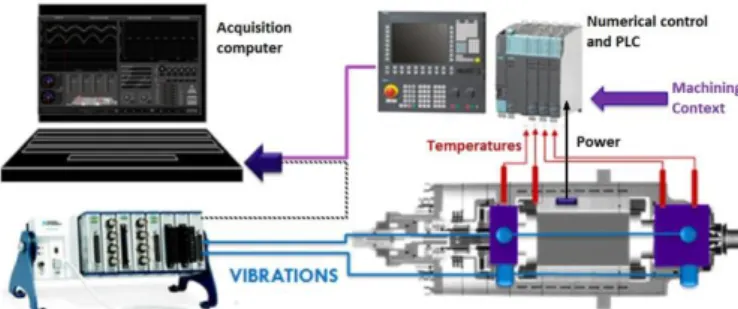
2.1. Process monitoring and data collection
A specific monitoring system was developed to perform the in-process monitoring and data collect, called EMMAtools (Fig. 2). Four accelerometers are integrated into the spindle, at the front and rear bearings, along the two radial directions. Vibration signals are measured with a National Instrument 9234 acquisition card at a sampling frequency of 50 kHz.
Beside the monitoring criteria, the system is connected to the CNC of the machine-tool by field bus. It collects complementary information related to the machining context (ID of tool and workpiece program; actual spindle speed N, spindle power P, feedrate Vf …). The system
records about one hundred parameters every 0.1 s, corresponding to 100 Mo of industrial data per day, during the whole spindle lifespan.
Figure 2. Device for process monitoring and data collection.
In order to avoid excessively big database, online signal processing is carried out, every 0.1 s on samples of 5000 points. The root mean square of the vibration velocity (VRMS) is calculated and provides information concerning
the vibration level during machining. Two machining monitoring criteria and one maintenance criterion, defined below, are also computed online.
Detection of chatter Nh: Chatter is an instable cutting phenomenon that involves unacceptable quality defect (of waviness) on the workpiece surface. In order to develop a new criterion to detect chatter a complementary experimental study was carried out. Cutting tests were performed at different spindle speeds and depths of cut in order to obtain chatter (on a Huron machine-tool with a 24 000 RPM Fischer spindle and 20mm carbide tool in aluminium alloy). The analysis of the vibration spectrum reveals that, in presence of chatter, new contributions appear at non-harmonic frequencies (of the spindle speed). Figure 3 presents an example of frequency spectrum of these instable cuts. Harmonic frequencies (in orange) are synchronous with the spindle rotation frequency and the tooth passing frequency; whereas non-harmonic ones can be related to chatter (in blue) or bearing fault frequencies (BPFO in green and yellow).
Figure 3. Example of frequency spectrum of instable machining (orange: harmonic frequencies of spindle speed ; other colours: non-harmonic frequencies).
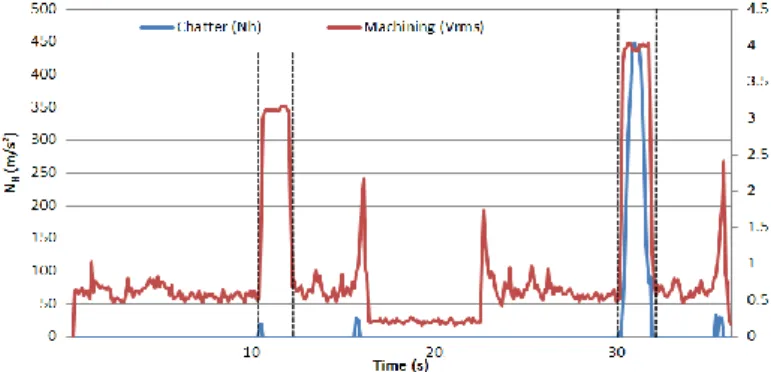
Based on these mechanical aspects, the criterion for chatter detection, noted Nh, is therefore proposed as the sum of the amplitudes of the five dominant non harmonic contributions of the vibration spectrum. To do so, the frequency spectrum is computed by Fast Fourier Transform (FFT) and order tracking is performed (through the measured spindle speed) in order to classify the harmonic and non-harmonic frequencies. An example of computation of Nh criterion is shown in Fig.4. Two successive milling operations were carried out (between the dotted lines) and the vibrations were measured. The first one is a stable cut, whereas chatter appears during the second one. The red line shows VRMS and indicates when
there is a machining, and the blue line corresponds to Nh criterion, that successfully detects chatter. Applied to around 20 cutting tests in laboratory, the criterion was shown reliable.
Figure 4. Test of chatter criterion.
Detection of tool failure Ub: For this study, two HSM databases have been studied to find a criterion that detects tool failure. A tool breakage conducts to an increase of the mechanical unbalance of the tool, which can be estimated by the vibration amplitude at the spindle frequency. The new criterion Ub is thus defined as the amplitude of the contribution at the spindle frequency, monitored in the vibration spectrum by order tracking. Ub criterion is evaluated when the spindle is rotating without cutting, to prevent from disturbances due to cutting forces. This versatile monitoring enables reliable tool failure detections during the data mining. Fig. 5 presents the results of the monitoring of 350h of industrial production, considering a given tool (32mm diameter, 2 teeth). Green lines and vertical black lines show the tool changes (because of wear or breakage), red and blue lines are the Ub criterion computed accelerometers located at the rear and front bearings of the spindle. Three tool failures can be seen on this graph at 40h, 225h and 255h. It was confirmed by further analyses in the database. Consequently, Ub criterion is validated for tool failure detection and will hence be used for the data mining in this paper.
Figure 5. Test of tool failure Ub criterion.
Spindle condition monitoring: a vibration signature is performed once a day (during idle rotations, at the same machine position and steady state operating temperature and with the same tool), during which vibrations are measured to evaluate the spindle condition. The spindle condition is evaluated through the bearing fault vibrations that appear at specific frequencies in the spectrum when an element of the bearing is damaged. It is a classical technique for condition-based maintenance [4]. The criterion for the monitoring of spindle condition, noted BPFO, is defined as the amplitude (in m/s²) of the contribution at Ball Pass Frequency of Outer ring. It is obtained by order tracking in the frequency spectrum. The BPFO frequency is easily computed from bearing geometry.
2.2. Contextual clustering
In order to increase the reliability of the analyses, a contextual clustering is performed. Indeed, accurate and sensitive monitoring criteria, as defined in the previous section, are only relevant in a given context. For example, the monitoring criterion for cutting stability Nh is only relevant during cuts and would lead to misinterpretations during idle rotations.
The evolutions of raw data of N, Vf and P are analysed and
conduct to contextual information. The spindle rotation and feedrate can be steady, transient or null. The tool can be removing material or not, with steady or transient cutting conditions. These different states are determined through thresholds, initially tuned in relation to the natural variability of N, Vf and P observed on a given machine-tool. They constitute new contextual attributes in the database. Besides, the tool and program IDs are also considered as contextual information. They enable data selection in a given context, forming new clusters.
In this way, the contextual clustering consists in the selection, in the database, of all the values of a given variable for a given machining context (for example, the unbalance Ub of a given tool during idle rotations, over a complete spindle lifespan).
2.3. Data aggregation
Data aggregation is the major issue. From the hundreds of gigaoctets of machining data, a few smart and comprehensive information need to be computed.
In the monitoring system, criteria are computed for each of the four accelerometers. In order to decrease the number of variables, resultant of criteria are computed by bearings. Finally, the mean of front and rear resultants of each criterion is retained for further analysis. The following equation illustrates the aggregation of all the accelerometers for Nh criterion. Xav and Yav refer to accelerometers at front bearing in both radial directions X and Y. Xar and Yar refer to accelerometers at rear bearing in radial directions.
Figure 6. Data organization for the aggregation.
A data structure is needed to perform the analysis (Fig.6). This structure is composed of 4 levels (raw real-time data, tool call, workpiece program and day). The raw machining data of each criterion is aggregated into a single value for
each of the three higher levels of the data organization. To do so, aggregation operators are needed.
Those operators can be simple statistic ones, like the average, standard deviation or peak value of a given signal, during a given period. In this paper, a new operator is proposed. It was notably developed to aggregate the criteria of machining vibration. In this case, a simple peak or mean value is not relevant enough because machining events, which are short in time, are hidden by other data. The idea of the aggregation operator is to sum only the critical data, i.e. the data overpassing a given critical threshold in order to highlight critical machining events.
The Criticality Operator (CO) takes into account the time and the amplitude over a given threshold. Let Xi={xi(k), k=0..n} the time series representing an ith
monitoring criterion. The operator is defined as:
with Ti the critical threshold, ti and tf the initial and final
time of the considered period and dt = 0.1s the sampling period. A second operator T is proposed. It evaluates the time during which a criteria is exceeding the critical threshold.
Figure 7. Aggregations of VRMS with 2 different critical
thresholds (TVRMS).
Figure 7 illustrates the criticality operator applied to more than 5 months of vibration levels VRMS during
machining. It is shown that, in relation to the value of critical threshold TVRMS that is chosen, different events are
revealed: long event of moderate intensity (100th, 145th
day) vs. short but severe event (129th, 141st day). If the
critical threshold is too low, events of moderate intensity become normal machining conditions.
A Machine Learning of the critical threshold is thus suitable. Unfortunately, in industry, it is generally not possible to collect labeled training data, such as the few exact instants were chatter occurred (during machining operations of several hours) and the operators cannot spend time in collecting manually such data. Consequently, an unsupervised learning is required, for the classification in two different populations: effective faulty population and normal machining population. A statistical approach is proposed in this paper for the self-calibration of the critical thresholds, in relation to the process natural variability.
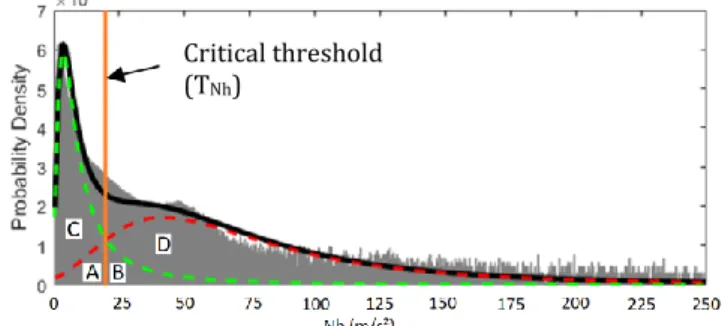
The normalized histogram of each criterion is calculated from the data selected by contextual clustering over a long period. The logarithm of the histogram is computed in
order to emphasize the critical values which may reveal the very rare faults. Then, a Maximum Likelihood Estimation (MLE) algorithm is computed to fit Probability Density Functions (PDF) on each histogram. The statistical model that was chosen is a mixture model of General Extreme Value function (GEV) with two components. The GEV function was chosen because it represents a system in which extreme values are accentuated. Two components are necessary in order to model respectively the natural noise and the expected but infrequent events. Fig. 8 presents a histogram of Nh criterion for chatter, considering the first spindle lifetime. The result of distribution fitting is in agreement with experimental data. The two GEV components suggest two populations of cuts: with (D) and without (C) chatter. Similar results are obtained with other criteria, which validate the statistical model. The critical threshold is then chosen as the abscise value where the two GEV functions cross, i.e. the point that statistically minimizes the classification errors (A and B) between the two populations [22]. In the example, a critical threshold TNh of 20m/s² is found.
Once the critical threshold is tuned, the aggregation can be computed. The contextually selected data of a given criterion is aggregated by an operator (CO or T) with the dedicated self-tuned threshold. Aggregated data consist in a limited number of relevant information that enables analyses and the evaluations of Key Performance Indicators (KPI).
As an example, let us illustrate the procedure with the CO[Nh>20m/s²] aggregation per tool. The first step is the computation of Nh from raw machining data for each accelerometer. Second step is the aggregation of the Nh criterion on the four accelerometers with the equation shown before. The third step applies the CO operator for each call of a given tool in the database, with TNh threshold
learnt by the GEV statistical model (Fig. 8). Finally, the results can be summed for a given tool; and compared to the other ones in order to know the contribution of each tool on chatter issues (Fig. 10).
Figure 8. Chatter Nh histogram, with double GEV fitting (black), composed of natural noise population (green) and chatter population (red).
2.4. Evaluation of KPI
In this study, three kinds of events are mainly considered: the occurrences of chatter, tool failures and excessive vibration levels. They are respectively revealed
Critical threshold (TNh)
by the criteria Nh, Ub and VRMS, when their critical
thresholds are exceeded.
Three faulty elements are responsible for these events: the cutting tool (tool failure or inappropriate cutting conditions), the workpiece program and the spindle condition. The effects of these faulty elements are generally coupled and difficult to identify when the numbers of tools and programs are very large, like for flexible productions. In order to be able to perform a continuous process improvement, it is important to identify the main faulty elements. To do so, an analysis of the recurrence of the problematic events is carried out, through Key Performance Indicators. Then, similarly to Pareto approach, results are sorted and the more recurrent faulty elements are identified.
A particular attention should be paid to the accurate selection of aggregated data, at this stage. A sequence is proposed, to firstly detect spindle condition issues, then tool ones and lastly program ones. In this way, for example, it is possible to select the data related to a given program, without considering a given tool which is henceforward known for its inappropriate cutting conditions.
3. Results and discussion
The new data mining method was then implemented with a real industrial database. Machining data were collected for one year and a half, during two whole spindle lifetimes, on a machine tool equipped with EMMAtools monitoring device, in an aeronautic company that machines structural parts of aluminum alloy.
In order to illustrate the data, visualizations are presented. The 39 Go database is composed of 426 days; 80 different tools were used for the machining of 534 workpiece programs.
The database corresponding to the first spindle lifetime was used to determine the critical thresholds Ti of the
monitoring criteria by unsupervised learning through the statistical modeling; enabling data aggregation. A visualization of the results of the new data mining method dedicated to HSM is presented below (following the proposed sequence of analysis and applied to the two spindle lifetimes database). Results are helpful for the continuous improvement of HSM productions.
3.1. Machine tool performance
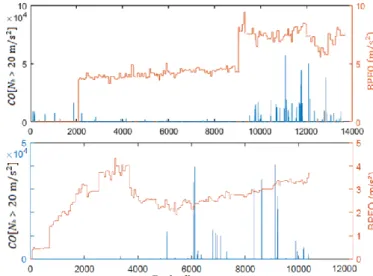
The impact of the machine-tool condition on the production was studied. The spindle condition was estimated by BPFO and the daily vibration signatures. Fig. 9 shows the evolution of BPFO (in orange) along two
complete lifetimes of spindle (in one in each graph). The critical occurrences of chatter, revealed by the aggregations CO[Nh>20m/s²] of chatter criterion Nh for each tool call (in relation to the learnt critical threshold TNh=20m/s²), are also plotted (in blue). The example
highlights that more chatters occur at the end of life of the two spindles. It means that the spindle condition has decreased the stability limit of some tools, which also confirmed by complementary dedicated tests and simulations [23].
Figure 9. Influence of spindle condition on chatter occurrences for tool n° 22, over two spindle lifetimes.
3.2. Cutting tools performance
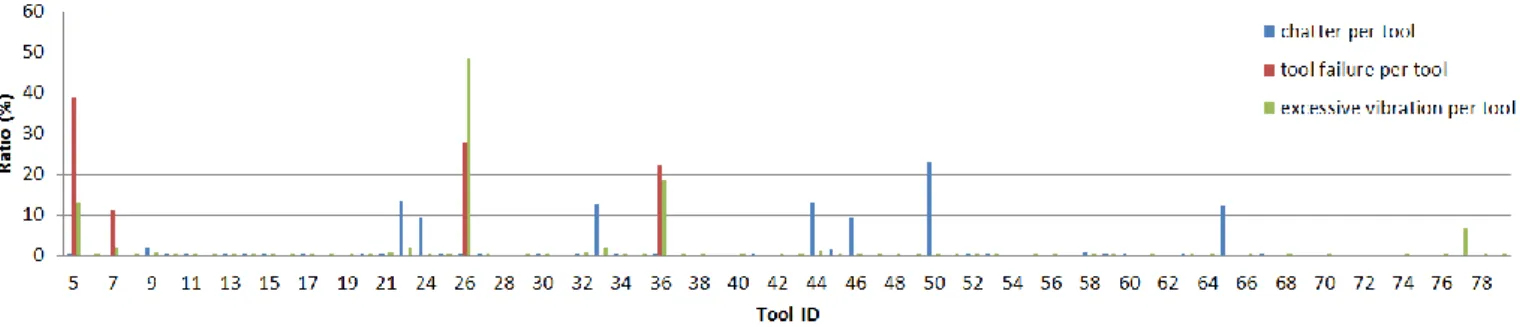
The tools performance is firstly analyzed without considering the spindle end of life that modifies the in-process behavior, i.e. corresponding data are not selected. The occurrences of chatter are aggregated with T[Nh>20m/s²] for every call of a given tool, during cuts only. From the total duration of chatter, the contribution of a given tool is expressed as a percentage. Similarly, the vibrations levels are aggregated with T[VRMS>7mm/s] for
every tool call; but without selecting the chatter occurrences and tool failures (in order to avoid redundancy of the detection). In this way, the KPI reveals the excessive forced vibrations of a given tool during cuts (that might damage the spindle). Lastly, the number of failure of a given tool is counted, with CO[Ub>7.25m/s²]. Ub is only calculated on a contextual cluster defined by non-cutting and steady spindle rotating phases.
The results are presented in Figure 13, for each tool ID. On this bar graph, it is noticeable that a few tools are involved in most of the machining issues. Most of them can be solved by optimization of the cutting conditions. Note that the tool issues should be solved before modifying any workpiece program involved in the detected problem.
Figure 10. Pie charts representing the chatter occurrences ratio per tool, with and without selecting data from the spindle end of life.
The pie charts in Figure 10 show the contributions of the different tools in chatter occurrences, if the data related to the spindle end of life is considered or not. It reveals the main faulty tools are not the same. The tool n°22 that presents limited problems when the spindle is in good condition is the most concerned tool by chatter issues when the spindle is worn. It was significantly affected by the evolution of the tool-spindle dynamic behaviour which has modified the stability limit.
3.3. Workpiece programs performance
In this section, data related to tools previously identified as faulty and chatter occurring during spindle end of life, is not selected for the aggregation. In this way, workpiece faulty programs can be detected.
The two pie charts presented in Figure 11 show workpiece programs that should be promptly modified. The half of the time with excessive vibrations can be solved by programing again only three references: n°149, 94, 142 (Fig. 11a); and 6 programs should be modified to obtain the same improvement rate concerning chatter (Fig. 11b).
Figure 11. Pie charts representing the faulty workpiece programs in terms of excessive forced vibrations (a) and chatter (b).
3.4 Production performance
There is a strong industrial interest for the rate of machine use. Note that the factory where data were collected works in a three-shift system, five days a week. The contextual clustering enables to determine when the machine-tool is stopped (in red) or moving; and removing material or not (in pink). Then, during machining, cutting tools dedicated to rough or finishing milling operations can be aggregated separately. In this way, the real rate of machine use can be obtained (see Fig. 12)
It can be noticed that only 38% of the spindle lifetime has been spent in machining. The total times of rough and finish milling operations are relatively similar.
Figure 12. Machine use rate during the complete spindle lifetime.
4. Conclusion
In this paper, a new data mining method is proposed for the continuous improvement of HSM flexible productions. It relies on an unsupervised learning (by statistical modelling of machining vibrations) for the classification of machining critical events and their aggregation; the contextual clustering for a better data selection; and the visualization of machining KPI for decision aiding.
Firstly, the data collection device was presented. New machining mechanics-based monitoring criteria were defined for the detection of chatter, tool failure and excessive vibrations. A contextual clustering enables a more relevant data selection, based on natural variability Figure 13. Ratios per tool for failures, durations of chatter and excessive cutting vibrations (in order to highlight faulty tools).
of the process. A new operator was proposed for the aggregation of machining vibrations, based on a critical threshold. It is self-tuned by statistical modelling (by MLE with 2 GEV components).
Then, it automatically evaluates machining Key Performance Indicators from aggregated data. Lastly, recurrent events are analysed in order to reveal the main faulty elements to enable process improvement and decision making.
The method was then applied to two industrial HSM databases of 18 months. It notably revealed the impact of spindle condition on cutting stability. It also highlighted the main faulty tools and workpiece programs, as well as the machine use rate.
As a perspective, this machine learning method could be extended for real time monitoring and predictive maintenance.
Acknowledgement
The financial support of the French government on FUI QuaUsi and ANR SmartEmma (ANR-16-CE10-0005) is acknowledged. The authors also thank the contributions of the industrial partners.
References
[1] Jin, X., Wah, B.W., Cheng, X., Wang, Y., 2015, Significance and Challenges of Big Data Research, Big Data Research, 2:59–64.
[2] Choudhary, A.K., Harding, J.A., Tiwari, M.K., 2009, Data mining in manufacturing: a review based on the kind of knowledge, Journal of Intelligent Manufacturing, 20/5:501-521.
[3] Brecher, C., Quintana, G., Rudolf, T., 2011, Use of NC kernel data for surface roughness monitoring in milling operations, International Journal of Advanced Manufacturing Technology, 53:953-962.
[4] de Castelbajac, C., Ritou, M., Laporte, S., Furet, B., 2014, Monitoring of distributed defects on HSM spindle bearings, Applied Acoustics, 77:159-168.
[5] Vijayaraghavan, A., Huet, L., Dornfeld, D., Sobel, W., Blomquist, B., Conley, M., 2009, Process Planning and Verification with MTConnect, Transactions of NAMRI/SMI 37.
[6] IEC 62541-1, 2016, OPC unified architecture - Part 1: Overview and concepts, International Electrotechnical Commission.
[7] Chen, J.C., 2000, An effective fuzzy-nets training scheme for monitoring tool breakage, Journal of Intelligent Manufacturing, 11(1), 85-101.
[8] Teti, R., Jemielniak, K., O’Donnell, G., Dornfeld, D., 2010, Advanced Monitoring of Machining Operations, Annals of the CIRP, 59/2:717-739.
[9] Abellan-Nebot, J.V., Romero Subirón, F., 2010, A review of machining monitoring systems based on artificial intelligence process models, International Journal of Advanced Manufacturing Technology, 47/1:1-21.
[10] Lauro, C.H., Brandão, L.C., Baldo, D., Reis, R.A., Davim, J.P., 2014, Monitoring and processing signal applied in machining processes–a review, Measurement, 58:73-86. [11] Tangjitsitcharoen, S., Saksri, T., Ratanakuakangwan, S., 2015, Advance in chatter detection in ball end milling process by utilizing wavelet transform, Journal of Intelligent Manufacturing, 26(3), 485-499.
[12] Ben Chabane, S., Stoica Maniu, C., Camacho, E., Alamo, T., Dumur, D., 2016, Fault Detection using Set-Membership estimation based on Multiple Model systems, European Control Conference, Aalborg, Denmark, 1105-1110.
[13] Ritou, M., Garnier, S., Furet, B., & Hascoët, J. Y., 2014, Angular approach combined to mechanical model for tool breakage detection by eddy current sensors, Mechanical Systems and Signal Processing, 44(1), 211-220.
[14] Quintana, G., Garcia-Romeu, M. L., Ciurana, J., 2011. Surface roughness monitoring application based on artificial neural networks for ball-end milling operations, Journal of Intelligent Manufacturing, 22(4), 607-617. [15] Jaydeep M. Karandikar, Ali E. Abbas, and Tony L. Schmitz, 2014. Tool life prediction using Bayesian updating. Part 1: Milling tool life model using a discrete grid method. Precision Engineering, 38(1), 18-27.
[16] G. F. Wang, Y. W. Yang, Y. C. Zhang, and Q. L. Xie, 2014. Vibration sensor based tool condition monitoring using support vector machine and locality preserving projection, Sensors and Actuators, A : Physical, 209 :24–32.
[17] M. Lamraoui, M. Thomas, and M. El Badaoui, 2014. Cyclostationarity approach for monitoring chatter and tool wear in high speed milling. Mechanical Systems and Signal Processing, 44(1-2), 177–198.
[18] Eleftheriadis, R.,J., Myklebust, O., Benchmark and Best Practice of IFaCOM Industrial Demonstrators, 2015, 9th CIRP Conference on Intelligent Computation in Manufacturing Engineering, Procedia CIRP, 33: 311-314, [19] B. Denkena, M.A. Dittrich, F. Uhlich, 2016, Self-optimizing Cutting Process Using Learning Process Models, Procedia Technology, 26, 221-226.
[20] Lee, J., Bagheri, B., Kao, H.A., 2015, A cyber-physical systems architecture for industry 4.0-based manufacturing systems, Manufacturing Letter, 3:18-23.
[21] Gao, R., Wang, L., Teti, R., Dornfeld, D., Kumara, S., Mori, M., 2015, Cloud enabled Prognosis for Manufacturing, Annals of the CIRP, 64/2:749-772.
[22] Whittaker, J., 2009, Graphical models in applied multivariate statistics, Wiley Publishing.
[23] M. Ritou, C. Rabréau, S. Le Loch, B. Furet, 2018, Influence of spindle condition on the dynamic behaviour, Annals of the CIRP, 67/1.