HAL Id: pastel-00004845
https://pastel.archives-ouvertes.fr/pastel-00004845
Submitted on 3 Mar 2009HAL is a multi-disciplinary open access archive for the deposit and dissemination of sci-entific research documents, whether they are pub-lished or not. The documents may come from teaching and research institutions in France or abroad, or from public or private research centers.
L’archive ouverte pluridisciplinaire HAL, est destinée au dépôt et à la diffusion de documents scientifiques de niveau recherche, publiés ou non, émanant des établissements d’enseignement et de recherche français ou étrangers, des laboratoires publics ou privés.
Design and realization of a primary and secondary leak
standards for the measurement of leak flow rates of
refrigerants
Isabelle Morgado
To cite this version:
Isabelle Morgado. Design and realization of a primary and secondary leak standards for the measure-ment of leak flow rates of refrigerants. Engineering Sciences [physics]. École Nationale Supérieure des Mines de Paris, 2008. English. �NNT : 2008ENMP1564�. �pastel-00004845�
ED n°432 : Sciences des Métiers de l'Ingénieur
N° attribué par la bibliothèque
|__|__|__|__|__|__|__|__|__|__|
T H E S E
pour obtenir le grade de
DOCTEUR DE L’ECOLE NATIONALE SUPERIEURE DES MINES DE PARIS
Spécialité “Energétique”
présentée et soutenue publiquement par
Isabelle MORGADO
le 14 novembre 2008
DESIGN AND REALIZATION OF A PRIMARY AND SECONDARY
LEAK STANDARDS FOR THE MEASUREMENT OF LEAK FLOW
RATES OF REFRIGERANTS
Directeur de thèse : Denis Clodic
Jury
M. Didier MAYER, EMP ... Président
M. Daniel FAVRAT, EPFL ... Rapporteur
M. François LEPOUTRE, CNAM ... Rapporteur
M. Jean-Claude LEGRAS, LNE ...Examinateur
M. Etienne MERLIN, ADEME...Examinateur
M. Denis CLODIC, EMP...Examinateur
ACKNOWLEDGEMENTS
ACKNOWLEDGEMENTS
Rewinding 3 years of my life, I realize that this work could not have been done without many people who contributed in a way or another to the accomplishment and success of this thesis. I would like to express my gratitude to them.
Denis CLODIC, Deputy-Director of the “Centre for Energy and Processes” and thesis director, and Jean-Claude LEGRAS, Head of the Pressure and Vacuum laboratory of the “Laboratoire National de Métrologie et d’Essais”, who integrated me in their teams and who advised me all over this work. I hope that I deserved their trust and that our collaboration will continue successfully.
Anne-Marie POUGIN, who is always available to take care of administrative questions and especially for the time she spent to read this dissertation and her advises for its improvement.
Franck FAYOLLE, of the CEP, who contributed actively in the success of this work, who helps me in the design of the test benches and in their realization.
The members of the examination board and especially the “rapporteurs”. I appreciate their patience while evaluating my work.
Mr. MERLIN for his follow up and ADEME for fueling the study with financial support.
Aline GARNIER of the CEP, Mrs COULLON of the LNE, and Mrs POIROT of the LNE for the documentation research help.
Mr SUTOUR, of the LNE Chemistry laboratory, for his technical support in chemistry.
Mr JEANJACQUOT and Mr MADEC, of the LNE Mass and Volume laboratory, for their collaboration in the volume comparison.
Mr CAMUS, of the LNE Dimensional laboratory, for his contribution in the calibration of the standard volume.
Mr WETZEL and Mr LOUCIF, of LNE, for their contribution in the realization of some elements of the test bench.
Youssef RIACHI, of CEP, for his help to handle the FLUENT software.
Mr CAZAURAN and Mr HUCHET, of CETIM, for sharing their experience in the leak detection in an industrial environment.
My colleagues, who made my stay easy at the CEP and at the LNE. I hope we will continue in this good ambiance. Special thanks to Yingzhong YU, David SOUSA, Assaad ZOUGHAIB of CEP, Roger MONTABORD, Frédéric BOINEAU, Djilali BENTOUATI, Pierre OTAL, and Thierry RABAULT of LNE for their friendship and their technical support.
My Parents for their encouragement, support and help. They contributed enormously to my well being and happiness. I dedicate my work to them.
CONTENTS
Table of contents
NOMENCLATURE____________________________________________________ I
GENERAL INTRODUCTION ___________________________________________ 1
CHAPTER 1 -
INVENTORY OF EXISTING METHODS TO CALIBRATE GAS
LEAK FLOW RATE __________________________________________________ 3
1.1
Regulations and needs_________________________________________________ 3
1.2
Objectives___________________________________________________________ 4
1.3
Existing calibration method of gas leak flow rate __________________________ 4
1.3.1
NIST primary standard for the measurements of leak flow rates of helium _____ 5
1.3.1.1 Operating
principle ______________________________________________ 5
1.3.1.2 Uncertainties __________________________________________________ 10
1.3.2
Pressure/Volume rise method _______________________________________ 11
1.3.2.1 In an evacuated system __________________________________________ 11
1.3.2.2 In a system at atmospheric pressure ________________________________ 13
1.3.3 Adaptability
of
measurements of refrigerant leaks in evacuated systems _____ 14
1.3.4 Weighing
method ________________________________________________ 16
1.3.4.1 Operating
principle _____________________________________________ 16
1.3.4.2 Limits _______________________________________________________ 17
1.4
Infrared spectrometry method specific to refrigerant leaks _________________ 18
1.4.1 Operating
principle _______________________________________________ 18
1.4.2
Interests of the method ____________________________________________ 19
1.5
Conclusion _________________________________________________________ 20
CHAPTER 2 -
DESIGN OF THE PRIMARY STANDARD __________________ 21
2.1
Objectives__________________________________________________________ 21
2.2
Choice of the most appropriate infrared detection method _________________ 21
2.2.1
Theoretical basis of the infrared detection _____________________________ 21
2.2.2
Description of a photo-acoustic spectrometer___________________________ 22
2.2.2.1 Operating
principle _____________________________________________ 22
2.2.2.2 Relation between the acoustic pressure and the concentration ____________ 23
2.2.3
Description of the spectrophotometer _________________________________ 26
2.2.3.1 Operating
principle _____________________________________________ 26
2.2.4
Theoretical comparison of the spectrophotometer and the PAS _____________ 28
2.2.4.1 Comparison of the operating principle ______________________________ 28
2.2.4.2 Comparison of the pressure sensors ________________________________ 29
CONTENTS
2.2.4.3 Influence of the environment _____________________________________ 29
2.2.5
Experimental comparison of the performance of the spectrometers at low
concentrations ___________________________________________________________ 30
2.2.5.1 Relevant
parameters ____________________________________________ 30
2.2.5.2 Operating principle of the comparison ______________________________ 30
2.2.5.3 Results _______________________________________________________ 31
2.3
Choice of the volume calibration method ________________________________ 33
2.3.1 Dimensional
method ______________________________________________ 33
2.3.1.1 Operating
principle _____________________________________________ 33
2.3.1.2 Feasibility of the method_________________________________________ 33
2.3.2 Gravimetric
method_______________________________________________ 33
2.3.2.1 Operating
principle _____________________________________________ 33
2.3.2.2 Analysis of the method __________________________________________ 33
2.3.3
Static volume expansion method_____________________________________ 34
2.3.3.1 Operating
principle _____________________________________________ 34
2.3.3.2 Advantages of the method________________________________________ 35
2.4
Optimization of the volumes composing the primary standard of leaks _______ 36
2.4.1
Size of the accumulation volume ____________________________________ 36
2.4.2
Optimization of the standard volume size______________________________ 39
2.5
Design of the primary standard of leaks _________________________________ 40
2.5.1
Complementary measurement components ____________________________ 40
2.5.2
Circuits composing the primary standard ______________________________ 42
2.5.3
Precaution for the static expansion method_____________________________ 43
2.5.4
Realization of the standard _________________________________________ 43
2.6
Conclusions ________________________________________________________ 43
CHAPTER 3 -
QUALIFICATION OF THE PRIMARY STANDARD ___________ 45
3.1
Objectives__________________________________________________________ 45
3.2
Basis of the expression of the uncertainty in measurement _________________ 45
3.2.1
Causes of errors in the measurement__________________________________ 45
3.2.2 Main
definitions _________________________________________________ 47
3.2.3
Evaluation of standard uncertainty ___________________________________ 48
3.2.3.1 Type A evaluation of standard uncertainty ___________________________ 48
3.2.3.2 Type B evaluation of standard uncertainty ___________________________ 49
3.2.4
Expression of the combined uncertainty _______________________________ 50
3.3
Measurement of the concentration _____________________________________ 51
3.3.1
Analysis of the causes of errors in the concentration measurement by the PAS 51
3.3.1.1 Photo-acoustic
cell _____________________________________________ 51
3.3.1.2 Light
path ____________________________________________________ 52
3.3.1.3 Measurement of the acoustic signal ________________________________ 53
3.3.1.4 Theoretical relationship between the sound pressure and the concentration _ 54
3.3.1.5 Limit
detection ________________________________________________ 54
3.3.1.6 Summary of the errors components ________________________________ 54
CONTENTS
3.4
Measurement of the pressure __________________________________________ 59
3.4.1
Calibration of the pressure gauges ___________________________________ 59
3.4.2
Homogeneity of the static pressure inside the accumulation volume _________ 60
3.4.3
Analysis of the influence of the PAS micro-fan suction on the pressure ______ 61
3.4.4
Expression of the pressure uncertainty ________________________________ 62
3.5
Measurement of the temperature ______________________________________ 64
3.5.1
Description of the measurement chain of the temperature _________________ 64
3.5.2
Calibration of the digital multimeter__________________________________ 65
3.5.3
Calibration of the Pt100 ___________________________________________ 67
3.5.4
Expression of the temperature uncertainty _____________________________ 68
3.6
Measurement of the volume ___________________________________________ 69
3.6.1
Description of the standard volume __________________________________ 69
3.6.2
Calibration of the standard volume ___________________________________ 69
3.6.3
Description of the instrumentation ___________________________________ 70
3.6.4
Determination of the stabilization time of the thermal phenomena __________ 71
3.6.4.1 1D thermal modeling____________________________________________ 71
3.6.4.2 Experimentation:
expansion between two volumes ____________________ 78
3.6.5 Operating
principle _______________________________________________ 80
3.6.6
Expression of the volume uncertainty_________________________________ 81
3.6.7
Comparison with the results of the LNE volume metrology unit ____________ 81
3.7
Expanded uncertainty of refrigerant leak flow rate measurement by the primary
standard _________________________________________________________________ 83
3.7.1
Expression of the leak flow rate _____________________________________ 83
3.7.2
Modeling of the variation of the corrected concentration as a function of time _ 84
3.7.3
Uncertainty budget of leak flow rate__________________________________ 85
3.8
Conclusions ________________________________________________________ 87
CHAPTER 4 -
ANALYSIS OF THE QUALIFICATION TESTS OF REFRIGERANT
LEAK DETECTORS ACCORDING TO EXISTING STANDARDS _____________ 89
4.1
Objective __________________________________________________________ 89
4.2
Description of the three main methods of refrigerant leak detection__________ 90
4.2.1
Example of an infrared detector _____________________________________ 90
4.2.1.1 Operating
principle _____________________________________________ 90
4.2.1.2 Advantages and disadvantages of a reference gas _____________________ 90
4.2.1.3 Calibration of the refrigerant detector_______________________________ 91
4.2.2
Detector with a heated sensor _______________________________________ 91
4.2.2.1 Operating
principle _____________________________________________ 91
4.2.2.2 Interest of the method ___________________________________________ 91
4.2.3 Catharometer ____________________________________________________ 91
4.2.3.1 Operating
principle _____________________________________________ 91
4.2.3.2 Interest of the method ___________________________________________ 92
4.3
Theoretical relation between the measurand and the nature of the measured
quantity _________________________________________________________________ 92
CONTENTS
4.3.2 Mass
balance ____________________________________________________ 94
4.4
Concentration gradient near a calibrated leak____________________________ 96
4.4.1
Influence of the distance from the leak ________________________________ 96
4.4.1.1 Phenomenological
study _________________________________________ 96
4.4.1.2 Experimental
study _____________________________________________ 99
4.4.2
Influence of altitude and gravity ____________________________________ 101
4.4.3 Conclusions ____________________________________________________ 102
4.5
Test bench to qualify the refrigerant leak detector according to the existing
standards _______________________________________________________________ 103
4.5.1
Objectives of the standards ________________________________________ 103
4.5.1.1 European standard and ASHRAE standard__________________________ 103
4.5.1.2 SAE
standard_________________________________________________ 104
4.5.2
Description of the tests to qualify hand detectors defined in the standards ___ 104
4.5.2.1 European standard EN 14624 ____________________________________ 104
4.5.2.2 ASHRAE
standard ____________________________________________ 105
4.5.2.3 SAE standard J1624 ___________________________________________ 106
4.5.3
Description of the testing stand and precautions________________________ 106
4.5.3.1 Needed adjustments of the detector position relatively to the calibrated leak106
4.5.3.2 Influence of the leak detector translation speed: test of the European and
ASHRAE standards____________________________________________________ 108
4.5.3.3 Test bench to qualify refrigerant detectors __________________________ 109
4.5.4
Precautions in the operating conditions ______________________________ 110
4.5.4.1 Influence of the air convection in the room _________________________ 110
4.5.4.2 Influence of the leak detector VFR ________________________________ 110
4.5.4.3 Room
temperature _____________________________________________ 111
4.5.5
Example of an empirical fitting Q
m= f(C) using the first test of the standard _ 111
4.6
Leak detection in real conditions ______________________________________ 113
4.6.1 Leak
sources ___________________________________________________ 114
4.6.2
Real leaks: several control points ___________________________________ 114
4.6.3
Gas escape from a real leak: direction and heterogeneity_________________ 116
4.6.4 Conclusion_____________________________________________________ 120
4.7
Conclusions _______________________________________________________ 121
GENERAL CONCLUSION __________________________________________ 123
NOMENCLATURE i
Nomenclature
Symbols
C Concentration / µmol.mol-1
C0 Conductance / m3.s-1
Cp Heat capacity at constant pressure / J.kg-1.K-1
Cv Heat capacity at constant volume / J.kg-1.K-1
D Diameter / m
D Diffusion coefficient / m².s-1
E Energy / J
e Wall thickness / m
fprob Density function of the probability
g Acceleration of gravity / m.s-2 h Enthalpy of 1 kg of gas / J.kg-1 h Convection coefficient /W.m-2.K-1 I Light intensity / Cd i Current intensity / A K Thermal conductivity / W.m-1.K-1 L Luminance / Cd.m-2 l Length / m
lm Molecular mean free path / m
M Molar Mass / g.mol-1
m mass / kg
Mmicro Sensitivity / V.Pa-1
N Molar Flow Rate / mol.s-1
n Molar quantity / mol
P Pressure / Pa
p Acoustical pressure / Pa
Q Throughput / Pa.m3.s-1
q
Arithmetic mean of a quantity qq Observation value of a quantity q
Qm Mass flow rate / kg.s-1
Qv Volume flow rate / m3.s-1
RES Resistance / ohm
S Surface / m²
SENS Sensibility
T Temperature / K
t Time / s
Tf Optical filter transmission
F Function of transmission of the optical filter (F depends on [ν-ν0] )
U Enlarged combined uncertainty (k=2) u Standard combined uncertainty u²(a) Variance of the quantity a
UT Voltage / V
V Volume / m3
v Speed / m.s-1
V(a) Variance of the quantity a
W Absorbed power per unit volume / W.m-3
NOMENCLATURE ii
Greek letter
α Correction factor representing all the phenomenon that are not controlled
αΤ Thermal dilatation coefficient of a gas / K-1 β Absorptivity coefficient (depends on ν)
βV Volume dilatation coefficient / K-1
χΤ Isothermal compressibility coefficient of a
gas Pa-1
Δν Bandwidth of the light / Hz
ΔΠ Pressure loss /Pa
ε Interaction energy / J
γ Adiabatic coefficient of a gas
λ Wavelength of sound / m
μ Dynamic viscosity / Pa.s
ν Frequency band of the filter / Hz
Φ Collision diameter / Angströms
θ Half cone angle of the light cone / sr
ρ Density / kg.m-3
σ Type A - Standard deviation τ Expected value of a quantity Ω Collision integral
ω Chopper pulsation / rad-1
ξ Kinematic viscosity / m².s-1
ψ Pressure loss coefficient / Pa
Adimensionnal number
KnKnudsen Number
m l Kn=D
Nu Nusselt Number K Nu =h⋅D Ra Rayleigh Numberμ
⋅
⋅
−
⋅
⋅
ρ
⋅
β
⋅
=
K
D
T
T
C
g
Ra
3 gaz wall p 2 VRa* Modified Rayleigh Number
(
)
L
K
r
T
T
C
g
Ra
4 h wall p 2 V *⋅
μ
⋅
⋅
−
⋅
⋅
ρ
⋅
β
⋅
=
∞ Re Reynolds Numberμ
⋅
⋅
ρ
=D
eV
RConstants
kB Boltzmann Constancy kB = 1.3806 × 10⁻²³ J.K-1 Na Avogadro Number Na = 6.022 x 10²³ mol-1 Rg Perfect gas constant Rg = 8.314 J.K-1.mol-1NOMENCLATURE iii
Indices
0 Initial value inside the accumulation volume (Static expansion method) 1 (RU/L) Step 1 in the valving sequence to determine the ratio RU/L
2 (RU/L) Step 2 in the valving sequence to determine the ratio RU/L
100 Value of 100 Ω
110 Value of 110 Ω
∞ From the infinity, of the ambient environment ν At the frequency band of the filter ν
Acc Accumulation volume
After expansion After expansion (Static expansion system)
air Air
Average Average between the value of the quantity related to the standard volume and the one related to the accumulation volume
Before expansion Before expansion (Static expansion system) calibration Calibration
corr Corrected value
cyl Cylinder or main cylinder
diluted Diluted
downstream downstream
e Final value inside the equilibrate system {accumulation volume + Standard volume} (Static expansion method)
final Final
fitting Fitting (mathematical) fittings Fittings, connections
FM Flowmeter g gas h Hydraulic heat Heat initial Initial int Internal L Leak
limit Limit Detection
m Mechanical mano Manometer mixture Mixture mult Multimeter P Pressure p Piston
PAS Photo-acoustic spectrometer
PAC Photo-acoustic cell
Pt100 Pt100
pump pumping
pump1 Pumping in step 1
pump2 Pumping in step 2
pump3 Pumping in step 3
q Quantity q
R-134a R-134a
R-134a/air Between R-134a and air molecules
r Reference
read Indication read from a measuring instrument regular Regular (pressure losses)
RES Resistance
NOMENCLATURE iv
s Standard
singular Singular (pressure losses)
sound sound
Spectrophotometer Spectrophotometer stability Stability
U/L Upper chamber / Lower chamber
u Upper chamber
unitary Unitary
upstream Upstream
used Used
X Translation
Xp Translation of the piston
walls Walls
window Germanium Window
Acronyms
ASHRAE American Society of Heating, Refrigerating and Air-Conditioning Engineers CEP Centre for Energy and Processes.
INRIM Istituto Nazionale di Ricerca Metrologica
LNE Centre for Scientific and Industrial Metrology (Laboratoire National de Métrologie et d’Essais).
NIST National Institute of Standards and Technology
Abbreviations & Definitions
Accumulation volume Volume where the gas is accumulated during the suction of the gas by the monitor (for the photo-acoustic gas monitor, it means that the photo-acoustic cell is opened). It includes the accumulation cell.
Accumulation cell 2L- cylindrical volume where the refrigerant leaks is evacuated into. All valves are closed. It is a part of the accumulation volume.
CFC Chlorofluorocarbons.
Corr Correction
GWP The GWP or Global Warming Potential classifies the gases based on their contribution to the greenhouse effect. CO2 is the reference gas with a GWP equals to 1,0. The GWP value of each gas is expressed in kg of CO2. It depends on a selected time frame.
HCFC Hydrochlorofluorocarbons
HFC Hydrofluorocarbons
MFR Mass Flow Rate
NAC Non applied correction
ODP The ODP or Ozone Depletion Potential is a relative scale that ranks
chemicals based on their potential do deplete the ozone layer. By definition, R-11 has a value of 1,0 and is the reference for all other chemicals.
OEM Original Equipment Manufacturer
PAC Photo-acoustic cell
PAS Photo-acoustic spectrometer
R Ratios
ran Random
RMS Root Mean Square
sys Systematic
Throughput The quantity of gas in pressure-volume units, at a specified temperature, flowing per unit time across a specified open cross section [28].
GENERAL INTRODUCTION 1
General introduction
Nowadays leak detection is widely used in various fields such as the automotive and the refrigeration industries. The leak tightness of installations charged with refrigerants must be controlled periodically by refrigerant detectors, qualified via refrigerant leaks. Consequently this dissertation aims at establishing the measurement chain from standard leaks to qualified detectors. The thesis is composed of 4 chapters. Chapters 1, 2, and 3 deal with the primary standard to measure refrigerant calibrated leak flow rates. The last one deals with the detectors qualification method and the precautions to be taken during a detection on site.
Chapter 1 describes the stakes that lead to a need for establishing a complete measurement chain to measure refrigerant leaks flow rate. An inventory of the main existing methods to measure gas leaks flow rates – usually they are vacuum techniques – is carried out to understand the need to establish a new measurement chain. Consequently, the existing techniques are enumerated and evaluated to define the capacity to adapt this method to measure refrigerant leaks in their operating conditions. From this analysis the main interests of the development for a new method is deduced: the infrared detection in an accumulation volume.
Chapter 2 presents the design of the primary standard using the infrared detection. Some test benches to measure refrigerant mass flow rate (MFR) through components have already been realized by the Center for Energy and Processes (CEP). Based on the CEP experience, the design of the bench aims at improving and optimizing the metrological performances of the measurement. The identified key point are: the concentration and the accumulation volume measurement. Therefore, in this chapter:
two main infrared techniques are theoretically and experimentally compared in order to select the most efficient.
three techniques to calibrate volumes are presented and metrologically compared in order to select the best suited.
The aim of this chapter is to design a primary standard to measure refrigerant leak flow rates with an uncertainty about 1%. The selection of the components of the primary standard is finally presented based on the CEP experience and on this study results.
Once the test bench to measure refrigerant leak flow rate is realized according to the specifications defined in Chapter 2, the measurement chain is qualified. The procedures to calibrate the leak flow rate and the uncertainty budget of the measurement of leak flow rate are then established in Chapter 3, using the theory of the uncertainty estimation, and the experimental and phenomenological results. The leak flow rate is calculated from the variations of the tracer gas concentration, the temperature, and the pressure in the accumulation volume, and from the capacity of the accumulation volume. Consequently, the methods to measure these quantities are developed and the uncertainty budget for each quantity is estimated in Chapter 3. As in Chapter 2, the key points of this qualification concern the concentration variation measurements – the infrared spectrometer is calibrated - and the capacity of the volumes - the method is qualified.
Those three chapters aims at realizing a primary standard to measure refrigerant calibrated leak flow rates with an uncertainty about 1%. The main goal of the study is to give the means to the industry to respect the regulations relative to the leak tightness of refrigerating equipment. The primary standard ensures the traceability of the calibrated leaks used to qualify leak detectors. However, to establish the complete measurement chain of the sensitivity threshold of refrigerant detectors, Chapter 4 deals with the qualification method to qualify the refrigerant detectors: it aims at defining the precautions that must be taken. Theory, experiments, and CFD simulation by Fluent are presented in this chapter, in order to identify the main parameters that can influence the measurement of the detector sensitivity threshold. Based on this knowledge, the precautions to be taken during the measurement according to the existing standards to qualify the leak detector performances can be identified. Finally, the chapter
GENERAL INTRODUCTION 2 finalize the study by the precautions to be taken when a qualified detector is used for real leak detection in an industrial environment.
Chapter 1 - Inventory of methods to calibrate leak flow rate 3
Chapter 1 - Inventory of existing methods
to calibrate gas leak flow rate
1.1 Regulations and needs
Due to the Montreal Protocol signed in 1987, the use of ozone-depleting refrigerants such as CFCs and HCFCs has been or is progressively stopped. Thereby, these gases were replaced by HFC gases, CO2, and hydrocarbons. The Ozone Depletion Potential of R-134a is equal to zero. However, the most used refrigerants are greenhouse gases: their GWPs are really high (see Table 1.1). On that account, the Kyoto Protocol in 1997 tends to limit the emissions of these greenhouse refrigerants.
Table 1.1. Example of GWP (100 years) of HFC gases [CLO98-1].
Name of the gas
GWP (100 years)
kg of CO2
Pure Fluids
R-134a 1 300 R-125 2 800 R-32 650 R-152a 140 R-143a 3 800Mixtures
R-404A 3 260 R-407C 1 530 R-410A 1 730 R-507 3 300 R-417A 1 955However, actions aiming at the limitation of greenhouse refrigerant emissions were not determined. European countries tend to define these actions. Different national policies are being published. Some European countries (the Netherlands, France…) mention that leak-tightness inspections are a key point. On that account, the European regulation n°2037/2000 indicates the measures to be taken in order to limit refrigerant emissions. In particular, title 5 mentions mandatory annual leak-tightness inspections for installations charged with refrigerants except for domestic appliances [CLO00], [CLO02]. More recently, the new European regulation n°842/2006 published on 17th May 2006 [REGLEM06] relating to the refrigerant greenhouse gases defines the duties of the owners of this equipment. Thus, the owner of equipment confining more than 3 kg of refrigerant fluids must control periodically the tightness of their equipment. The tightness has to be controlled:
every year for equipment containing more than 3 kg of refrigerant, every 6 months for equipment containing more than 30 kg of refrigerant, every 3 months for equipment containing more than 300 kg of refrigerant.
In France, the decree n°98-560 on 30th June 1998 [DECRET98], relating to refrigerants used in refrigerating and climatic equipment, and the first article of the French order established on 12th January 2000 define that the owner of equipment with more than 2 kg of refrigerant must control the tightness every year. More recently, French decree n°2007-737 was published the7th May 2007
Chapter 1 - Inventory of methods to calibrate leak flow rate 4 [DECRET07], based on the specifications of the European regulation. However, some differences exist between the European regulation and the French decree: for instance, the owner of equipment confining more than 2 kg of refrigerant must also control the leak tightness every year. The French policy tends to be more precise than the European regulation. The French order established on 12th January 2000 [ARRETE00] specifies how the leak tightness must be controlled. Consequently, the leak tightness of the equipment containing refrigerant must be controlled by refrigerant leak detectors and room controllers whose respective sensitivity must be lower than 5 g.yr-1 and 10 µmol.mol-1 [ARRETE07].
Hence, the performances of these devices have to be confirmed. Thereby, the implementation of regulation on leak-tightness inspections requires the elaboration of standards for the performances of refrigerant leak detectors and room controllers. AFNOR (French Association for Standards) initiated the matter with the standard E 35422. This standard was proposed to the CEN to become a European standard, EN-14624. This European standard was published in 2005. In the order [ARRETE07], it is specified that the sensitivity of devices must be measured according to the standard EN-14624 [AFN05]. This tendency reached also North America. The SAE (Society of Automotive Engineers) and the ASHRAE (American Society of Heating, Refrigerating and Air-Conditioning Engineers) are taking the same path and similar standards are written or under elaboration. All these standards establish that refrigerant calibrated leaks from 1 g/yr to 50 g/yr are needed to qualify the performances of refrigerant leak detectors and room controllers. Performances of a detector are tested by comparing the calibrated leak MFR and the indication of the detectors.
The calibration of refrigerant leaks is now a key point in leak-tightness inspections. Therefore, calibrated leaks have to be traceable to the SI units. It means that there is no reference to define the unit of a refrigerant leak flow rate through its practical realization. Finally, the first key point of leak-tightness inspections is the calibration and the design of standard leaks. In the short term, a primary standard for the measurements of leak flow rates of refrigerant will be necessary for OEMs and suppliers of leak detectors, as standard leaks are definitely needed. At the present time, the NIST (National Institute of Standards and Technology) in the United States and the LNE (“Laboratoire National de Métrologie et d’Essais”) in France for instance calibrate standard leaks of helium. The LNE has decided to provide a primary standard for the measurements of leak flow rates of refrigerant gases. The LNE and the CEP have agreed to share their abilities in order to develop this type of equipment.
1.2 Objectives
The objectives of this chapter are as follows:
To analyze the suitability of the existing methods to measure a refrigerant leak MFR To present the chosen method to measure refrigerant leak MFR
To deduce the interest of this method.
1.3 Existing calibration method of gas leak flow rate
To the best of our knowledge, neither a device, nor a protocol existed for the verification of leak MFR of HFC calibrated leaks. However, concerning helium, a primary standard is available at the NIST in the United States [NIST92]. In France, a primary standard based on another method has been developed [LEG97], [BOI06]. These standards aim at calibrating helium leaks in the range from 10-6 mol/s to 10-12 mol/s, which means helium leaks around (1.3 x 10⁻⁴)g.yr-1 and (1.3 x 10²) g.yr-1. This large range of leak MFRs is due to the fact that helium leaks are widely used for vacuum systems. That is why it exists flows about 10-4 g/yr, adapted to molecular flows.
Chapter 1 - Inventory of methods to calibrate leak flow rate 5 Concerning the refrigerant leaks, the standards for qualifying refrigerant detectors only require leaks from 1g.yr-1 to 50 g.yr-1 for typical HFC gases as R-134a corresponding to leaks to be detected in refrigerating systems. For R-134a 1 g.yr-1 equals to 3.1 x 10⁻¹⁰ mol.s-1 and 50 g.yr-1 equals to 1.6 x 10⁻⁸ mol.s-1. The range is smaller than for helium and the leaks are quite huge comparing to helium leaks, because the flow regimes are not similar. These leaks are operating at atmospheric pressure, the flow regime is in general viscous neither molecular nor intermediate.
Thus the range of the existing methods is wider than the one needed for helium and includes the range of refrigerant flows. It is then necessary to compare these methods and to analyze the possibilities of using one of them for developing a primary standard. In this part of the thesis, some methods to calibrate helium leaks used by the NIST and by the LNE are described. Then the relevance of similar methods to calibrate refrigerant leaks is analyzed and discussed. Next a method widely used by some refrigerant leak manufacturers to calibrate refrigerant leak flow rates directly at atmospheric pressure is analyzed: the weighing method. Finally, the principle of measurement of the primary standard of refrigerant leaks is presented and the interest of this method is analyzed.
1.3.1 NIST primary standard for the measurements of leak flow rates
of helium
1.3.1.1 Operating principle
The primary standard developed by the NIST [NIST92], [EHR90] aims at calibrating leak flow rates of helium. The standard is divided into three major components [TOR02], [CLO00], [CLO02]:
a main vacuum system composed by an upper chamber and a lower chamber, a constant-pressure flowmeter,
a manifold on which the leak is mounted.
The primary standard can measure molar flow rates between 10-6 mol.s-1 and 10-12 mol.s-1, which correspond to helium leak MFRs between (1.26 x 10⁻⁴) g.yr-1 and 126 g.yr-1. It also corresponds to R-134a leak MFR between (3.22 x 10⁻⁴) g.yr-1 and (3.22 x 10³) g.yr-1 [EHR96].
Two operating techniques are used to measure the leak flow rate. They are named:
“Flow into the upper chamber”, which is composed of 3 valving sequences (steps 1, 2, and 3) aiming at substituting a known flow to the one from the unknown leak: the evacuation of the unknown leak, the adjustment of the flowmeter and the evacuation of the standard leak from the flowmeter. This technique measures leak flow rates between 10-6 mol.s-1 and 10-12 mol/s. However, the uncertainty of the leak flow rate measurement of 10-12 mol.s-1 is about 12%. “Flow division technique”, which is composed of a preliminary measurement of a relevant
parameter to estimate the flow rate (2 valving sequences: steps 1 and 2) and of the measurement of the flow rate (3 valving sequences: steps 1, 2, and 3). This technique is developed to measure helium leak flow rates near 10-12 mol.s-1 with a better uncertainty (7.2%) than that of the “flow into the upper chamber” technique.
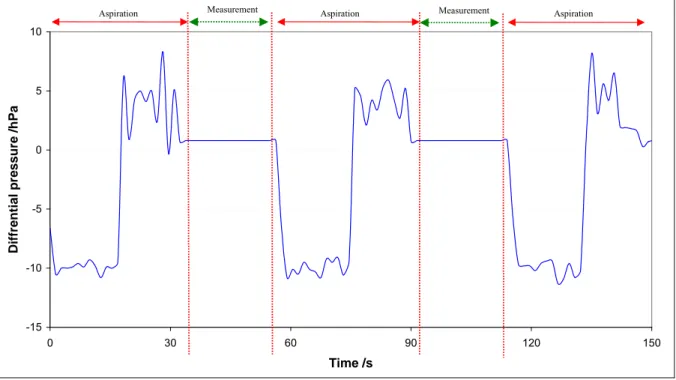
Flow into the upper chamber
At the beginning, the pressure in the upper chamber is recorded with no gas flow for different valving conditions.
Step 1:
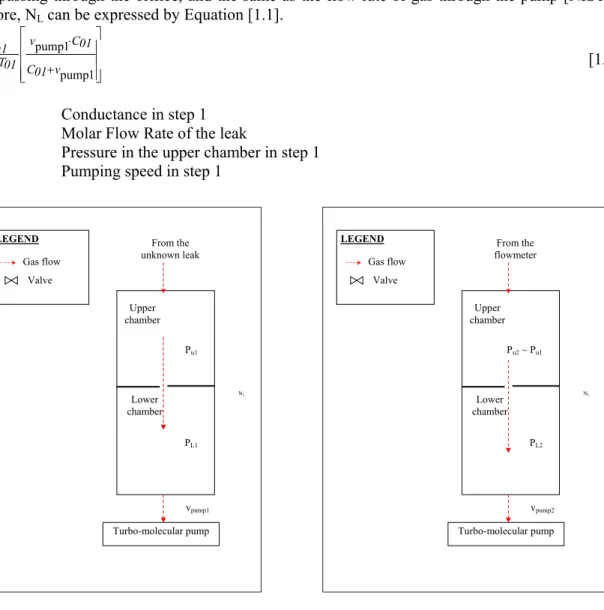
The unknown gas flow is directed into the upper chamber. It flows into the lower chamber before being evacuated by the vacuum pump. The gas flow is allowed stabilizing and then, the equilibrium pressure of the upper chamber is recorded: Pu1 (see Figure 1.1). Due to the conservation of total number of molecules, the molar flow rate NL of gas leaving the leak is the same as the molar flow rate
Chapter 1 - Inventory of methods to calibrate leak flow rate 6 of gas passing through the orifice, and the same as the flow rate of gas through the pump [NIST92]. Therefore, NL can be expressed by Equation [1.1].
⎥ ⎥ ⎥ ⎦ ⎤ ⎢ ⎢ ⎢ ⎣ ⎡ + ⋅ ⋅ ⋅ = 1 pump 1 pump v 01 C 01 C v 01 T g R u1 P L N [1.1], where C01 Conductance in step 1 NL Molar Flow Rate of the leak
Pu1 Pressure in the upper chamber in step 1 Vpump1 Pumping speed in step 1
Turbo-molecular pump From the unknown leak Lower chamber Upper chamber Pu1 PL1 NL vpump1 LEGEND Valve Gas flow
Figure 1.1. Step 1 of the sequence for calibrating leak flow rate through the upper
chamber of the NIST primary standard.
Turbo-molecular pump From the flowmeter Lower chamber Upper chamber Pu2 ~ Pu1 PL2 NL vpump2 LEGEND Valve Gas flow
Figure 1.2. Step 2 of the sequence for calibrating leak flow rate through the upper
chamber of the NIST primary standard.
Step 2:
Next, the unknown leak is valved out and gas is introduced into the flowmeter, which admits gas into the upper chamber. The flow rate is adjusted by a variable leak valve (see Figure 1.3), so that the pressure in the upper chamber is similar to the pressure Pu1 generated in the upper chamber by the unknown leak in step 1. Then it is allowed stabilizing (see Figure 1.2: step 2).
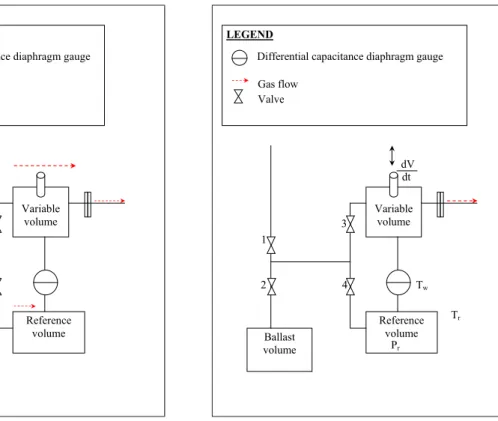
Step 3:
This step aims at calibrating the generated leak flow rate from the flowmeter (see Figure 1.4). The apparatus is composed of a reference volume, a variable volume, two pistons, a piston advance control system, and pressure measurement devices. A flow of gas is generated by changing the volume of the variable volume at a measured rate such as the pressure in the variable volume remains constant. Therefore, in this step, gas introduction is stopped. The reference and the variable volumes, which were filled to the same pressure, are isolated from each other by closing the upstream valves. The pressure in the variable volume decreases due to the gas escaping through the leak valve, which produces a change in a differential capacitance diaphragm gauge installed between the two volumes. Then this gauge activates a control system, which controls the rate of advance of the piston to maintain a zero differential pressure between the two volumes. The pressure in the reference volume is experimentally measured: Pr3. The volume rate changes are experimentally determined as the change
Chapter 1 - Inventory of methods to calibrate leak flow rate 7 in volume ΔV over a measured time interval Δt [NIST92], [CUL87], [JOU02]. The equilibrium pressure inside the upper chamber is then recorded: Pu3.
Ballast volume Variable volume Reference volume LEGEND Valve Gas flow
Differential capacitance diaphragm gauge
1
2
3
4
Figure 1.3. Generated leak flow by the flowmeter: step 2. Ballast volume Variable volume Reference volume LEGEND Valve Gas flow
Differential capacitance diaphragm gauge
1 2 3 4 dV dt Tw Tr Pr
Figure 1.4. Measurement of the generated leak flow rate from the flowmeter: step 3.
Due to the conservation of total number of molecules, the molar flow rate of gas leaving the flowmeter NLFM is the same as the molar flow rate of gas passing through the orifice NL03, and the same as the flow rate of gas through the pump. It is worth noting that the NIST standard measures flow rate at each step: a flow rate passing through the orifice, a flow rate through a vacuum pump, a flow rate generated by a flowmeter, and measured via the variation of a volume. Therefore, this installation summarizes quite well the different means to measure a flow rate of an under vacuum system.
A loss of molar density in the upper volume means an increase in molar density in the lower volume. Considering the equation of state of perfect gases, the molar flow rate NL03 through the orifice between the upper and the lower chambers can be expressed by Equation [1.2].
03 T g R ) L3 P u3 (P 03 C 03 L N FM L N ⋅ − ⋅ − = = [1.2] where C03 Conductance in step 3 NL03 Molar flow rate in step 3 NLFM Flowmeter molar flow rate
PL3 Pressure in the lower chamber in step 3 Pu3 Pressure in the upper chamber in step 3 Rg Perfect gas constant
Sp Piston surface
Chapter 1 - Inventory of methods to calibrate leak flow rate 8 In order to maintain this flow rate constant, the differential pressure must remain constant. Therefore the capacity of the variable volume varies with the translation of a piston: the translation speed vXP of the piston will be expressed by Equation [1.3].
( )
( )
3 3 3 3 r T g R t V r P w T g R t V w P 03 L N 03 L N p S w3 P w3 T g R P X v ⋅ Δ Δ ⋅ ≈ ⋅ Δ Δ ⋅ = ⇒ ⋅ ⋅ ⋅ = [1.3] wherePr3 Pressure in the reference volume in step 3 Pw3 Pressure in the variable volume in step 3
Tr3 Temperature in the reference volume of the flowmeter in step 3 Tw3 Temperature in the variable volume in step 3
VXP Translation speed of the piston ΔV Variation of the volume Δt Variation of the time
However, in this case, the system is evacuated: at the beginning the pressure is near zero. Therefore, the speed of the piston is almost infinite. The best solution is then to exhaust the gas in the lower chamber. Thus the pressure in the lower chamber will be expressed by [1.4].
pump3 v 03 T g R 03 L N L3 P ⋅ • = [1.4] where
PL3 Pressure in the lower chamber chamber in step 3 T03 Temperature in the upper chamber in step 3 vpump3 Pumping speed in step 3
Therefore, Pu3 can be expressed by Equation [1.5].
⎥⎦ ⎤ ⎢⎣ ⎡ ⎥⎦ ⎤ ⎢⎣ ⎡ ⋅ + ⋅ ⋅ = pump3 v 03 C pump3 v 03 C r3 T03 T ) Δt ΔV ( r3 P u3 P [1.5] where C03 Conductance in step 3
Pu3 Pressure in the upper chamber in step 3
Finally, considering that the conductance is proportional to
T
, the unknown flow rate is calculated by Equation [1.6]. ⎥ ⎥ ⎦ ⎤ ⎢ ⎢ ⎣ ⎡ ⎥ ⎥ ⎦ ⎤ ⎢ ⎢ ⎣ ⎡ ⎥ ⎥ ⎦ ⎤ ⎢ ⎢ ⎣ ⎡ + + × = ⋅ = pump1 v 01 C pump3 v 03 C pump3 v pump1 v 1/2 01 T 03 T u3 P u1 P r3 T g R ) Δt ΔV ( r3 P u3 P u3 P L N L N [1.6]Flow division technique
This technique aims at extending the dynamic range of the system. With the usual method, at flow rates of about 10-12 mol/s, the uncertainties associated with the flowmeter approach 10%. The principle behind the flow division technique is that, for constant orifice conductance and pumping speed, the ratio of the flow rate into the upper chamber at the pressure Pu to the flow rate into the lower chamber (result of the same pressure Pu in the upper chamber) is constant. This constancy is identical for any flow rates and it can be measured considering high flow rates. Thus, the range of measurements is not limited by the dynamic range of the flowmeter.
At first, the ratio must be determined. The following procedure aims at measuring this ratio. Figures 1.5 and 1.6 present the main valving sequences of this procedure. First, the variable and the
Chapter 1 - Inventory of methods to calibrate leak flow rate 9 reference volumes of the flowmeter are filled with gas at the same pressure Pr1 (RU/L). The gas is admitted into the upper chamber. The gas supply is then switched off and the equilibrium is expected. The equilibrium pressure in the upper chamber is recorded: Pu1 (RU/L). The variation of the volume is measured (see Figure 1.5: step1).
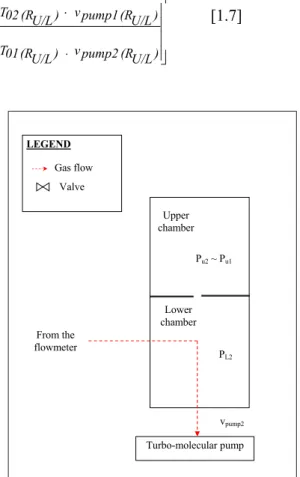
Secondly, the variable and the reference volumes of the flowmeter are filled with gas at the same pressure Pr2 (RU/L). The gas from the flowmeter instead of being transferred into the upper chamber is directly admitted into the lower chamber. The flow rate is adjusted in order that the pressure in the upper chamber Pu2 (RU/L) is equal to Pu1 (RU/L) (see Figure 1.6: step 2). After the equilibrium, the flow rate is measured by the flowmeter: the volume variation is measured. Finally, the ratio is calculated by Equation [1.7].
( )
( )
⎥⎥ ⎥ ⎥ ⎦ ⎤ ⎢ ⎢ ⎢ ⎢ ⎣ ⎡ ⋅ ⋅ ⋅ ⋅ ⋅ ⋅ = ) U/L (R pump2 v . ) U/L (R 01 T . ) U/L (R u2 P ) U/L (R pump1 v ) U/L (R 02 T . ) U/L (R u1 P ) U/L (R r2 T ) U/L (R 1 Δt ΔV ) U/L (R r1 P ) U/L (R r1 T ) U/L (R 2 Δt ΔV ) U/L (R r2 P U/L R [1.7] Turbo-molecular pump From the flowmeter Lower chamber Upper chamber Pu1 (RU/L) T01 (RU/L) PL1 (RU/L) vpump1 (RU/L) LEGEND Valve Gas flow C01 (RU/L)Figure 1.5. Valving sequence for measuring the leak flow rate ratio: step 1.
Turbo-molecular pump From the flowmeter Lower chamber Upper chamber Pu2 ~ Pu1 PL2 vpump2 LEGEND Valve Gas flow
Figure 1.6. Valving sequence of the NIST primary standard for calibrating leak flow rate
through the lower chamber: step 2.
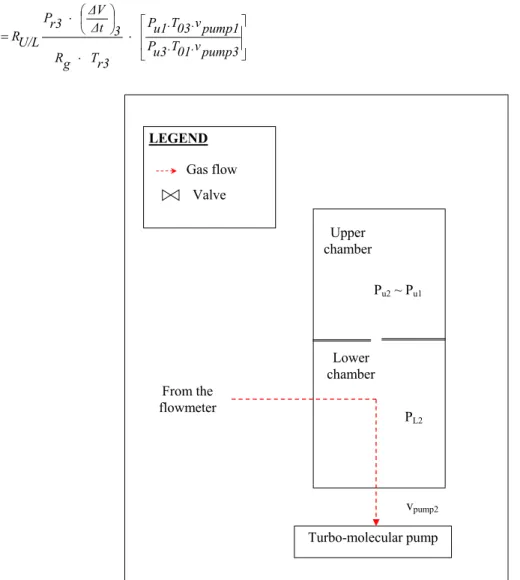
Once the ratio is known, the unknown leak can be calibrated by the following procedure. Step 1:
At first, the gas flow of the unknown leak is directed into the upper chamber, similarly to the previous method. It flows into the lower chamber before being evacuated by the vacuum pump. The equilibrium pressure of the upper chamber is recorded: Pu1 (see Figure 1.1).
Step 2:
The unknown leak is then isolated and gas is introduced into the flowmeter, which delivers gas into the lower chamber. The flowmeter is adjusted (see Figure 1.3) such as the pressure in the upper chamber Pu2 is about Pu1. Therefore, the leak flow rate from the flowmeter is related to the unknown
Chapter 1 - Inventory of methods to calibrate leak flow rate 10 leak: NL = RU/L.NFM. The variable and the reference volumes are at the same pressure Pr2. The flow rate is generated and allowed stabilizing (see Figure 1.7).
Step 3:
Then, as previously, the gas supply is switched off and the variable volume varies by the translation of the piston in order to compensate the leak of gas to maintain the pressure constant; the leak flow rate from the flowmeter is measured (see Figure 1.4) and calculated by Equation [1.8].
⎥ ⎥ ⎦ ⎤ ⎢ ⎢ ⎣ ⎡ ⎟ ⎠ ⎞ ⎜ ⎝ ⎛ ⋅ ⋅ ⋅ = pump3 .v 01 .T u3 P pump1 .v 03 .T u1 P r3 T g R 3 Δt ΔV r3 P U/L R L N
[1.8]
Turbo-molecular pump From the flowmeter Lower chamber Upper chamber Pu2 ~ Pu1 PL2 vpump2 LEGEND Valve Gas flowFigure 1.7. Valving sequence of the NIST primary standard for calibrating leak flow rate through the lower chamber: step 2.
1.3.1.2 Uncertainties
This operating principle used by the NIST presents a significant advantage: it is based on direct comparison of the unknown leak flow rate and of a flow rate generated by a flowmeter. It means that both quantities are flow rates, which implies a simplification of the measurement chain and an optimization of uncertainties.
The uncertainties of a leak flow rate measurement are reported in Table 1.2 (see [NIST92]) and are due to the uncertainties of:
Chapter 1 - Inventory of methods to calibrate leak flow rate 11 the measurement of the flow rate by the flowmeter [CUL87],
the measurement of the pressure inside the upper chamber, the measurement of the chamber temperature,
the measurement of the pump speed, the measurement of the conductance,
the measurement of the “upper/lower ratio” when the flow division technique is considered. Table 1.2 Summary of the uncertainties (in %) of the primary standard for the main technique
(flow into the upper chamber) and for the flow division technique1.
Flow into the upper chamber
Flow division technique
Molar Flow Rate (mol/s)
10
-6-10
-910
-10-10
-1110
-1210
-6-10
-910
-1010
-1110
-12Upper/lower ratio
- - - - 4.0 4.0 4.0Bellows flowmeter
2 0.8 2.0 9.8 - 0.8 2.1 2.1Bellows flowmeter
1 0.02 0.1 1.5 - 0.5 0.5 1.0Upper chamber pressure
0.3 0.3 0.3 - 0.3 0.3 0.3Chamber temperature
0.1 0.1 0.1 - 0.1 0.1 0.1Pump speed and
conductance
0.06 0.06 0.06 - 0.1 0.1 0.1Total
1.3 2.6 12 - 5.5 6.7 7.2However it is difficult to adapt this method at an atmospheric system as the modeling is based on the molecular theory. Therefore, another method is discussed in next section. Contrary to the NIST method, the basic theory of this method is valid for atmospheric systems too. The LNE primary standard measuring helium leak flow rates in evacuated system is based on this method and is described as an example.
1.3.2 Pressure/Volume rise method
1.3.2.1 In an evacuated system
The correlation between the pressure and the temperature of an ideal gas in a chamber is calculated using Equation [1.10]. Then Equation [1.11] can be written deriving Equation [1.10] and considering that the temperature is constant [EHR92].
T g nR
PV = , [1.10]
where n, P, V and Rg are respectively the molar quantity, the pressure, the volume and the perfect gas constant.
1 [NIST92]
2
The components of the uncertainty associated to the flowmeter are enumerated and explained in article [CUL87]. To sum up, the flowmeter measures the flow rate due to the variation of a volume. This variation is due to the displacement of a piston. The flow rate is calculated according to Equation [1.9]. The measurements of the parameters associated to the equation are causes of uncertainties.
l D Δt T g R PV Δ dt L dN = ⎟⎟⎠− − ⎞ ⎜⎜ ⎝ ⎛ [1.9]
Chapter 1 - Inventory of methods to calibrate leak flow rate 12 dt dP V dt dV P dt dn T g R Q = = + [1.11] where Q Throughput t Time
The variation of the volume or of the pressure allows determining the flow rate. Thereby, three possibilities are offered:
only the value of the volume varies, only the value of the pressure varies,
the values of both volume and pressure vary.
These possibilities are described in the literature [IVE82], [HYL96], [LEG97], [BOI06].
While the NIST uses the variation of a volume to measure the flow generated by the flowmeter, the LNE has adopted the “Pressure rise Method”, whose schematic diagram is presented in Figure 1.8 and described in the literature [LEG97], [BOI06]. It means that sole the pressure value varies, while the volume and temperature are constants. As the pressure is measured by a capacitive manometer (the signal results from the deformation of a membrane), it is not correlated to the gas considered. The calculation of the flow rate is based on Equation [1.12].
dt dP V dt dn T g R Q = = [1.12]
The measurement can be divided in 3 steps. The total volume of the test bench is composed of the standard volume, a chamber Vs, and the volume of the connections Vfittings.
First, valves 1, 2, 3, and 4 are opened. The temperature is recorded. When the pressure has reached a value around 1 Pa abs., valve 1 is closed. Pressure P1 in the total volume is measured and recorded along the time. In this configuration, the pressure rise in the total volume can be measured and the flow rate of the leak directed into the total volume can be expressed by Equation [1.13].
(
V Vfttings)
1 dt1 dP 1 Q = ⋅ s+ [1.13] 1. Unknown leak,2a et 2b. Platinum resistance thermometers, 3. 0,3 dm3-standard volume, 4. Manometer, 5. Vacuum pump, V1 à V4. Valves 4 1 2a 3 2 b V1 V2 V3 V4 5
Figure 1.8. Schematic diagram of the operating principle of the pressure rise method [BOI06].
Secondly, valve 1 is opened again to evacuate the gas in the chamber. Then valves 1 and 3 are closed. The standard volume is isolated from the rest of the installation. It means that pressure P2 in the connection volumes is recorded along time and the pressure rise is calculated by the least squares method. Therefore the flow rate of the leak directed into the total volume can be expressed by Equation [1.14].
(
Vfittings)
2 dt2 dP 2 Q = ⋅ [1.14]Chapter 1 - Inventory of methods to calibrate leak flow rate 13 Thirdly, as a residual flow may be detected, the pressure rise must be checked when the leak is not directed inside the volume of the installation. Valve 1 is opened until the pressure reaches a value around 1 Pa absolute. Next, valves 1 and 2 are closed and the variation of the residual pressure P3 is determined by the least squares method. Then the residual flow rate can be expressed by Equation [1.15]. ) (V 3 dt3 dP 3 Q = ⋅ fittings [1.15] By combining Equations [1.13], [1.14] and [1.15], the leak flow rate can be expressed by Equation [1.16]. ⎟⎟ ⎟ ⎟ ⎠ ⎞ ⎜⎜ ⎜ ⎜ ⎝ ⎛ − − + ⋅ ⋅ = 1 dt 1 dP 2 dt 2 dP 3 dt 3 dP 1 dt1 dP 1 1 dt1 dP V L Q s [1.16]
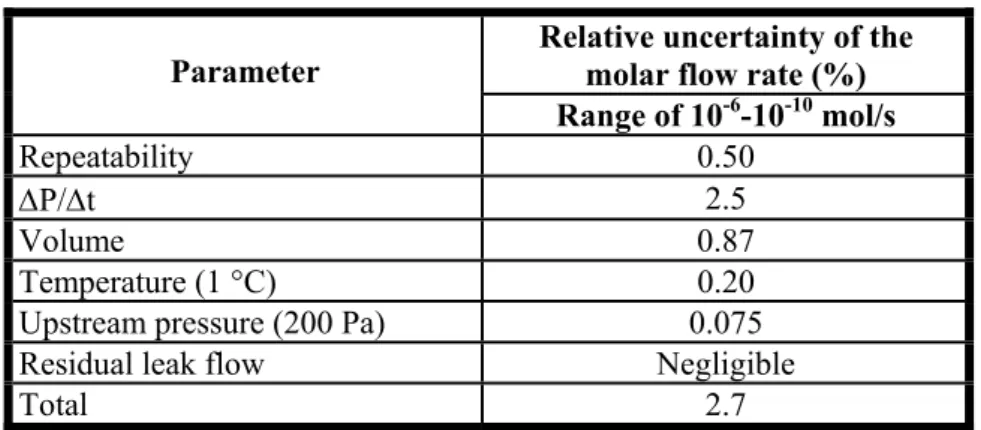
This method allows measuring leak flow rates between (2 x 10⁻⁷) Pa.m3.s-1 (or 8 x 10-11 mol.s-1) and (1 x 10⁻¹)Pa.m3.s-1 (or (5 x 10⁻⁵)mol.s-1), whatever the gas [EHR96]. The uncertainties associated to this method are evaluated around 2% at (1 x 10⁻¹)Pa.m3.s-1 and up to 8% at (2 x 10⁻⁷) Pa.m3.s-1. Table 1.3 gives the uncertainty budget of the pressure rise method.
Table 1.3. Relative Standard Uncertainty of the pressure rise method. Relative uncertainty of the
molar flow rate (%) Parameter Range of 10-6-10-10 mol/s Repeatability 0.50 ΔP/Δt 2.5 Volume 0.87 Temperature (1 °C) 0.20
Upstream pressure (200 Pa) 0.075
Residual leak flow Negligible
Total 2.7
The comparison of Tables 1.2 and 1.3 underlines that both methods can measure the helium leak flow rate with an uncertainty between 1.3% and 2.7%. The NIST standards can extend the measurement to the range between 10-10 and 10-12 mol/s with relative uncertainties between 5.5% and 12%.
The span of refrigerant leaks to be detected can be considered as varying from 1 to 50 g/yr, which are included between (3.1 x 10⁻¹⁰) mol/s and (1.6 x 10⁻⁸) mol/s for leaks of R-134a: if a refrigerant leak works in an evacuated system, both methods could measure refrigerant leaks with an acceptable uncertainty. Therefore, the remaining issue is to determine if the method can be really adapted and gives a result with a reasonable uncertainty. As the NIST standard is based on the molecular theory, it seems to be easier to adapt the pressure rise method to calibrate leaks flow rates directed into a system at a pressure near the atmospheric pressure.
1.3.2.2 In a system at atmospheric pressure
While the principle of primary standard of NIST is based on the molecular statistics, the pressure rise method fits to leaks working at atmospheric pressure. The gas considered in this section is R-134a. The temperature of the installation is (20 ± 1) °C. If a leak of 10 g/yr is connected to the standard volume of the test bench (300 cm3), the pressure raises by 1.5 Pa every minute.
An available absolute manometer has an expanded uncertainty about 10 Pa for a measurement of pressure about 101.3 kPa, while an absolute manometer measuring at pressures about 0.001 kPa to
Chapter 1 - Inventory of methods to calibrate leak flow rate 14 10 kPa has a relative expanded uncertainty around U = 1.0 x 10⁻³. The influence of the temperature in pressure measurement is higher when the pressure is about 10 kPa than when the pressure is about 20 Pa. The variation of 1 °C in the standard volume at 20 °C causes a variation of 0.35 kPa in a volume at a pressure near the atmospheric pressure. In an evacuated system like the one available at LNE, the standard volume pressure is close to 20 Pa. Therefore, a variation of 1 °C in the volume - whose temperature is 20 °C - causes a variation of 0.070 Pa in the volume.
Therefore, the uncertainty of the pressure rise-measurement at a pressure close to the atmospheric pressure is about a hundred times higher than in an evacuated system. Using an R-134a leak of 10 g/yr, it takes 80 minutes to obtain a pressure about the uncertainty inside the volume and 9 days to obtain a pressure one hundred times higher than the uncertainty of the pressure measurement. In that conditions, the calibration takes too much time. Because it takes too much time, some parameters that are not controlled may influence the result, such as the residual leakage of the installation and the temperature changes. To conclude, this method is not suitable to measure refrigerant leak flow rates at a pressure near the atmospheric pressure [CLO98-8].
1.3.3 Adaptability of measurements of refrigerant leaks in evacuated
systems
A measurement chain already exists for the calibration of helium leaks in evacuated systems. But it cannot be adapted to refrigerant leaks in their working conditions (atmospheric pressure) and in the range from 1 g/yr to 50 g/yr. Then, the easiest solution would be to calibrate leaks filled with helium in evacuated systems and to convert the results for the same leak filled with R-134a and its downstream pressure about the atmospheric pressure. However, it needs reliable mathematical conversion fittings, which are not available yet. The reasons are discussed in this paragraph.
The leak flow rate mainly depends on the nature of the fluid and on the leak flow regime. Especially, three different models related to the Knudsen number can be defined [CLO98-6]. The Knudsen number Kn is described by a semi-empirical formula (Equation [1.20]):
2 downstream p upstream p D μ unitary ρ 0,7963 l Kn m
D
= ⋅ ⋅ ⋅ + = [1.20] whereD Characteristic diameter of the capillary tube e Wall thickness
lm Molecular mean free path pupstream Upstream pressure pdownstream Downstream pressure μ Dynamic viscosity
ρunitary Unitary density
It allows classifying the flows between three classes [CLO98-6], [BLA91]: the molecular regime (Kn ≤ 2)
the transient regime (2 ≤ Kn ≤ 200), and the viscous regime (Kn ≥ 200).
While helium leaks work at the molecular regime or transient regime, refrigerant leaks work at the viscous regime. Then, calibrating the refrigerant leaks in an evacuated system means studying these types of leaks in a molecular or transient regime, whereas they usually work in the viscous regime. It means that a conversion is necessary.
Chapter 1 - Inventory of methods to calibrate leak flow rate 15 At first, it means that the regime of the leak is well known. It implies that the Knudsen number is calculated. However, the Knudsen number depends on the mean pressure across the leak and on the diameter of the leak, and most of the capillary leaks are crimped leaks. The issue is the definition of the diameter: is it the minimum diameter or a mean diameter of the tube? Without this data or a proper definition of this data, the regime cannot be predicted.
Secondly, the transient regime is not well-known [BER06]. For a capillary leak, some modeling expressions of the flow rate according to the flow regime are given3. The molar mass is the main parameter for a molecular regime, whereas the viscosity is the relevant parameter of a viscous regime [CLO02]. It seems logical that both parameters occur in the expression of the flow rate in the transition regime. The literature gives some fittings of the flow regimes [BLA91], [DELA61], [TIS93]. Some are reported in Equations [1.21], [1.22], and [1.23].
Molecular Regime
(
Pupstream Pdownstream)
M 1 3 D . a N T 2π 6 1 Ql
⋅ • − ⋅ ⋅ = kB [1.21]Transition regime (Knudsen formula)
⎟ ⎠ ⎞ ⎜ ⎝ ⎛ ⎟ ⎟ ⎟ ⎟ ⎟ ⎟ ⎠ ⎞ ⎜ ⎜ ⎜ ⎜ ⎜ ⎜ ⎝ ⎛ ⎟ ⎟ ⎠ ⎞ ⎜ ⎜ ⎝ ⎛ μ ⎟ ⎟ ⎠ ⎞ ⎜ ⎜ ⎝ ⎛ μ ⎟ ⎟ ⎠ ⎞ ⎜ ⎜ ⎝ ⎛ − • + ⋅ ⋅ + + ⋅ ⋅ + ⋅ ⋅ ⋅ ⋅ π + μ + = downstream P upstream P 2 downstream P upstream P D . T B k .M a N 1,24. 1 2 downstream P upstream P D . T B k .M a N 1 M 1 3 D . a N T B k 2 6 1 .l 2 downstream P upstream P . 4 D 128 π Q l [1.22] Viscous Regime ⎟ ⎠ ⎞ ⎜ ⎝ ⎛ ⎟ ⎟ ⎠ ⎞ ⎜ ⎜ ⎝ ⎛ − • μ + = downstream P upstream P .l 2 downstream P upstream P . 4 D 128 π Q [1.23]
However, the expression, which aims at quantifying gas flow rate in the transition region between molecular and viscous flows, based on first principles of the kinetic theory of gases, remains elusive [BER06], [NIST92]. Therefore, it is not possible already to deduce the behavior of a gas in the viscous region from its behavior in the under vacuum region. Refrigerant leaks must be calibrated at atmospheric pressure.
A study (EURAMET project n°911) including the LNE and the Istituto Nazionale di Ricerca Metrologica (INRIM) is being carried out. The aim of the project is to describe the gas-flow through a reference leak (generally geometrical leak of the capillary type) when the transition regime takes place in it with a simple equation that allows converting the throughput of one gas (He) specie to that of another gas. For instance, the same leak supplied with Helium or R-134a was measured by the LNE using the Pressure rise method. The results observed when the leak is supplied with Helium were compared with the INRIM’s measurements via a flowmeter in the same conditions. The deviation between the two results is coherent with the uncertainty of the measurements in evacuated systems (< 2 %). At atmospheric pressure, the deviation is higher: about 10 %. The installation (pressure rise method) at LNE is qualified as an evacuated system. Therefore, the method used at atmospheric pressure implies an uncertainty superior to 10 %. The measurement range is a hundred times higher than the range of calibrated refrigerant leaks (1 g.yr-1 to 50 g.yr-1). However, these results are sufficient to conclude that the flow rate clearly depends on the nature of the fluid, the flow rate regime, and the difference between the upstream and the downstream pressures (see Figure 1.9).
![Figure 1.8. Schematic diagram of the operating principle of the pressure rise method [BOI06]](https://thumb-eu.123doks.com/thumbv2/123doknet/2992152.83529/25.892.404.779.517.896/figure-schematic-diagram-operating-principle-pressure-rise-method.webp)