Seismically retrofitting reinforced
concrete moment resisting frames by
using expanded metal panels
Thèse présentée par
PHUNG NGOC DUNG
en vue de l'obtention du grade de
Docteur en Sciences de l’Ingénieur
2011
Faculté des Sciences AppliquéesDépartement d'Architecture, Géologie, Environnement et Constructions Secteur Ingénierie Structurale
Acknowledgments
I would like to express my deepest appreciation to my advisor Professor André Plumier for his guidance throughout my thesis, his kindness and encouragement and also many thanks to his nice family.
I am very grateful to Doctor Hervé Degée for helping me understand many fundamental things in dynamics of structures and direct displacement based design.
I would like to thank the Vietnamese Government and the French Community of Belgium for funding for the research.
I would like to thank all people in Structural Engineering Sector of ArGenCo department at the University of Liège.
I would like to thank my wife Minh Hien, my daughters Minh Thu and Minh Hoa, who are always by my side during my time at University of Liège.
ABSTRACT OF THE DISSERTATION
Reinforced concrete moment resisting frames (RC-MRFs) have been widely used as the main structural resisting systems for over 30 years based on their capacity in resisting both gravity loads and lateral forces like winds or earthquakes and on low cost of construction. However, there have been still many existing RC-MRFs not designed according to any modern seismic code. This may lead to some undesired failures under a rather low intensity earthquake. There are several existing retrofitting systems available for seismically retrofitting RC-MRFs, such as steel braces, steel plate or RC shear walls, base isolators…In those, some are able to increase the stiffness, strength, deformation and energy absorbing capacity of the structures and some are able to reduce the influence of the seismic actions on the structure. Despite having advantage in increasing the stiffness and strength for the buildings, the use of bulky systems like RC shear walls to retrofit buildings under seismic actions becomes more limited due to its complication in erection and high costs for foundation. The use of lighter retrofitting systems such as steel braces or shear walls made from steel or aluminium… has been becoming more favourable.
Made from sheet steel or various alloys by cutting and simultaneous stretching cold, expanded metal is considered as a macro-foam material. An expanded metal panel (EMP) with rectangular dimensions of 1.25m x 2.5m having many rhomb shape stitches with different geometrical sizes is the popular product. Currently it is employed primarily in the areas of protection (fencing, gates) and architecture. The final goal of this study is to consider a new application different in the field of civil engineering and more specifically that of the earthquake resistance of buildings. The work plan includes two main parts. This first part will set the EMP over existing techniques and see if its use is justified in the context of earthquake resistance. In addition, a more detailed description of the EMP is considered. In this way, the different data required for modelling the new resistance system are known and analyzes, tests and comparisons can be made in order to validate the use of EMP in the context of earthquake resistance. A complete study on pure shear behaviour of EMP under monotonic and quasi-static cyclic loading has been developed including experimental, theoretical and numerical investigations.
To apply EMP in seismically retrofitting RC-MRFs, thirty two RC-MRFs have been designed according to two codes EC2 and EC8. The seismic performance of the studied frames has been evaluated using Pushover and NLTH analyses. For the frames designed according to EC2 or EC8 with low ductility, some prominent deficiencies are found, such as incomplete load path or the soft-story failure. Based on the knowledge of deficiencies of the existing frames, many attempts to exploit EMP to seismically retrofit the existing frames have been made. All frames designed according to EC2 and EC8 with Low Ductility Class need to retrofit because they cannot reach the target displacements due to premature failure of beam-column joints. To seismically retrofit them by using EMP, a design procedure based on Direct Displacement Based Design (DDBD) has been proposed. The design is an iterative procedure, starting with the selection of the target displacements at the top based on the results from Pushover analysis. They are usually less than the limit displacements at which RC frames collapse due to crushing of the concrete at beam-column joints. These displacements are also the target ones for the retrofitted frames. The results from design procedure proposed are significantly affected by some typical factors such as selected target displacements and capacity of the existing frames contributing to overall resistance of the retrofitted frames, equivalent viscous damping of the EMP and MRFs as well as geometrical dimensions of the existing frames. The retrofitted design results, assessed by Pushover and NLTH analyses, have indicated that DDDB is a useful tool to design EMP to seismically retrofit the existing frames. With EMP, all retrofitted frames can reach target displacements under design earthquakes without any brittle failure, not like the original frames. However, EMP cannot improve the behaviour of the beam-column joints. Under the earthquakes greater than design ones, failure of the nodes is still observed in all retrofitted frames. The comparison of the seismic performance of the frames before and after being retrofitted has shown that EMP is able to reduce the influence of the earthquake on the original frames by increasing their strength and stiffness and by absorbing the seismic energy. Proposed design procedure of connection between EMP and the frame elements is applicable. This was verified in the experiments when connecting EMP with the steel testing frames. The design approach for the connection is based on Capacity Design, all starting with the maximum resistance of the bars in a rhomb-shape stitch of the EMP and the tension field action developed in the EMP during shear loading. However, it is necessary to perform tests on the connections between EMP and the RC beams and columns. Also, improved practical details can be developed.
LIST OF CONTENTS
LIST OF CONTENTS ... 7
LIST OF TABLES ... 15
LIST OF FIGURES ... 19
LIST OF SYMBOLS AND ABBREVIATIONS ... 29
1. INTRODUCTON ... 41
1.1. Problem description and motivation ...41
1.2. Objectives and Scope of the research ...42
1.3. Organisation of the thesis ...42
2. OVERVIEW OF SEISMIC EVALUATION AND RETROFIT OF REINFORCED CONCRETE MOMENT RESISTING FRAMES (RC-MRFS) ... 43
2.1. Introduction ...43
2.2. Determination of performance levels, seismic hazards, performance objectives, and deficiencies of the existing RC-MRFs ...44
2.2.1. Performance levels ...44
2.2.2. Seismic hazards ...46
2.2.3. Performance objectives ...47
2.2.4. Determination of deficiencies of an existing RC-MRFs ...47
2.3. Analysis methods to evaluate the seismic performance and deficiencies of RC-MRFs ...48
2.3.1. Capacity ...49 2.3.2. Demand (displacement) ...49 2.3.3. Performance ...51 2.4. Retrofit strategies ...51 2.4.1. Technical strategies ...52 2.4.1.1. System completion ...53
2.4.1.2. System strengthening and stiffening ...53
2.4.1.3. Enhancing deformation capacity ...54
2.4.1.4. Reducing earthquake demands ...55
2.4.2. Management strategies ...55
2.5. Recent Seismic Retrofitting systems for RC-MRFs ...55
2.5.1. Retrofitting System using Conventional Steel Concentric Braces (CBFs)...55
2.5.1.1. Introduction ...55
2.5.1.2. Configuration of CBFs ...55
2.5.1.3. Experimental studies on CBF ...56
2.5.1.4. Analytical studies and hysteretic behaviour of CBF...58
2.5.1.5. Design concepts of retrofit of RC-MRFs using CBF ...59
2.5.2. Retrofitting system using Steel Buckling Restrained Braces (BRBs) ...60
2.5.2.1. Introduction ...60
2.5.2.3. Development and studies of BRBs ...61
2.5.2.4. BRB hysteretic behaviour ...63
2.5.2.5. BRB design concept ...63
2.5.3. Retrofitting system using Steel Eccentric Braces (EBFs) ...64
2.5.3.1. Introduction ...64
2.5.3.2. Configuration of EBF ...64
2.5.3.3. The hysteretic behaviour of the link ...65
2.5.3.4. EBF design concept ...65
2.5.4. Retrofitting system using Steel Plate Shear Walls (SPSWs) ...66
2.5.4.1. Introduction ...66
2.5.4.2. Analytical studies of shear walls under shear loading ...67
2.5.4.3. Experimental and numerical studies ...71
2.5.4.4. Contribution of the external frame to the overall resistance of SPSWs ...76
2.5.4.5. Hysteretic behaviour of SPSW ...78
2.5.4.6. Seismic Design of SPSWs ...79
2.5.4.7. Behaviour or Response Modification factors of SPSWs ...81
2.5.4.8. Connections between SPSW and the boundary frames ...81
2.5.5. Retrofitting system using Low Yield Steel Shear Walls (LYSWs) ...82
2.5.5.1. Introduction ...82
2.5.5.2. Mechanical characteristics of the LYS ...83
2.5.5.3. Experimental and numerical studies of LYSWs ...84
2.5.6. Retrofitting system using Aluminium Shear Walls (ASWs) ...85
2.5.6.1. Introduction ...85
2.5.6.2. Mechanical properties of Aluminium ...85
2.5.6.3. Experimental and numerical studies of ASWs ...86
2.5.7. Retrofitting system using Perforated Shear Walls (PSWs) ...88
2.5.8. Retrofitting system using Reinforced Concrete Shear Walls (RCSWs) ...90
2.5.8.1. Introduction ...90
2.5.8.2. Capacity design of the walls ...91
2.5.8.3. Ductile walls ...91
2.5.8.4. Large lightly reinforced walls ...93
2.5.8.5. Prefabricated walls ...94
2.5.9. Retrofitting system using Composite Shear Walls (CSWs) ...94
2.6. Conclusions ...98
3. INTRODUCTION ABOUT EXPANDED METAL PANELS (EMP) AND PREVIOUS STUDY ON EMP ... 101
3.1. Introduction about EMP ... 101
3.1.2. Types of EMP and current applications ... 102
3.1.3. Mechanical properties of EMP ... 103
3.1.4. Conclusions... 103
3.2. Previous studies on EMP ... 103
3.2.1. Pure plane shear behaviour ... 103
3.2.2. Complete 3D analytical model of EMP under shear loading ... 104
3.2.3. Ultimate behaviour of square EMP loaded in shear: ... 105
3.2.4. Some concluding remarks of the study by Pecquet (Pecquet, 2005) ... 106
4. EXPERIMENTAL STUDY ON EXPANDED METAL PANELS (EMP) ... 107
4.1. Introduction ... 107
4.2. Design Considerations and Objectives of Experiments ... 108
4.3. Specimens ... 109
4.3.1. Specimens for tensile tests... 111
4.3.2. Specimens for shear tests in small scale ... 111
4.3.3. Specimens for shear tests in large scale ... 114
4.3.4. Test frame ... 116
4.3.4.1. Test frame in small scale tests ... 116
4.3.4.2. Test frame in large scale tests ... 119
4.4. Test procedures ... 120
4.4.1. Tensile tests ... 120
4.4.2. Monotonic test phase ... 121
4.4.3. Quasi-static cyclic test phase ... 121
4.5. Test observations ... 122
4.5.1. Tensile tests ... 122
4.5.2. Small scale tests ... 122
4.5.2.1. Monotonic loading test phase ... 122
4.5.2.2. Cyclic test phase ... 125
4.5.3. Tests in large scale ... 131
4.5.3.1. Monotonic loading phase ... 131
4.5.3.2. Cyclic loading phase ... 134
4.6. Summary of observations ... 137
5. SIMULATIONS OF THE TESTS AND PARAMETRIC STUDY OF EMP SUBJECTED TO SHEAR LOADING BY NUMERICAL APPROACH ... 139
5.1. Introduction ... 139
5.2. Numerical simulations of the tests... 139
5.2.1. Description of the model ... 139
5.2.1.1. Modelling of the components of the test ... 139
5.2.1.3. Initial conditions ... 142
5.2.1.4. Solution strategies ... 143
5.2.2. Comparison of numerical analysis and experimental studies of EMP under monotonic shear loading ... 144
5.2.3. Comparison of numerical analysis and experimental studies of EMP under cyclic shear loading ... 147
5.2.4. Summary and conclusions ... 149
5.3. Parametric study on EMP loaded in shear ... 149
5.3.1. Introduction ... 149
5.3.2. Description of the typical test model in the parametric study... 150
5.3.2.1. Components of the model ... 150
5.3.2.2. Finite elements ... 150
5.3.2.3. Material characteristics of bars ... 151
5.3.2.4. Characteristics of the boundary frames ... 152
5.3.2.5. Initial conditions ... 152
5.3.2.6. Residual stress ... 152
5.3.2.7. Steps of analyses and solution strategy ... 152
5.3.3. Behaviour of the EMP under monotonic shear loading ... 153
5.3.3.1. Prior-to-buckling shear resistance of EMP ... 153
5.3.3.2. Effects of initial deformations or imperfections on ultimate resistance of the EMP 156 5.3.3.3. Maximum or post-buckling shear resistance of the single EMP and equivalent models 157 5.3.3.4. Shear resistance of a combined EMP ... 162
5.3.3.5. Drifts and Ductility of the EMP ... 164
5.3.4. Simplified behaviour of the EMP under cyclic shear loading ... 165
5.3.4.1. Cyclic shear loading behaviour of common structural systems ... 165
5.3.4.2. Comparison of the hysteresis behaviours ... 167
5.3.4.3. General steps to analyse EMP under quasi-static cyclic shear loading ... 167
5.3.4.4. Description of hysteretic behaviour of EMP loaded in shear by numerical simulations 168 5.3.4.5. Simplified analytical model for hysteretic behaviour of EMP loaded in shear ... 171
5.4. Conclusions ... 172
6. DESIGN OF REINFORCED CONCRETE MOMENT RESISTING FRAMES (RC-MRFS) ... 175
6.1. Introduction ... 175
6.2. General criteria and design steps pf RC-MRFs according to EC2 ... 175
6.2.1. Preliminary design ... 175
6.2.2. Limit states ... 176
6.2.3.1. Concrete ... 176
6.2.3.2. Steel ... 177
6.2.4. Design situations ... 178
6.2.5. Partial factors of safety ... 178
6.2.5.1. Partial factors of materials (γm) ... 178
6.2.5.2. Partial factors of actions (γf)... 178
6.2.6. Actions ... 179
6.2.6.1. Characteristic values of actions ... 179
6.2.6.2. Load combinations at ultimate limit states: ... 180
6.2.6.3. Load combinations at serviceability limit states ... 180
6.2.7. Analysis of internal forces of RC-MRFs ... 180
6.2.7.1. Modelling and idealisation of the frames ... 180
6.2.7.2. Structural Analysis ... 181
6.2.7.3. Second order effects ... 181
6.2.8. Analysis of the sections at ultimate limit states ... 182
6.2.9. Check for serviceability limit states ... 183
6.3. Design of RC-MRFs according to EC2 and EC8 ... 183
6.3.1. General introduction about seismic design ... 183
6.3.2. Design concepts, limitations of the studied RC-frames in accordance with EC8... 184
6.3.3. General criteria of the design process ... 185
6.3.3.1. Design situations ... 185
6.3.3.2. Materials ... 186
6.3.3.3. Partial factors of safety... 186
6.3.3.3.1. Partial factors of materials (γm)... 186
6.3.3.3.2. Partial factors of actions (γf) ... 186
6.3.4. Actions ... 186
6.3.4.1. Actions in cases of persistent design situations ... 186
6.3.4.2. Actions in cases of seismic design situations ... 187
6.3.4.2.1. Ultimate limit states and no-collapse requirements (NCR) ... 187
6.3.4.2.1.1. Design peak ground acceleration (PGA) ... 187
6.3.4.2.1.2. Elastic spectra of the horizontal components in EC8 ... 187
6.3.4.2.1.3. Design spectrum for elastic analysis ... 188
6.3.5. Ground types ... 189
6.3.6. Methods of analysis ... 189
6.3.7. Simplified modelling of the frames for linear analysis ... 190
6.3.8. Combinations of actions ... 192
6.3.9. Capacity design for longitudinal reinforcements of columns and transverse reinforcements of
beams and columns ... 193
6.3.10. Detailing requirements ... 195
6.4. Case study structures ... 200
6.4.1. Description of case study RC-MRFs ... 200
6.4.2. RC-MRFs designed according to both EC2 and EC8 ... 206
6.4.2.1. Global design results ... 208
6.4.2.2. Longitudinal reinforcement configurations of the RC-MRFs studied ... 211
6.4.2.3. Capacity design for transversal reinforcements of beams and columns ... 216
6.4.3. Some concluding remarks on the reinforcement configurations between DCL and DCM design of RC-MRFs in EC8-group ... 217
6.4.4. RC-MRFs designed according to EC2 ... 217
6.4.4.1. Frame analysis ... 217
6.4.4.2. Longitudinal reinforcement configurations of the beams and columns of studied frames ... 219
6.4.4.3. Transversal reinforcement Configuration and Limitations of the studied RC-MRFs 221 6.5. Summary ... 222
7. SEISMIC EVALUATION OF EXISTING RC-MRFS ... 225
7.1. Introduction ... 225
7.2. Steps for seismic evaluation of the existing RC-MRFs ... 225
7.3. General models of RC-MRFs for seismic evaluation ... 226
7.3.1. Introduction ... 226
7.3.2. Modelling of beams and columns ... 226
7.3.2.1. Linear elastic beam element ... 227
7.3.2.2. Inelastic beam element ... 228
7.3.3. Damping ... 234
7.4. Seismic actions ... 235
7.5. Nonlinear methods of seismic evaluation of RC-MRF ... 236
7.5.1. Nonlinear static (‘Pushover’) analysis ... 236
7.5.2. Nonlinear dynamic (time-history) analysis (NLTH) ... 241
7.6. Seismic performance of the case study RC-MRFs ... 241
7.6.1. Introduction ... 241
7.6.2. Basic Assumptions and methodology for nonlinear analyses ... 241
7.6.2.1. Methodology ... 241
7.6.2.2. Detail modelling assumption and input data ... 242
7.6.2.3. Responses controlled the seismic performance of the studied RC-MRFs ... 248
7.6.2.4. Definition of ductility and ultimate response for the RC-MRFs ... 249
7.6.3.1. Brief re-description of the existing RC-MRFs ... 250
7.6.3.2. Linear and nonlinear periods of the studied RC-MRFs ... 251
7.6.3.3. Nonlinear response of the studied RC-MRFs ... 253
7.7. Concluding remarks ... 268
8. ON THE USE OF EMP TO SEISMICALLY RETROFIT OR UPGRADE RC-MRFS .. 269
8.1. Introduction ... 269
8.2. Summary of geometrical characteristics and seismic behaviour of EMP under shear ... 269
8.2.1. Summary of typically geometrical configurations of EMP ... 269
8.2.2. Summary of seismic behaviour of EMP under shear ... 270
8.3. Background of Direct Displacement-Based Design (DDBD) ... 272
8.3.1. The need of Direct Displacement-Based Seismic Design approach for retrofitting RC-MRFs by using EMP ... 272
8.3.2. Background of Direct Displacement-Based Design (DDBD) for RC-MRFs ... 272
8.3.2.1. General background of DDBD ... 273
8.3.2.2. The main governing steps of DDBD for designing or retrofitting a frame structure 273 8.4. Application of DDBD for seismically retrofitting RC-MRFs by using EMP... 276
8.4.1. General introduction ... 276
8.4.2. Target displacements or target drifts for the retrofitted RC-MRFs and maximum shear resistance of the RC-MRFs ... 276
8.4.3. Target displacement profiles for the retrofitted RC-MRFs ... 277
8.4.4. Equivalent Viscous Damping of RC-MRF with EMP ... 278
8.4.4.1. EVD of the reinforced concrete frames ... 279
8.4.4.2. EVD of the EMP ... 280
8.4.4.3. EVD of the retrofitted RC-MRFs with EMP ... 282
8.4.5. Design, selection and distribution of EMP for the RC-MRFs ... 282
8.4.6. Chart for design of EMP to seismically retrofit the frames ... 284
8.5. Design of EMP retrofitting in case study RC-MRFs using DDBD method ... 286
8.5.1. Case study example 1 ... 286
8.5.2. Case study example 2 ... 291
8.5.3. Verification of the proposed method and seismic evaluation of the case study RC-MRFs retrofitted by EMP using Pushover and NLTH analyses ... 296
8.5.3.1. Modelling of RC-MRFs and seismic input for nonlinear analyses ... 296
8.5.3.2. Modelling of EMP for nonlinear analyses ... 296
8.5.3.3. Seismic response of the retrofitted frames in comparison with the ones before retrofitting of the two examples by Pushover and NLTH analyses ... 297
8.5.4. General results of retrofitting design of the existing frames based on DDBD ... 300
8.5.4.1. RC-MRFs in EC2 group ... 300
8.6. Nonlinear response of the retrofitted structures in comparison with the structures before
retrofitting ... 304
8.6.1. Periods ... 304
8.6.2. Comparison of nonlinear response of the studied RC-MRFs before and after retrofitted .. 305
8.7. Some existing practical solutions to retrofit beam-column nodes or to increase shear resistance of RC beams and columns ... 330
8.8. Design of connections of EMP with boundary elements of the frames ... 331
8.8.1. Description of the connection between EMP and the frame elements ... 332
8.8.2. Design of the connections between EMP and the frame’s elements ... 332
8.8.2.1. Design of the connection between EM sheets to obtain a complete EMP ... 332
8.8.2.2. Design of the connection between EMP and the boundary frame elements ... 333
8.8.3. An example of designing the connections between EMP and the frame’s elements ... 333
8.8.3.1. Connection between EM sheets to obtain a complete EMP ... 333
8.8.3.2. Connection between EMP and the boundary frame elements ... 334
8.9. Concluding remarks ... 338
9. CONCLUSIONS AND RECOMMENDATIONS ... 341
9.1. Conclusions ... 341
9.2. Recommendations ... 344
LIST OF TABLES
Table 2-1 – Building performance levels in FEMA 356 (2000) ...45
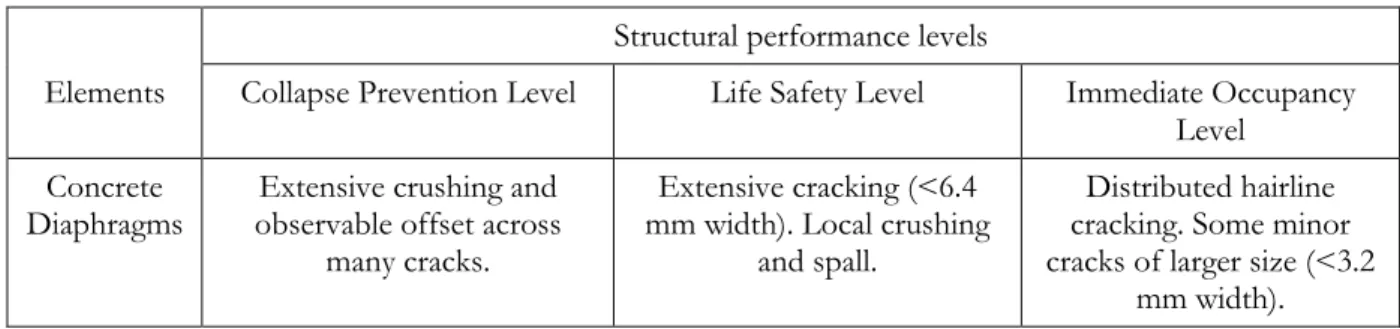
Table 2-2 – Structural performance levels and damage – Vertical Elements in FEMA 356 (2000) ...45
Table 2-3 – Structural performance levels and damage – Horizontal Elements in FEMA 356 (2000) ...46
Table 2-4 – Deficiencies in RC-MRFs (ATC 40, 1997) ...48
Table 2-5 – R values for SPSW proposed by Astanaeh-Asl ...81
Table 2-6 – Chemical composition of LYS (Nippon Steel Corp. standard) (Yamaguchi et al., 1998) ...83
Table 2-7 – Mechanical properties of LYS (Nippon Steel Corp. standard) (Yamaguchi et al., 1998) ...83
Table 2-8 – Chemical composition and mechanical properties of EN-AW 1050A (De Matteis et al., 2005) ...86
Table 2-9 – Properties of the test specimens (Astaneh, 2000) ...96
Table 2-10 – A comparison of R and q factors in US and Europe ...98
Table 3-1 – Distinction between the name of normal and flattened types of EMP ... 102
Table 4-1 – Test specimens in small scale tests ... 113
Table 4-2 – Summary of all specimens in large scale tests ... 116
Table 4-3 – Exploiting the data from monotonic tests ... 121
Table 4-4 – Cyclic test procedures ... 121
Table 4-5 – Typical mechanical properties of an EM bar ... 122
Table 4-6 – Monotonic test results in small scale – weld specimens ... 125
Table 4-7 – First four cycle results of specimens with welded connections ... 127
Table 4-8 – Cyclic test results at displacements corresponding to maximum resistance in monotonic tests – welded specimens ... 127
Table 4-9 – Maximum shear resistance in cyclic tests and corresponding displacements – welded specimens ... 128
Table 4-10 – First four cycle results of specimens with epoxy-glued connections ... 128
Table 4-11 – Cyclic testing results at displacements corresponding to maximum resistance in monotonic tests – epoxy-glued specimens ... 129
Table 4-12 – Monotonic test results in large scale ... 131
Table 4-13 – First four cycle results of specimens with welded connections ... 135
Table 4-14 – Cyclic results at displacements corresponding to ultimate forces in monotonic tests (*Corres. – Corresponding) ... 136
Table 4-15 – Maximum shear forces in cyclic tests and corresponding displacements ... 136
Table 5-1 – Monotonic test results in small scale ... 145
Table 5-2 - Monotonic results of numerical simulations in small scale ... 145
Table 5-3 – Monotonic test results in large scale ... 145
Table 5-4 – Numerical results of monotonic loading in large scale ... 145
Table 5-5 – First four cycle results of the tests – small scale specimens ... 148
Table 5-6 – First four cycle results of the numerical simulations – small scale specimens ... 148
Table 5-7 – Maximum shear forces in cyclic tests and corresponding displacements – small scale specimens ... 149
Table 5-8 – Maximum shear forces in cyclic numerical simulations and corresponding displacements –
small scale specimens ... 149
Table 5-9 – Material properties of EM bars ... 151
Table 5-10 – Summary of yield and ultimate values of loads and displacements of different square EMP made with A51-27-35-30 ... 168
Table 5-11 – Some controlling parameters for cyclic analyses of different square EMP A51-27-35-30 ... 169
Table 6-1 – Material properties of the concrete C25/30 ... 176
Table 6-2 – Properties of reinforcement ... 177
Table 6-3 – Partial factors of safety applied to the material (γm) ... 178
Table 6-4 – Partial safety factors of the actions at the ultimate limit state (non seismic situations) ... 179
Table 6-5 – Partial safety factors of the actions at the serviceability limit state (non seismic situations) .. 179
Table 6-6 Classification of actions ... 179
Table 6-7 – Imposed loads on the studied buildings ... 180
Table 6-8 – Simplification of analysis of structures (Table 4.1 – EC8) ... 185
Table 6-9 – Partial factors of safety applied to the material (γm) ... 186
Table 6-10 – Partial safety factors of the actions at the ultimate limit state ... 186
Table 6-11 – Partial safety factors of the actions at the serviceability limit state ... 186
Table 6-12 – EC8 values of parameters S, TB, TC and TD defining the elastic response spectrum Type 1 188 Table 6-13 – EC8 rules for detailing and dimensioning of primary beams (secondary beams: as in DCL) (Fardis, 2009) ... 195
Table 6-14 – EC8 rules for detailing and dimensioning of primary beams (secondary beams: as in DCL) (Fardis, 2009) (continue)... 196
Table 6-15 – EC8 rules for detailing and dimensioning of primary columns (secondary columns: as in DCL) (Fardis, 2009) ... 197
Table 6-16 – EC8 rules for detailing and dimensioning of primary columns (secondary columns: as in DCL) (Fardis, 2009) (continued) ... 198
Table 6-17 – Hypothesis and motivation for defining different design in each Configuration ... 202
Table 6-18 – Hypothesis and motivation for defining different design in each Configuration (continued) ... 203
Table 6-19 – List of case study RC-MRFs ... 203
Table 6-20 – Geometrical dimensions of the components of frames studied (in meters) ... 204
Table 6-21 – Cross-sectional dimensions of the components of frames studied (in meters) ... 204
Table 6-22 – Cross-sectional dimensions of the components of frames studied (in meters) (continued) 205 Table 6-23 – Total seismic masses of buildings and studied frames ... 205
Table 6-24 – Total seismic masses of buildings and studied frames (in ton) (continued) ... 206
Table 6-25 – Design parameters of the frames in EC8-groups ... 206
Table 6-26 – Partial factors of main combinations of loads according to EC8 and EN1990 at the ultimate limit state of seismic situations ... 207
Table 6-27 – Partial factors of main combinations of loads according to EC8 and EN1990 at the serviceability limit state of seismic situations ... 208
Table 6-28 – Partial factors of loads for calculating effective seismic mass participating into the vibration
modes of the frames according to EC8 ... 208
Table 6-29 – Global results of the EC8 group ... 208
Table 6-30 – The values of design base shear and local ductility required ... 209
Table 6-31 – Maximum design and resisting moments of beams and columns (kNm) ... 211
Table 6-32 – Maximum design and resisting moments of beams and columns (kNm) (continued) ... 212
Table 6-33 – Reinforcement in all studied frames ... 212
Table 6-34 – Reinforcement in all studied frames ... 213
Table 6-35 – Reinforcement in all studied frames (continued) ... 214
Table 6-36 – Reinforcement contents (ρ, %) in comparison with criteria from EC8 ... 214
Table 6-37 – Reinforcement contents (ρ, %) in comparison with criteria from EC8 ... 215
Table 6-38 – Reinforcement contents (ρ, %) in comparison with criteria from EC8 ... 216
Table 6-39 – Maximum design and resisting shears of beams and columns (kN) ... 216
Table 6-40 – Maximum design and resisting shears of beams and columns (kN) (continued) ... 217
Table 6-41 – Partial factors of some main combinations of loads according to EC2 and EN1990 at the ultimate limit state ... 218
Table 6-42 – Maximum design and resisting moments of beams and columns (unit: kNm) ... 219
Table 6-43 – Reinforcement Area from the analyses and chosen steel configurations of the frames in the EC2-group ... 220
Table 6-44 – Reinforcement Area from the analyses and chosen steel configurations of the frames in the EC2-group (continued) ... 221
Table 6-45 – Maximum shear forces generated during earthquake and shear resistance of beams and columns (kN) ... 222
Table 7-1 – Ductility parameters a, b, c for beams according to FEMA 356 ... 247
Table 7-2 – Ductility parameters a, b, c for columns according to FEMA 326 (2000) ... 247
Table 7-3 – Fundamental periods of the RC-MRFs studied from linear and nonlinear dynamic analyses 252 Table 7-4 – Response of the frames by pushover analysis ... 267
Table 8-1 – Typical available EMP profiles ... 269
Table 8-2 – Typical available EMP profiles (continued) ... 270
Table 8-3 – Calculation of design properties of 6-story frame based on DDBD (Config. 1/Case EC2-0.3g) ... 287
Table 8-4 – Distributing the total base shear to the RC frame and to the EMP system and calculation of the shear story on the RC frame and on the EMP (Config. 1/Case EC2-0.3g) ... 287
Table 8-5 – EMP design ductility demand calculation summary (Config. 1/Case EC2-0.3g)... 288
Table 8-6 – Overturning moment calculation from equivalent force profiles (Config. 1/Case EC2-0.3g) ... 288
Table 8-7 – Selection of EMP through out the frame (Config. 1/Case EC2-0.3g) ... 290
Table 8-8 – Stiffness of EMP through out the retrofitted frame (Config. 1/Case EC2-0.3g) ... 290
Table 8-9 – Profiles, shear resistance and secant stiffness of selected EMP through out the retrofitted frame (Config. 2/Case EC2-0.05g) ... 290
Table 8-11 – Distributing the total base shear to the RC frame and to the EMP system and calculation of
the shear story on the RC frame and on the EMP (Config. 2/Case EC2-0.05g) ... 292
Table 8-12 – EMP design ductility demand calculation summary (Config. 2/Case EC2-0.05g) ... 293
Table 8-13 – Overturning moment calculation from equivalent force profiles (Config. 2/Case EC2-0.05g) ... 293
Table 8-14 – Selection of EMP through out the frame (Config. 2/Case EC2-0.05g) ... 295
Table 8-15 – Stiffness of EMP through out the retrofitted frame (Config. 2/Case EC2-0.05g) ... 295
Table 8-16 – Profiles, shear resistance and secant stiffness of selected EMP through out the retrofitted frame (Config. 2/Case EC2-0.05g) ... 296
Table 8-17 – Check of the necessity of upgrading the existing frames in EC2-group ... 301
Table 8-18 – Properties of the “substitute SDOF” structures ... 301
Table 8-19 – Properties of the “substitute SDOF” structures (continued) ... 302
Table 8-20 – Properties of the “substitute SDOF” structures ... 302
Table 8-21 – Check of the necessity of upgrading the existing frames in EC8-group ... 303
Table 8-22 – Properties of the “substitute SDOF” structures ... 304
Table 8-23 – Properties of the “substitute SDOF” structures ... 304
Table 8-24 – Fundamental periods of the RC-MRFs retrofitted in by linear and nonlinear time history analyses ... 305
Table 8-25 – Response of the frames by pushover analysis at the ultimate limit state ... 308
LIST OF FIGURES
Figure 2-1 – Soft-story mechanism failure (Bendimerad, 2003) ...43
Figure 2-2 – Direct and indirect ground effects caused by earthquakes (EN1998-1 (2004)) ...46
Figure 2-3 – A typical capacity curve ...49
Figure 2-4 – Response Spectra in Traditional and ADRS Formats ...50
Figure 2-5 – Bilinear Representation of Capacity Spectrum for Capacity Spectrum Method ...50
Figure 2-6 – Definition of the performance point ...51
Figure 2-7 – Definitions in Capacity Curve ...52
Figure 2-8 – Determination of Performance Point ...52
Figure 2-9 – Effect of System Strengthening on Performance (ATC 40, 1997) ...53
Figure 2-10 – Effect of System stiffening on Performance (ATC 40, 1997) ...54
Figure 2-11 – Effect of Deformation Enhancement on Structural Performance (ATC 40, 1997) ...54
Figure 2-12 – CBF systems to retrofit or upgrade structures ...56
Figure 2-13 – Original brace models ...59
Figure 2-14 – Idealised hysteretic behaviour of intermediate braces (Nakashima and Wakabayashi, 1992) 59 Figure 2-15 - Typical types of BRB (Tsai et al., 2004) ...60
Figure 2-16 – Configuration of a BRB...61
Figure 2-17 – Buckling restrained braces sandwiched between precast concrete panels ...61
Figure 2-18 – Sub-assemblage test of buckling-restrained braces sandwiched between precast concrete panels (a) Test setup; (b) hysteresis behaviour (Wakabayashi et al., 1973) ...61
Figure 2-19 – Concept of sleeve column (Srihara, B.N., 1990) ...62
Figure 2-20 – A typical hysteretic behaviour of the BRB ...63
Figure 2-21 – Examples of frames with eccentric bracing (Plumier, 2008) ...64
Figure 2-22 – Hysteretic behaviour of the EBF ...65
Figure 2-23 – Design action in link for an inverted-Y-braced EBF configuration (Mazzolani et al., 2006) 65 Figure 2-24 – Plastic mechanisms of several EB configurations (Mazzolani et al. 2006) ...66
Figure 2-25 – Configuration of steel plate shear walls (Mazzolani, 2006) ...66
Figure 2-26 – Possibilities of the openings in SPSW and bracing systems (Astaneh-Asl, 2001) ...67
Figure 2-27 – Stress state on the web of a stiffened beam subjected to shear (a) and corresponding principal stresses (b)(c) (Mazzolani et al., 2006) ...67
Figure 2-28 – The development of the tensile stresses (Wagner theory) ...69
Figure 2-29 – Model of Basler (1960) ...69
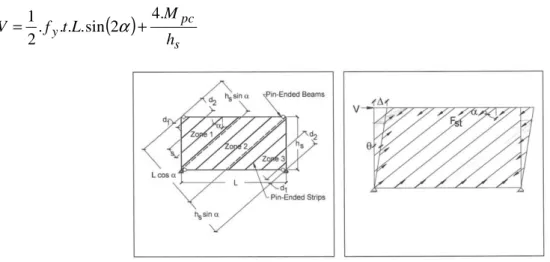
Figure 2-30 – Equivalent diagonal method ...70
Figure 2-31 – Strip model by Thorburn et al. (1983) ...70
Figure 2-32 – A typical test specimen and typical hysteresis loops for 1mm plate (Sugii and Yamada, 1996) ...72
Figure 2-33 – Specimens tested in UK and the effect of perforation on strength and stiffness of steel plate panels (Roberts, 1992)...72
Figure 2-35 – The models tested by Timber and Kulak (1983) and by Tromposch and Kulak (1987) ...74
Figure 2-36 – University of Alberta test setup and a sample of hysteresis behaviour ...75
Figure 2-37 – One of the two University of British Columbia specimens with its hysteresis loops ...75
Figure 2-38 – The specimen tested at the Uni. British Columbia and its response...76
Figure 2-39 – A typical test specimen and typical hysteresis loops for 1mm plate ...76
Figure 2-40 – Strip model of single story wall and single story collapse mechanism ...77
Figure 2-41 – Soft-story and uniform yielding mechanisms of multi-story SPSW ...77
Figure 2-42 – Hysteretic behaviour of a stiffened shear wall ...78
Figure 2-43 – Typically hysteretic behaviour of a slender shear wall ...78
Figure 2-44 – Pinching effect on hysteretic behaviour of SPSW ...79
Figure 2-45 – Hysteretic behaviour of the slender SPSWs (Tromposch and G. L. Kulak, 1987) ...79
Figure 2-46 – Three regions of behaviour of SPSW ...80
Figure 2-47 – Two possibilities to connect SPSW to the frame: bolted and welded ...81
Figure 2-48 – Details of welded connections ...82
Figure 2-49 – Details of bolted connections ...82
Figure 2-50 – Comparison of the buckling loads of the plates made of common steel or LYS ...83
Figure 2-51 – Comparison of stress – strain relationship between LYS and conventional steel ...84
Figure 2-52 – The hysteretic behaviour of LYS panels (left) with horizontal and vertical stiffeners and (right) with vertical horizontal only ...85
Figure 2-53 – Typical specimen dimensions (Vian and Bruneau, 2004) ...85
Figure 2-54 – Hysteresis behaviour of the test specimens (Vian and Bruneau, 2004) ...85
Figure 2-55 – Stress-strain relationships of different alloys ...86
Figure 2-56 – Results of numerical studies of De Matteis et al. (2005) on shear walls made of aluminium 87 Figure 2-57 - Curve load/displacement of aluminium panels (SW1: 300x300 mm; SW2: 300x450 mm) (Roberts et al., 1992) ...87
Figure 2-58 – The tested frame and aluminium panels (Mazzolani et al., 2006) ...88
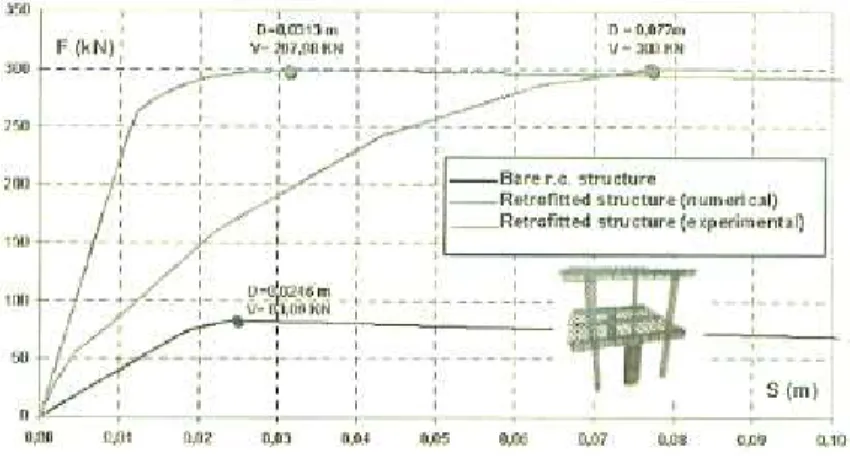
Figure 2-59 – Pushover curve of the studied frame with and without panels (Mazzolani et al., 2006) ...88
Figure 2-60 – Non perforated panel curve/ Perforated panel curve with a circular hole d = 60 mm/ Perforated panel curve with a circular hole d = 150 mm (Roberts and Sabour-Ghomi, 1995) ...89
Figure 2-61 – Experiments by Vian and Bruneau (2004) ...89
Figure 2-62 – Hysteretic behaviour of the panels by Vian and Bruneau (2004) ...90
Figure 2-63 – An example of configurations of RC wall systems ...91
Figure 2-64 - Load displacement diagram of the wall before attaining large plastic deformations ...93
Figure 2-65 - Load displacement diagram of the wall after attaining large plastic deformations ...93
Figure 2-66 – Main components of the typical CSWs (Astaneh, 2002) ...95
Figure 2-67 – View of traditional and “Innovative” CSWs (Astaneh, 2002) ...96
Figure 2-68 – Test specimens of Zhao and Astaneh (1998-2000) ...96
Figure 2-69 – Shear force drift behaviour of Specimens (Astaneh-Asl, 2002) ...97
Figure 3-1 – Producing process of EMP ... 101
Figure 3-2 –Geometry of a rhomb shaped stitch ... 101
Figure 3-3 – Normal type of EMP ... 102
Figure 3-4 – Flattened type of EMP ... 102
Figure 3-5 – EMP used as front protector ... 102
Figure 3-6 – EMP as a fence ... 102
Figure 3-7 – Bar studied in pure plane shear behaviour ... 103
Figure 3-8 – Three components contributed to the resistance of the beam web ... 105
Figure 4-1 – Overview of all components of tests in small scale ... 109
Figure 4-2 – Geometry of a rhomb shaped stitch ... 109
Figure 4-3 – Overview of all components of tests in large scale ... 110
Figure 4-4 - Specimen for tensile tests ... 111
Figure 4-5 – Notions of sheet directions ... 112
Figure 4-6 – Overview of specimen A86-46-43-30 dir 1 – welded connections before testing ... 112
Figure 4-7 – Small EMP specimens – with welded connections ... 114
Figure 4-8 – Small EMP specimens – with glued connections ... 114
Figure 4-9 – EMP specimen in large scale tests ... 115
Figure 4-10 - Global view of the test frame for shear tests ... 117
Figure 4-11 – Section of the test frame and joint between two sides of the frame ... 117
Figure 4-12 – Additional fork for applying force ... 118
Figure 4-13 – Notions of shear loads acting on the frame ... 118
Figure 4-14 – Displacements measurements on an expanded metal sheer test ... 118
Figure 4-15 – Global view of tests in large scale ... 119
Figure 4-16 – Detail of connection between test frame and test EMP ... 120
Figure 4-17 – Test frame in large scale tests ... 120
Figure 4-18 – Tensile tests and proposed stress-strain curves for EM products ... 122
Figure 4-19 – Two possibilities of placing the EMP into the test frame: Direction 1 – Left; Direction 2 – Right ... 123
Figure 4-20 – Buckling shapes after testing of specimens ... 124
Figure 4-21 – Force–drift curve in monotonic tests of flattened types and analytical model by Pecquet (2005) ... 124
Figure 4-22 – Force–drift curves in monotonic tests of normal types and analytical model ... 124
Figure 4-23 – Global view of the specimen A86-46-43-30 dir2 before testing ... 125
Figure 4-24 – Broken bars appeared in the monotonic test of specimen A51-27-35-30 – direction 2 ... 125
Figure 4-25 – Crack line and broken bars ... 128
Figure 4-26 – Hysteretic behaviour of flattened type specimens ... 129
Figure 4-27 – Hysteretic behaviour of normal type specimens – weld connection ... 130
Figure 4-28 – Hysteretic behaviour of flattened type specimens – glue connections ... 130
Figure 4-30 – Global buckling shapes of two sheets of the EMP panel ... 132 Figure 4-31 – Broken bars in monotonic large scale tests ... 132 Figure 4-32 – Broken bars of EMP at failures of the large scale tests ... 133 Figure 4-33 – Monotonic behaviour of specimen 1 – A51-27-35-30 ... 133 Figure 4-34 – Global instability of the specimen in large scale tests ... 134 Figure 4-35 – Monotonic behaviour in large scale tests ... 134 Figure 4-36 – Broken bars of the sheets in large scale EMP specimen ... 135 Figure 4-37 – Hysteretic behaviour of the specimen A51-27-35-30 ... 136 Figure 4-38 – Hysteretic behaviour of the specimen A86-46-43-30 ... 137 Figure 5-1 – Bars of normal types of EM bars ... 140 Figure 5-2 – Bars of flattened types of EM bars ... 140 Figure 5-3 – Model of tests in large scale used in FINELG ... 141 Figure 5-4 – Model of tests in small scale used in FINELG (left: in the test; right: numerical simulation) ... 141 Figure 5-5 – View on a line of bars after failure ... 142 Figure 5-6 – Iterative procedures available in FINELG ... 143 Figure 5-7 – Load vs. deflection curves of the monotonic tests and the numerical simulations of A51-27-35-30 dir1 and A51-27-A51-27-35-30 dir2- small scale tests ... 146 Figure 5-8 – Load vs. deflection curves of the tests and the models of A86-46-43-30 in large scale tests 146 Figure 5-9 – Out-of-plane deformations in the tests and in the numerical simulation during loading of A51-27-35-30 in large scale tests ... 146 Figure 5-10 – Deformations of the EMP at the test of A86-46-43-30 dir2 in small scale ... 147 Figure 5-11 – Fully yield bars (very large deformations – considered as failure) at the failure of the EMP A86-46-43-30 dir2 in small scale by the numerical simulation. ... 147 Figure 5-12 – Hysteretic curves of the cyclic tests and numerical simulations of the A51-27-35-30 dir1 - small scale tests ... 148 Figure 5-13 – Overview of typical finite element model for the parametric study ... 150 Figure 5-14 – Finite elements used in numerical simulations ... 150 Figure 5-15 – Material law for bars of EMP: (1) for determining the ultimate resistance; (2) for determining the ductility ... 151 Figure 5-16 – Plate model for a beam web ... 153 Figure 5-17 – Two directions of EMP loaded in shear [R3.3] ... 154 Figure 5-18 – Critical loads of different square EMP with different profiles subjected to shear. ... 155 Figure 5-19 – Critical loads of rectangular EMP with ratio 1x2 direction 1 subjected to shear ... 155 Figure 5-20 – Critical loads of rectangular EMP with ratio 1x2 direction 2 subjected to shear. ... 156 Figure 5-21 – Shear behaviour of square EMP B=500mm MD51-27-35-30 with different imperfections ... 156 Figure 5-22 – Shear behaviour of three square EMP: type of A51-27-35-30 ... 157 Figure 5-23 – Behaviour of rectangular EMP with ratio 1:2 and direction 1 subjected to shear ... 158 Figure 5-24 – Plastic resistance in function of the dimensions of square EMP subjected to shear ... 158
Figure 5-25 – Plastic resistance in function of the dimensions of rectangular EMP ratio 1:2 and direction 1 subjected to shear ... 159 Figure 5-26 – Plastic resistance in function of the dimensions of rectangular EMP ratio 1:2 and direction 2 subjected to shear ... 159 Figure 5-27 – Plastic resistance characterised by a single linear relation for all the commercial profiles .. 160 Figure 5-28 – Relationship between dimensions of ratio of square EMP and their plastic resistance divided by the product of diagonal length (ldia), thickness (B), ultimate stress (fu)and ratio of width to
length of bars (A/lbar) ... 160
Figure 5-29 – Relationship between dimensions of ratio of rectangular EMP ratio 2:1 direction 1 and their ultimate resistance divided by the product of diagonal length (ldia), thickness (B), ultimate stress
(fu) and ratio of width to length of bars (A/lbar) ... 161
Figure 5-30 – The equivalent band of the EMP ... 162 Figure 5-31 – Combination of two EMP A51-27-35-30 ... 162 Figure 5-32 – The simplified model of a combined EMP with stiff intermediate gusset ... 163 Figure 5-33 – Influence of gusset plate on the shear behaviour of a combined EMP ... 163 Figure 5-34 – The simplified model of a combined EMP with non-stiff intermediate gusset ... 163 Figure 5-35 – Monotonic behaviour and displacement ductility of square EMP of A86-46-43-30 ... 165 Figure 5-36 – Hysteresis behaviour of a Moment Resisting Frame (Popov E.P, 1980) ... 165 Figure 5-37 – Hysteresis behaviour of a Diagonally Braced Frame (Popov E.P, 1980) ... 165 Figure 5-38 – Hysteresis behaviour of a Reinforced Concrete Shear Wall (Oesterle, R.G, 1978) ... 166 Figure 5-39 – Hysteresis behaviour of an un-stiffened steel plate shear wall (Takahashi Y., Takeda, 1973)
... 166 Figure 5-40 – Hysteresis behaviour of a heavily stiffened steel plate shear wall panel (Takahashi Y., Takeda, 1973) ... 166 Figure 5-41 – Cyclic loading on EMP in numerical simulations ... 168 Figure 5-42 – First four cycle behaviour of 750mm square EMP with the profile of A51-27-35-30 direction 1 under shear loading ... 169 Figure 5-43 – First four cycle behaviour of 1000mm square EMP with the profile of A51-27-35-30 under shear loading ... 170 Figure 5-44 – Elastic buckling of the EMP ... 170 Figure 5-45 – Hysteretic behaviour of 500mm square EMP with the profile of A51-27-35-30 subjected to shear loading ... 170 Figure 5-46 – Hysteretic behaviour of 750mm square EMP with the profile of A51-27-35-30 subjected to shear loading ... 171 Figure 5-47 – The simplified hysteretic behaviour of EMP ... 172 Figure 5-48 – Comparison of hysteretic behaviour of analytical model and numerical model for a square EMP A51-27-35-30 with the dimension of 500mm ... 172 Figure 6-1 – Bilinear stress-strain relation of concrete for the design of cross-sections – EC2 ... 177 Figure 6-2 – Idealised and design stress-strain diagrams for reinforcing steel (for tension and compression) ... 177 Figure 6-3 – Beam section with the strain diagram and the stress block ... 182 Figure 6-4 – Bending plus axial load with varying position of neutral axis in a column ... 182
Figure 6-5 – Recommended elastic response spectra for type 1 (left) and type 2 (right) ... 188 Figure 6-6 – Capacity design for the shear force in primary beams ... 194 Figure 6-7 – Case study structures: Configurations 1, 2, 3, 4 (dimensions in meters) ... 200 Figure 6-8 – Reinforcement configurations of the slab ... 202 Figure 6-9 – Cases of gravity loads and seismic forces on the studied frames for all limit states ... 207 Figure 6-10 – Design base shear coefficient (Vb/W) ... 209
Figure 6-11 – Maximum sensitivity coefficient in all stories (Max θ = N.δ/V.h) ... 209 Figure 6-12 – Top and maximum inter-story drift ratio (δ/h) for the four studied configurations ... 210 Figure 6-13 – Ratio of maximum inter-story drift to top drift for the studied frames ... 211 Figure 6-14 – Gravity, wind and snow load cases on the studied frames for all limit states ... 218 Figure 7-1 – Steps for seismic evaluation of the existing RC-MRFs ... 225 Figure 7-2 – Possibilities of decomposition of the beam to sub-elements ... 227 Figure 7-3 – Concentrated plasticity beam sub-elements ... 228 Figure 7-4 – Bilinear hysteresis model ... 229 Figure 7-5 – Clough’s degrading stiffness model ... 229 Figure 7-6 – Takeda’s degrading stiffness models ... 230 Figure 7-7 – Takeda-Takayanagi models (Takayanagi and Schnobrich, 1976): ... 230 Figure 7-8 – Degrading tri-linear model ... 231 Figure 7-9 – Pivot hysteresis loops (Dowell et al, 1998) ... 232 Figure 7-10 – Distributed inelasticity ... 233 Figure 7-11 – Section Modelling with Fibres ... 233 Figure 7-12 – Accelerograms for Nonlinear Dynamic Analyses ... 235 Figure 7-13 – Comparison of elastic response spectra from three accelerograms and EC8 of PGA of 0.15g soil C type 1 Earthquake ... 236 Figure 7-14 – Definition of factor αu and α1 on the basis of base shear versus top displacement diagram
from pushover analysis ... 236 Figure 7-15 – Elastic and inelastic demand spectra versus capacity diagram (Faijar, 2000) ... 240 Figure 7-16 – Calculation of resistance of a beam in studied frames ... 243 Figure 7-17 – Calculation of resistance of a beam in studied frames ... 244 Figure 7-18 – Pivot hysteresis model for RC elements (Dowell et al., 1998) ... 245 Figure 7-19 – Generalized load deformation behaviour in a plastic hinge according to FEMA 356 ... 246 Figure 7-20 – Rigid-plastic beam-column element in SAP 2000 in relevance with FEMA 356 ... 246 Figure 7-21 – Determination of the resistance of compression strut at joint ... 249 Figure 7-22 – Definition of ductility capacity and ultimate response of the RC-MRFs ... 250 Figure 7-23 – Pushover curves and target drifts at design PGA established by Pushover analysis of
RC-MRFs of Configuration 1 ... 257 Figure 7-24 – Pushover curves and target drifts at design PGA established by Pushover analysis of
Figure 7-25 – Pushover curves and target drifts at design PGA established by Pushover analysis of RC-MRFs of Configuration 3 ... 259 Figure 7-26 – Pushover curves and target drifts at design PGA established by Pushover analysis of
RC-MRFs of Configuration 4 ... 260 Figure 7-27 – Typical failure mechanisms of the studied frames in EC2 group (if node retrofitted) ... 261 Figure 7-28 – Typical failure mechanisms of the EC8-DCM frames and EC8-DCL if node retrofitted .. 261 Figure 7-29 – Top target displacements established by Pushover and maximum top displacements established by NLTH of studied RC-MRFs under design PGA (* - frames with node retrofitted) ... 262 Figure 7-30 – Design base shears, base shears corresponding to target displacements established by Pushover and maximum base shears established by NLTH of studied RC-MRF under design PGA (* - frames with node retrofitted) ... 263 Figure 7-31 – Maximum inter-story drifts at target displacements established by Pushover and maximum inter-story drifts established by NLTH of studied RC-MRFs under design (* - frames with node retrofitted) ... 264 Figure 7-32 – Ratios between maximum inter-story drifts and top drifts at target displacements of studied RC-MRFs under design PGA established by Pushover and NLTH analyses (* - frames with node retrofitted) ... 265 Figure 7-33 – Design and maximum resistible PGA of studied RC-MRFs established by Pushover analysis (* - the frames need node retrofitted) ... 266 Figure 8-1 – The equivalent band of the EMP ... 270 Figure 8-2 – The simplified hysteretic behaviour of EMP ... 271 Figure 8-3 – Key steps of DDBD for MDOF system (Maley, 2010) ... 273 Figure 8-4 – Simplified model of a multi-storey building ... 274 Figure 8-5 – Design displacement spectra ... 276 Figure 8-6 – Description of the selected displacement of the existing frames... 277 Figure 8-7 – Definition of ductility capacity and ultimate response of the RC-MRFs ... 279 Figure 8-8 – A typical hysteretic behaviour of a square EMP A51-27-35-30 with the dimension of 500mm
... 280 Figure 8-9 – Takeda Thin hysteresis rule (Priestley, 2007) ... 280 Figure 8-10 – Strength assignment to determine the shear story and ductility of the EMP system ... 281 Figure 8-11 – Principle of designing EMP ... 283 Figure 8-12 – Design procedures of EMP ... 285 Figure 8-13 – Pushover curve of the existing frame and selected target drift (Case study EC2-0.05g) ... 286 Figure 8-14 – Obtaining effective period, Teff, from design displacement, ∆d, and reduced displacement
design spectrum ... 289 Figure 8-15 – Obtaining effective period, Teff, from design displacement, ∆d, and reduced displacement
design spectrum ... 289 Figure 8-16 – Pushover curve of the existing frame and selected target drift (Case study EC2-0.05g) ... 291 Figure 8-17 – Obtaining effective period, Teff, from design displacement, ∆d, and reduced displacement
design spectrum ... 294 Figure 8-18 – Obtaining effective period, Teff, from design displacement, ∆d, and reduced displacement
Figure 8-19 – Pivot hysteresis model in SAP 2000 for EMP (Dowell et al., 1998) ... 297 Figure 8-20 – Interstory drift and shear forces in retrofitted frame of the example Case 1/EC2-0.3g under earthquake at design PGA=agR=0.3g established by Pushover and NLTH analyses (left: the
interstory drifts; right: displacement profiles) ... 298 Figure 8-21 – Interstory drift and shear forces in retrofitted frame of the example Case 2/EC2-0.05g under earthquake at design PGA=agR=0.15g established by Pushover and NLTH analyses (left:
the interstory drifts; right: displacement profiles) ... 299 Figure 8-22 – Story shears of the examples under design PGA established by Pushover analysis (left: Case 1/EC2-0.3g; right: Case 2/EC2-0.05g) ... 299 Figure 8-23 – Seismic performance of the frame Case 1/EC2-0.3g before and after being retrofitted by Pushover analysis ... 300 Figure 8-24 – Seismic performance of the frame Case 2/EC2-0.05g before and after being retrofitted by Pushover analysis ... 300 Figure 8-25 – Pushover curves and target drifts by Pushover analysis of RC-MRFs of Configuration 1 . 309 Figure 8-26 – Pushover curves and target drifts by Pushover analysis of RC-MRFs of Configuration 1 (continued) ... 310 Figure 8-27 – Pushover curves and target drifts by Pushover analysis of RC-MRFs of Configuration 2 . 311 Figure 8-28 – Pushover curves and target drifts by Pushover analysis of RC-MRFs of Configuration 2 (continued) ... 312 Figure 8-29 – Pushover curves and target drifts by Pushover analysis of RC-MRFs of Configuration 3 . 313 Figure 8-30 – Pushover curves and target drifts by Pushover analysis of RC-MRFs of Configuration 3 (continued) ... 314 Figure 8-31 – Pushover curves and target drifts by Pushover analysis of RC-MRFs of Configuration 4 . 314 Figure 8-32 – Pushover curves and target drifts by Pushover analysis of RC-MRFs of Configuration 4 (continued) ... 315 Figure 8-33 – Typical failure mechanisms if all beam-column joints are well retrofitted ... 316 Figure 8-34 – Maximum values of top displacements of all RC-MRF studied under designed PGA by Pushover and NLTH analyses – Configurations 1 ... 316 Figure 8-35 – Maximum values of top displacements of all RC-MRF studied under designed PGA by Pushover and NLTH analyses – Configuration 2 ... 317 Figure 8-36 – Maximum values of top displacements of all RC-MRF studied under designed PGA by Pushover and NLTH analyses – Configurations 3 ... 317 Figure 8-37 – Maximum values of top displacements of all RC-MRF studied under designed PGA by Pushover and NLTH analyses – Configurations 3 (continued) ... 318 Figure 8-38 – Maximum values of top displacements of all RC-MRF studied under designed PGA by Pushover and NLTH analyses – Configurations 4 ... 318 Figure 8-39 – Design base shears and base shears generated in studied RC-MRFs at target displacements under design earthquakes established by Pushover, NLTH analyses – Configurations 1 ... 319 Figure 8-40 – Design base shears and base shears generated in studied RC-MRFs at target displacements under design earthquakes established by Pushover, NLTH analyses – Configurations 2 ... 319 Figure 8-41 – Design base shears and base shears generated in studied RC-MRFs at target displacements under design earthquakes established by Pushover, NLTH analyses – Configurations 2 (continued) ... 320 Figure 8-42 – Design base shears and base shears generated in studied RC-MRFs at target displacements under design earthquakes established by Pushover, NLTH analyses – Configurations 3 ... 320
Figure 8-43 – Design base shears and base shears generated in studied RC-MRFs at target displacements under design earthquakes established by Pushover, NLTH analyses – Configurations 4 ... 321 Figure 8-44 – Maximum interstory drift ratios at target displacements of studied RC-MRFs under design PGA established by Pushover and NLTH analyses – Configurations 1 ... 321 Figure 8-45 – Maximum interstory drift ratios at target displacements of studied RC-MRFs under design PGA established by Pushover and NLTH analyses – Configurations 1 (continued) ... 322 Figure 8-46 – Maximum interstory drift ratios at target displacements of studied RC-MRFs under design PGA established by Pushover and NLTH analyses – Configurations 2 ... 322 Figure 8-47 – Maximum interstory drift ratios at target displacements of studied RC-MRFs under design PGA established by Pushover and NLTH analyses – Configurations 3 ... 323 Figure 8-48 – Maximum interstory drift ratios at target displacements of studied RC-MRFs under design PGA established by Pushover and NLTH analyses – Configurations 4 ... 323 Figure 8-49 – Maximum interstory drift ratios at target displacements of studied RC-MRFs under design PGA established by Pushover and NLTH analyses – Configurations 4 (continued) ... 324 Figure 8-50 – Ratios between maximum interstory drifts and top drifts at target displacements of studied RC-MRFs under design PGA established by Pushover and NLTH analyses – Configurations 1 ... 324 Figure 8-51 – Ratios between maximum interstory drifts and top drifts at target displacements of studied RC-MRFs under design PGA established by Pushover and NLTH analyses – Configurations 2 ... 325 Figure 8-52 – Ratios between maximum interstory drifts and top drifts at target displacements of studied RC-MRFs under design PGA established by Pushover and NLTH analyses – Configurations 3 ... 325 Figure 8-53 – Ratios between maximum interstory drifts and top drifts at target displacements of studied RC-MRFs under design PGA established by Pushover and NLTH analyses – Configurations 3 (continued) ... 326 Figure 8-54 – Ratios between maximum interstory drifts and top drifts at target displacements of studied RC-MRFs under design PGA established by Pushover and NLTH analyses – Configurations 4 ... 326 Figure 8-55 – Design and maximum resistible PGA of retrofitted RC-MRFs by Pushover analysis – Configurations 1 ... 327 Figure 8-56 – Design and maximum resistible PGA of retrofitted RC-MRFs by Pushover analysis – Configurations 2 ... 327 Figure 8-57 – Design and maximum resistible PGA of retrofitted RC-MRFs by Pushover analysis – Configurations 2 (continued) ... 328 Figure 8-58 – Design and maximum resistible PGA of retrofitted RC-MRFs by Pushover analysis – Configurations 3 ... 328 Figure 8-59 – Design and maximum resistible PGA of retrofitted RC-MRFs by Pushover analysis – Configurations 4 ... 329 Figure 8-60 – Ratios of maximum resistible PGAs of RC-MRFs retrofitted using only EMP by Pushover analysis ... 329 Figure 8-61 – Ratios of maximum resistible PGAs of RC-MRFs retrofitted by EMP and node retrofitted established by Pushover analysis ... 330 Figure 8-62 – Retrofit of beam-column joints by using external prestressed bars with Dywidag type ... 331 Figure 8-63 – Retrofit of beams at critical regions with brittle failure due to shears by using external bolts or bar with epoxy injection to the cracks of concrete ... 331
Figure 8-64 – Description of the connection between EMP and the frame’s elements... 336 Figure 8-65 – Description of the connection between EMP and the frame’s elements... 337 Figure 8-66 – Steps to design connection between EM sheets ... 337 Figure 8-67 – Steps to design connection between EMP and the frame’s elements... 338 Figure 8-68 – Steps to design connection between EMP and the frame’s elements... 338 Figure 8-69 – Determination of bearing resistance per bolt ... 338
LIST OF SYMBOLS AND ABBREVIATIONS
A = Width of the bars of the rhomb-shape stitch of EMP
A = Accidental action
A = Cross sectional area
Ac = Cross sectional area of concrete
AEd = Design value of seismic action (γI.AEk)
AEk = Characteristic value of the seismic action for the reference return period
As = Cross sectional area of reinforcement
Ash = Total area of horizontal hoops in a beam-column joint
Ast = Area of one leg of transverse reinforcement
Asv = Total area of vertical reinforcement in the web of the wall
As,min = Minimum cross sectional area of reinforcement
Asw = Cross sectional area of shear reinforcement
ASW = Aluminium Shear Wall
B = Thickness of the bars of the rhomb-shape stitch of EMP
BRB = Buckling Restrained Brace
C = Damping Matrix of MDOF structure
CSW = Composite Shear Wall
CBF = Concentric Braced Frame
CD = Width of the rhomb-shaped stitch of EMP
DOF = Degree Of Freedom
Dpl = Flexural stiffness of a solid plate (under shear loading)
E = Young’s Modulus of the material
E = Effect of action
Ec = Tangent modulus of elasticity of normal weight concrete at a stress of σc = 0 and at 28 days
Ecd = Design value of modulus of elasticity of concrete
Es = Design value of modulus of elasticity of steel
EEM = Elastic modulus of an Expanded Metal bar
Estr-EM = Strain-hardening modulus of an Expanded Metal bar
EI = Bending Stiffness
EBF = Eccentric Braced Frame
EVD = Equivalent Viscous Damping
EMP = Expanded Metal Panel
F = Action
Fd = Design value of an action
Fk = Characteristic value of an action
Gk = Characteristic permanent action
He = Effective height of an equivalent SDOF system
Hi = Height of story i from the ground
Hn = Height of roof story from the ground
I = Second moment of area of concrete section
K = Stiffness
K = Stiffness matrix of a MDOF system
L = Length, Span
LD = Length of the rhomb-shaped stitch of EMP
LYSW = Low Yield Steel Shear Wall
M = Bending moment
M = Mass matrix of a MDOF system
MEd = Design value of the applied internal bending moment
Mi,d = End moment of a beam or column for the calculation of its capacity design shear
MRc,i = Design value of column moment of resistance of end i
MOTM,MRF = Overturning moment of the RC-MRF under lateral seismic forces
MOTM,EMP = Overturning moment of the EMP system in the retrofitted frames under lateral seismic forces
MDOF = Multiple Degree Of Freedom
MRF = Moment Resisting Frame
MRFs = Moment Resisting Frames
N = Axial force
NEd = Design value of the applied internal axial force
R = Response Modification Factor
R = Resistance
RCSW = Reinforce Concrete Shear Wall
PGA = Peak Ground Acceleration
PNCR = Reference probability of exceedance in 50 years of the reference seismic action for the no-collapse requirement
Ptot = Total gravity load at and above the story considered in the seismic design situation
Q = Variable action
S = First moment of area
S = Soil Factor
Se(T)
= Elastic horizontal ground acceleration response spectrum also called “elastic response spectrum”. At T=0, the spectral acceleration given by this spectrum equals the design ground acceleration on type A ground multiplied by the soil factor S
Sde(T) = Elastic displacement response spectrum
Sd(T)
= Design spectrum (for elastic analysis). At T=0, the spectral acceleration given by this spectrum equals the design ground acceleration on type A ground multiplied by the soil factor S
SDOF = Single Degree Of Freedom
SPSW = Steel Plate Shear Wall
SRSS = Square Root of the Sum of the Squares
ULS = Ultimate limit state
Τ = Period of vibration of a linear single degree of freedom system
Τe; Τeff = Effective period of the SDOF system
Τ1 = Fundamental period of the building in the horizontal direction of interest
ΤC = Corner period of at the upper limit of the constant acceleration region of the elastic spectrum
Τs = Duration of the stationary part of the seismic action
ΤNCR = Reference return period of the reference seismic action for the no-collapse requirement
V = Shear force
Vbase = Base shear of an equivalent SDOF system
Vbase = Total base shear of a MDOF system
VRd = Design value of shear resistance
VRd,c = Design value of shear resistance for members without shear reinforcement in accordance with EC2
VEd = Design value of the applied shear force
Vtotal = Total seismic shear at the considered level
V1y; V1,y = Base shear corresponding to the first yield displacement
Vu = Base shear corresponding to the ultimate displacement
VEMP,i = Shear at story i
Vb,EMP = Shear strength of EMP system in DDBD
Vb,1Y,MRF = Shear strength of MRF system in DDBD corresponding to first yield in MRF
Vb,Rd,MRF = Shear Resistance of MRF system in DDBD
Vb,Rdmax,MRF = Maximum shear Resistance of MRF system in DDBD
Vb,1Y,MRF+EMP = Shear strength of MRF+EMP system in DDBD corresponding to first yield in MRF+EMP
Vb,Rdmax,MRF+EMP = Maximum shear Resistance of MRF+EMP system in DDBD
W = Effective width of EMP under shear
Ws = Wall system
a = Distance
agR = Reference peak ground acceleration on type A ground
ag = Design ground acceleration on type A ground
b = Overall width of a cross-section, or actual flange width in a T or L beam
bc = Cross-sectional dimension of column
beff = Effective length width of beam in tension at the face of a supporting column
bw = Width of the web on T or I or L beams
b0 = Width of the confined core of a column
d = Diameter; Depth
d = Effective depth of a cross section
de = Displacement induced by the design seismic action (EC8)
dg = Design ground displacement
dd = Displacement induced by a linear analysis based on the design response spectrum
(EC8)
dbL = Longitudinal bar diameter
dbW = Diameter of hoop
dr = Design story drift
dsi = Design lateral displacement at story i due to seismic action
dyEMP = Yield lateral displacement of the EMP
duEMP = Ultimate lateral displacement of the EMP
e = Eccentricity
f = stress generated in equivalent band of EMP
fc = Compressive strength of concrete
fck = Characteristic compressive cylinder strength of concrete at 28 days
fcm = Mean value of concrete cylinder compressive strength
fctk = Characteristic axial tensile strength of concrete
fctm = Mean value of axial tensile strength of concrete
ft = Tensile strength of reinforcement
ftk = Characteristic tensile strength of reinforcement
fy = Yield strength of reinforcement
fyd = Design yield strength of reinforcement
fyd,h = Design value of yield strength of the horizontal web reinforcement
fyd,v = Design value of yield strength of the vertical web reinforcement
fyld = Design value of yield strength of the longitudinal reinforcement
fywd = Design value of yield strength of the transverse reinforcement
fyk = Characteristic yield strength of reinforcement
fywd = Design yield of shear reinforcement
fyEM = Yield stress of the Expanded Metal material bar
fuEM = Ultimate stress of the Expanded Metal material bar
frEM = Assumed remaining stress of the Expanded Metal material bar
g = Acceleration due to gravity
h = Height
h = Overall depth of a cross-section
hc = Cross-sectional depth of column in the direction of interest
hf = Flange depth
hjc = Distance between extreme layers of column reinforcement in a beam-column joint
hjw = Distance between beam top and bottom reinforcement
h0 = Depth of confined core in a column (to centre line of hoops)