Computer Science and Artificial Intelligence Laboratory
Technical Report
MIT-CSAIL-TR-2011-028
May 3, 2011
Comparison of User Traffic
Characteristics on Mobile-Access versus
Fixed-Access Networks
Comparison of User Traffic Characteristics on
Mobile-Access versus Fixed-Access Networks
Mikko V. J. Heikkinen
Aalto University School of Electrical Engineering
Helsinki Institute for Information Technology HIIT
Massachusetts Institute of Technology
Arthur W. Berger
Massachusetts Institute of Technology
Akamai Technologies
Abstract
We compare Web traffic characteristics of mobile- ver-sus fixed-access end-hosts, where herein the term “mo-bile” refers to access via cell towers, using for example the 3G/UMTS standard, and the term “fixed” includes Wi-Fi access.
It is well-known that connection speeds are in general slower over mobile-access networks, and also that often there is higher packet loss. We were curious whether this leads mobile-access users to have smaller connec-tions.
We examined the distribution of the number of bytes-per-connection, and packet loss from a sampling of logs from servers of Akamai Technologies. We obtained 149 million connections, across 57 countries. The mean bytes-per-connection was typically larger for fixed-ac-cess: for two-thirds of the countries, it was at least one-third larger. Regarding distributions, we found that the difference between the bytes-per-connection for mobile-versus fixed-access, as well as the packet loss, was sta-tistically significant for each of the countries; however the visual difference in plots is typically small. For some countries, mobile-access had the larger connec-tions. As expected, mobile-access often had higher loss than fixed-access, but the reverse pertained for some countries. Typically packet loss increased during the busy period of the day, when mobile-access had a larger increase. Comparing our results from 2010 to those from 2009 of the same time period, we found that con-nections have become a bit smaller.
1. INTRODUCTION
We are interested in comparing Web traffic charac-teristics of mobile- versus fixed-access end-hosts, where herein the term “mobile” refers to access via cell tow-ers, using for example the 3G/UMTS standard, and the term “fixed” includes Wi-Fi access. Whereas prior work has compared the applications used by mobile-and fixed-access devices [1], here we are interested in the network level, and comparing the size of connec-tions (i.e., number of bytes per connection) for mobile
versus fixed devices that are accessing the Web. It is well-known that connection speeds are in gen-eral slower over mobile-access networks [2]. Also, as re-ported herein, often, though not always, there is higher packet loss on mobile-access networks, see Sec. 4.2. We are curious whether this leads users to have smaller con-nections, or would they persevere, so to speak, through the more adverse network conditions.
From a sampling of logs from July 2010 from servers of Akamai Technologies, we examine the distribution of the number of bytes-per-connection, and packet loss. We found that the difference in the distributions for mobile- versus for fixed-access for both the bytes-per-connection and for packet loss was statistically signifi-cant (based on the Kolmogorov-Smirnov test) for each of the countries. However, the difference is typically (but not always) small, when one views plots of the dis-tributions. For some countries, the mobile-access has the larger connections, and in some countries mobile-access has lower packet loss.
In a scatter plot of per-country mean connection size versus mean packet loss, there is a statistically signifi-cant trend of smaller connection size with higher packet loss for both fixed- and-mobile access, though there is great variability. China and Russia stand out as hav-ing relatively high fixed-access packet loss but also rel-atively large connections.
We also found per-connection packet loss being of-ten greater than the overall access-network packet loss, indicating smaller connections having higher loss. Of-ten, but not always, mobile-access had higher loss than fixed-access. Typically, but again not in all cases, packet loss increased during the busy period of the day.
Comparing our results from 2010 to those from 2009 of the same time period, we found that connections have become a bit smaller.
The data for this study was collected prior to the deployment of 4G/LTE, and thus forms a baseline for comparison for when 4G/LTE is broadly in use.
The contributions of this study are:
fixed-access connection-size and packet-loss 2. The comparison of the daily demand distribution
for bytes and packet loss, for mobile- and fixed-access
3. Results spanning 57 countries
This paper is structured as follows: Sec. 2 reviews background and related work. Sec. 3 describes our data set. Sec. 4 contains our results. Sec. 5 summarizes and discusses our results.
2. BACKGROUND AND RELATED WORK
Mobile broadband has become a significant factor in the Internet communications market: Cisco [3] forecast that global mobile IP data traffic will double every year through 2014. Comscore [4] estimated that the num-ber of US mobile phone subscrinum-bers with unlimited data plans increased 31% over a one-year period. Informa [5] estimated that there would be globally 450 million mo-bile broadband subscribers in 2010 and 670 million in 2011. Nielsen [6] estimated that “smartphones” have penetrated one quarter of the US population, and ex-pected smartphones to overtake feature phones in the US market by the end of 2011. Pew Research Center [7] surveyed a 25% increase in the number of adult Amer-icans using Internet with their mobile phones; in its other report [8] it noted saturation in home broadband adoption. Validas [9] found the number of its US pan-elists adopting mobile broadband increased 26%, and the average number of bytes transferred per panelist increased 51% over a period of a year.
As another illustrative example of the popularity of mobile broadband, when the Apple iPhone was intro-duced in South Korea, the sudden increase in the num-ber of mobile-access connections markedly decreased the overall (mobile- plus fixed-access) average connec-tion speed in the country, as a typical mobile-access data connection is slower than a fixed-access one [10].
Several analysts have claimed that mobile broadband is unprofitable and flat rate pricing is unsustainable in the long run, because traffic grows faster than rev-enue. Blennerud [11] argued that profitability of mobile broadband can be maintained, i.e. revenue and traf-fic remain coupled, by attracting “normal” subscribers who do not generate excessive amount of traffic, and by applying traffic management methods.
Collecting data directly from end-users, employing usage monitoring systems, measuring at network nodes, and measuring at network servers are the main methods for analyzing the usage of mobile services [12]. Each of the methods results in different coverage and granular-ity in data one is able to collect.
Akamai [2] quarterly reports connection speeds for both fixed- and mobile-access. Sandvine [1] reported
traffic profiles for both fixed- and mobile-access. Com-plementing these two studies we are aware of that have done a side-by-side comparison of mobile- and fixed-access traffic, the present work also makes such a com-parison, though in contrast to the prior work, we exam-ine different attributes: the number of bytes per connec-tion and packet loss. Using a dataset from the Akamai content distribution servers, our study is global in scope and presents results for over 50 different countries.
In addition to the two previous side-by-side fixed-and mobile-access traffic comparisons at the network level, at least two studies have compared fixed- and mobile-access traffic at the application level: Hossfeld et al. [13] compared the performance of a peer-to-peer file sharing application in both fixed- and mobile-access networks, whereas Svoboda [14] compared the session lengths of online gamers in fixed- and mobile-access net-works. Furthermore, Kalden & Ekstr¨om [15] compared (non-side-by-side) the results of their analysis of GPRS mobile-access traffic to studies of fixed-access traffic by other researchers.
Several efforts have been made to gather and assess traffic datasets from fixed- and mobile-access networks for consumers. We introduce some: Benko et al. [16] and Ivanovich et al. [17] did extensive measurements in GPRS mobile-access networks. Plissonneau et al. [18] detected peer-to-peer traffic in the access network of a French DSL operator. Cho et al. [19, 20] analyzed the traffic generated by Japanese residential DSL and fiber users. Dischinger et al. [21] analyzed the traffic data they collected from major cable and DSL providers in Europe and North America. Siekkinen et al. [22] in-vestigated the performance limitations of ADSL users. Afanasyev et al. [23] compared traffic from static, lap-top, and handset users of a large urban Wi-Fi network. Heikkinen et al. [24] and Riikonen & Kivi [25] ana-lyzed the majority of traffic in Finnish mobile-access networks. Bauer et al. [26] are collecting data from US broadband access networks. Maier et al. [27] an-alyzed traffic data from the access network of a large European DSL operator, in [28] they analyzed traffic generated by mobile devices connecting to the access network via Wi-Fi. Pietrzyk et al. [29] compared sta-tistical classification of ADSL traffic to deep packet in-spection. Romirer-Maierhofer et al. [30] studied round trip times in a 3G network. Ofcom [31] compared UK fixed-access providers by distributing to their customers routers modified to measure traffic.
The issue of fixed-mobile substitution is relevant to our study, albeit we cannot make any definitive claims on the topic based on our data. We would need to be able to identify individual users and the services they use to make such claims. What we can do is to use our measures as a pointer towards preliminary observations on the topic.
Multiple definitions for substitution and complemen-tariness of commodities exist in the literature. We omit the formal algebraic definition. Most informal defini-tions are similar to Wetzstein’s [32]:
“Two commodities are substitutes if one com-modity may, as a result of a price change, re-place the other. Examples are two brands of cola or gasoline. Two commodities are com-plements if one commodity is consumed with another good. Examples of complements are pancakes and syrup, gasoline and automo-biles, and a baseball bat and ball.”
The question whether mobile handsets have substi-tuted fixed telephones has been studied extensively. Vo-gelsang [33] surveyed fixed-mobile substitution studies. He noticed three main methods used to conduct the studies: 1) diffusion models, 2) subscription cross-elas-ticities in a single country or multiple countries, and 3) cross-elasticities for fixed-line call demand. He found that “the price data in cross-country studies are often not meaningful or are insufficient in that they only pro-vide single prices out of a non-linear or bundled tar-iff schedule.” He concluded that the relative price de-cline of mobile services compared to fixed services, to-gether with network effects, explain substitution of fixed phones with mobile phones in wealthy countries.
Ward and Woroch [34] used a US household panel containing demographic and billing information to es-timate cross-elasticities of demand for fixed and mobile services, and found moderate substitution between the two.
Bohlin et al. [35] investigated the inter-generation ef-fects in the diffusion process of mobile technology gen-erations. They found evidence that increases in urban-ization, GDP per capita, and penetration of the Inter-net positively influenced the adoption process of new technology generations. They hypothesized that “third-generation mobile will substitute for fixed broadband at a later time, if it crosses a certain performance/price level threshold.” They observed that behavior in Fin-land, where the number of fixed broadband connections is declining and the number of mobile broadband con-nections is increasing [36].
The substitutability of fixed broadband with mobile broadband has been studied qualitatively. Lehr and Chapin [37] noted persistent differences between wired and wireless networks in terms of capacity, topology, reliability, and mobility. They foresaw no convergence to a common architecture within the wireless network domain.
Lehr [38] expected both fixed and mobile broadband to expand the range of services they offer, but the peak and sustainable average data rate of mobile broadband services to continue to lag behind those of fixed broad-band services. He noted the growth of
Machine-to-Machine (M2M) communications using mobile broad-band connections to the Internet, such as credit card payments with mobile terminals, and remote controlling of facilities. Power and form factor constraints limit the usability of mobile devices using mobile broadband, but increasing value of mobility contributes to the growth of them. He concluded that mobile broadband comple-ments fixed broadband access, but mobile broadband facilitates the creation of new Internet services and en-hances the scale and scope economies in provisioning of Internet services.
We are not aware of any quantitative studies on fixed-mobile broadband substitution.
3. DATA SET
We used data from log files of Akamai Technologies. Although the data had been logged for other purposes, it contained information that enabled a comparison of mobile- and fixed-access on a per country basis. Data consisted of a global sub-sampling of TCP connections between clients and Akamai servers. The measurements included the number of bytes per connection and the number of duplicate packets sent (which we use as an estimate of packet loss), and the Unix time. For the present analysis we used logs from the week of July 25 through 31, 2010. We also did a comparison on data from the same time period in 2009.
Autonomous Systems (ASs) of mobile Internet ser-vice providers had been identified, as part of the work for Akamai’s Quarterly State of Internet Report [2]. Some of such ASs were known a priori to the inves-tigators, some were identified by their name, and some by contacting them. Additional mobile ASs were found by using the discriminator of the ASs having a rela-tively low average connection speed. From the pool of such ASs, further inquiries were made. Results on the average connection speed, grouped by access type and country, are presented in [2] and not repeated here. Given countries in which mobile ASs had been identi-fied, a sampling of fixed-access ASs were also selected to provide a comparison. ASs that contained both mobile-and fixed-access were excluded.
TCP connections in the log files were selected where the client IP address was in one of the selected mobile or fixed ASs. We used the Akamai geo-location ser-vice EdgeScape [39] to identify the country in which the client IP was located. We obtained 149 million con-nections, across 57 countries, where we excluded coun-tries for which the dataset contained less than 1,000 mobile or fixed connections. The median number of mobile-access connections per-country was 48,000, and for fixed-access was 650,000.
As we were interested in comparing the mobile and fixed daily demand, we again used EdgeScape to obtain the latitude and longitude of the client of IP, from which
we obtained the local time zone relative to GMT. This enabled daily demand plots where hour “0” corresponds to midnight for the given client.
4. RESULTS
4.1 Number of Bytes per Connection
4.1.1 Summary Statistics
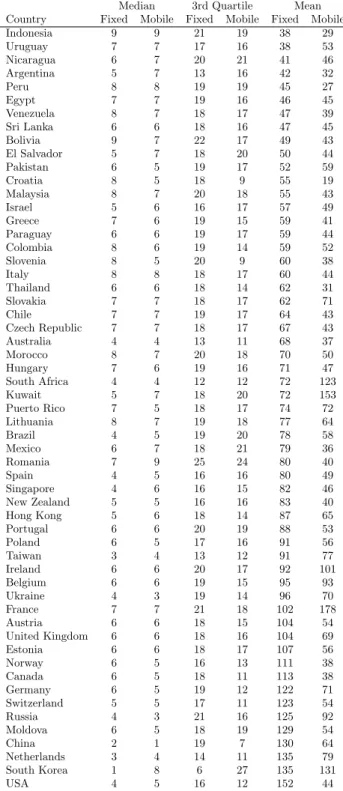
Table 1 shows the median, 3rd quartile, and mean of the number of KiloBytes-per-connection, partitioned by 57 countries and by fixed- versus mobile-access. The rows are arranged in increasing order of the mean num-ber of KBytes-per-connection for fixed-access. Note that the mean is larger than the 3rd quartile as the distribution of KBytes-per-connection tends to have a small percentage of large connections.
There is clear variation across countries. The median for fixed-access and for mobile-access varies from 1 to 9 KBbytes-per-connection; the 3rd quartile varies from 6 to 25 for fixed-access, and 7 to 27 for mobile-access; and the mean varies from 38 to 152 for fixed-access, and 19 to 178 for mobile-access.
There is also variation between fixed-access versus mobile-access. For 65% of the countries, the mean bytes-per-connection was at least one-third larger for fixed-access. For most of the countries (∼75% based on the 3rd quartile), the fixed-access connections have more KBytes than mobile-access; and thus there is a minority where the reverse pertains. As an example, in the USA, the 3rd quartile of KBytes-per-connection for fixed-ac-cess is larger than mobile-acfixed-ac-cess, being respectively 16 and 12; while in the South Korea the order is reversed, having values 6 and 27, respectively. In the USA, mean is again greater for fixed-access, 152 versus 44 KBytes-per-connection, while in France the corresponding val-ues are 102 and 178.
4.1.2 Distributions
We also examined the cumulative distribution func-tion (CDF) of KBytes-per-connecfunc-tion for fixed-access and mobile-access. Using the non-parametric Kolmogorov-Smirnov test, we found that the null hypothesis that the two sample distributions (fixed- and mobile-access) come from the same population distribution is rejected with high confidence, for all of the countries, typically with p-values much less than 0.01.
Although the two sample distributions are statisti-cally distinct, for many of the countries the visual differ-ence in the plot is rather slight. Though, for a minority of countries, the difference is dramatic. The following Figures 1-4 are a sampling of four countries.
For each country, we show two plots: a CDF with a linear scale on the axes, and a complementary distribu-tion funcdistribu-tion with logarithmic scales. The former is
use-Table 1: KiloBytes-per-Connection Statistics
Median 3rd Quartile Mean
Country Fixed Mobile Fixed Mobile Fixed Mobile
Indonesia 9 9 21 19 38 29 Uruguay 7 7 17 16 38 53 Nicaragua 6 7 20 21 41 46 Argentina 5 7 13 16 42 32 Peru 8 8 19 19 45 27 Egypt 7 7 19 16 46 45 Venezuela 8 7 18 17 47 39 Sri Lanka 6 6 18 16 47 45 Bolivia 9 7 22 17 49 43 El Salvador 5 7 18 20 50 44 Pakistan 6 5 19 17 52 59 Croatia 8 5 18 9 55 19 Malaysia 8 7 20 18 55 43 Israel 5 6 16 17 57 49 Greece 7 6 19 15 59 41 Paraguay 6 6 19 17 59 44 Colombia 8 6 19 14 59 52 Slovenia 8 5 20 9 60 38 Italy 8 8 18 17 60 44 Thailand 6 6 18 14 62 31 Slovakia 7 7 18 17 62 71 Chile 7 7 19 17 64 43 Czech Republic 7 7 18 17 67 43 Australia 4 4 13 11 68 37 Morocco 8 7 20 18 70 50 Hungary 7 6 19 16 71 47 South Africa 4 4 12 12 72 123 Kuwait 5 7 18 20 72 153 Puerto Rico 7 5 18 17 74 72 Lithuania 8 7 19 18 77 64 Brazil 4 5 19 20 78 58 Mexico 6 7 18 21 79 36 Romania 7 9 25 24 80 40 Spain 4 5 16 16 80 49 Singapore 4 6 16 15 82 46 New Zealand 5 5 16 16 83 40 Hong Kong 5 6 18 14 87 65 Portugal 6 6 20 19 88 53 Poland 6 5 17 16 91 56 Taiwan 3 4 13 12 91 77 Ireland 6 6 20 17 92 101 Belgium 6 6 19 15 95 93 Ukraine 4 3 19 14 96 70 France 7 7 21 18 102 178 Austria 6 6 18 15 104 54 United Kingdom 6 6 18 16 104 69 Estonia 6 6 18 17 107 56 Norway 6 5 16 13 111 38 Canada 6 5 18 11 113 38 Germany 6 5 19 12 122 71 Switzerland 5 5 17 11 123 54 Russia 4 3 21 16 125 92 Moldova 6 5 18 19 129 54 China 2 1 19 7 130 64 Netherlands 3 4 14 11 135 79 South Korea 1 8 6 27 135 131 USA 4 5 16 12 152 44
ful for seeing the bulk 90% of the connections, and the latter for the minority of large-size connections, which impact the means reported in Table 1.
For the USA and France, the distributions given fixed-access versus mobile-fixed-access are rather similar, at least for the bulk of the connections. The medians are es-sentially the same. By the 3rd quartile (75% quantile) the difference is more noticeable. An interesting con-trast between the USA and France is that in the for-mer the distribution given fixed-access connections has a heavier tail, whereas in the latter the mobile-access connections do, up to 10 MBytes. For example, in the USA, 0.7% of the fixed-access connections are at least 1 MBytes, which is greater than the 0.4% of mobile-access connections. In France, again 0.7% of the fixed-access connections are at least 1 MByte, whereas 2.9% of the mobile-access connections are. For connections of 100 MBytes or more, fixed-access dominates (though of course the percentage of connections is quite small). In contrast to the USA and France, China and South Korea are two of the minority of countries in Table 1 where the difference in distributions is visually quite evident even for the non-tail portion. Also, as a con-trast between South Korea and China, in the former the mobile-access connections are larger (in the sense of the CDF), and in the latter the reverse pertains, even up to connections of 10 MBytes. For example, in South Korea, 22% of the mobile-access connections are greater than 40 KBytes, while fewer (8%) of fixed-access are. In China, 8% of the mobile-access connections are greater than 40 KBytes, whereas more (15%) of fixed-access are.
4.2 Packet Loss
Packet loss on the connection is one of the perfor-mance measures of the quality of service provided by the network operator. We were curious how packet loss compared on fixed-access versus mobile-access net-works.
Note that this comparison of mobile- and fixed-access packet loss is for clients accessing web content from Aka-mai servers. The AkaAka-mai server is typically in the same AS as the client, in which case the loss, when it oc-curs, is within client’s AS. And if the server is not in the same AS, then in all likelihood it is in a nearby upstream AS. Thus, in general, the loss percentages re-ported herein will be lower as compared with when the client accesses web content directly from an origin site, as then the path is longer, with greater opportunity for experiencing congestion.
For each connection, we compute the percent of pack-ets sent from the server to the client that are duplicate packets, which we use as an estimate of lost packets.
Table 2 reports the 3rd quartile and mean per-con-nection percent packet loss, partitioned by country and
by fixed-access versus mobile-access connections. The median per-connection packet loss was 0.0% in all cases, except for Indonesia where on mobile-access it was 2.7%. Note that the mean per-connection packet loss gives equal weight to large and small connections. Thus, Ta-ble 2 also reports the overall, or access-network, packet loss, defined as the total number of duplicate packets, summed across the set of connections, divided by the total number of packets sent. The rows are ordered in increasing value of fixed-access minus mobile-access mean per-connection packet loss. Countries where this difference is positive, the last 16 rows of the table, had higher packet loss on the fixed-access connections.
Note that the mean per-connection packet loss is more often greater than the overall access-network packet loss, which indicates that smaller connections tend to have higher loss.
4.3 Dependence of Connection Size on Packet
Loss
We wanted to examine the heuristic notion that higher packet loss leads to smaller connection sizes. From Ta-ble 2 and TaTa-ble 1, we have the average network packet loss and mean connection size, respectively, per coun-try. Figure 5 displays a scatter plot of these values and a fitted linear regression line. Since the few countries with the upper-end packet loss can be considered atyp-ical, Figure 6 shows the subset of countries whose mean packet loss is no more than 3%. (The countries with the highest packet loss are Romania, Indonesia, and Bolivia.) Both plots are truly scattered; though, by eye one can sense a downward trend, i.e. smaller mean con-nection size with higher packet loss, for both fixed- and mobile-access. The regression lines are included not be-cause a linear model is a good fit, but to indicate the downward trend. The statistical test on the regression lines having zero slope is rejected with high confidence, 99.8% for mobile-access in Figure 6, and the others with higher confidence.
Although the data supports the notion that higher packet loss leads to smaller connection size, one’s view-point of the strength of the trend (-20 KBytes-per-percentage-packet-loss for mobile in Figure 6) is obvi-ously colored by one’s prior expectation. Regardless, the plots also clearly show the great variability. Of par-ticular note are the two countries whose fixed-access has high packet loss of at least 4% and relatively high mean connection size of at least 125 KBytes: China and Russia (see Tables 1 and 2).
4.4 Daily Traffic Pattern
We compared the mobile- and fixed-access daily de-mand. Figure 7 shows the fraction of Bytes sent in each of the 24 hours of a day, on fixed-access and on mobile-access networks across all countries. Figures for
KiloBytes/Connection P ercent of Connections 0 20 40 60 80 100 0% 20% 40% 60% 80% 100% USA fixed USA mobile
(a) Distribution for size of connections
KiloBytes/Connection
P
ercent of Connections
1e2 3e2 1e3 3e3 1e4 3e4 1e5 3e5
0.01% 0.03% 0.1% 0.3% 1% 3% 10% USA fixed USA mobile
(b) Complementary distribution for size of connections
Figure 1: USA KiloBytes/Connection P ercent of Connections 0 20 40 60 80 100 0% 20% 40% 60% 80% 100% France fixed France mobile
(a) Distribution for size of connections
KiloBytes/Connection
P
ercent of Connections
1e2 3e2 1e3 3e3 1e4 3e4 1e5 3e5
0.01% 0.03% 0.1% 0.3% 1% 3% 10% France fixed France mobile
(b) Complementary distribution for size of connections
KiloBytes/Connection P ercent of Connections 0 20 40 60 80 100 0% 20% 40% 60% 80% 100%
South Korea fixed South Korea mobile
(a) Distribution for size of connections
KiloBytes/Connection
P
ercent of Connections
1e2 3e2 1e3 3e3 1e4 3e4 1e5 3e5
0.01% 0.03% 0.1% 0.3% 1% 3%
10% South Korea fixed
South Korea mobile
(b) Complementary distribution for size of connections
Figure 3: South Korea
KiloBytes/Connection P ercent of Connections 0 20 40 60 80 100 0% 20% 40% 60% 80% 100% China fixed China mobile
(a) Distribution for size of connections
KiloBytes/Connection
P
ercent of Connections
1e2 3e2 1e3 3e3 1e4 3e4 1e5 3e5
0.01% 0.03% 0.1% 0.3% 1% 3% 10% China fixed China mobile
(b) Complementary distribution for size of connections
Table 2: Percent Packet Loss Statistics
Per-Connection Packet Loss Access-Network 3rd Quartile Mean Mean Packet Loss Country Fixed Mobile Fixed Mobile Fixed Mobile Romania 0.0 20.0 1.4 10.7 0.8 10.1 Argentina 0.0 12.5 1.8 8.0 2.1 6.9 Peru 0.0 9.1 2.0 5.8 2.0 5.1 Czech Republic 0.0 3.7 1.3 4.5 1.0 3.2 Egypt 8.0 15.4 5.7 8.8 5.1 6.4 Chile 0.0 6.7 2.0 5.1 1.4 2.7 Moldova 0.0 0.0 1.1 3.7 0.4 4.7 Colombia 0.0 3.8 2.3 4.8 1.9 2.2 Poland 0.0 2.9 1.8 4.2 1.1 1.9 Morocco 0.0 6.7 3.2 5.4 2.1 3.0 Portugal 0.0 2.1 1.6 3.7 0.8 3.4 Estonia 0.0 2.6 1.6 3.7 1.0 2.1 Ukraine 0.0 0.0 1.6 3.6 1.2 2.7 Hungary 0.0 1.3 1.8 3.7 1.0 2.0 Brazil 0.0 2.8 2.3 4.1 1.6 2.4 Croatia 0.0 0.0 1.4 3.1 1.0 3.8 Norway 0.0 0.0 1.5 3.2 0.5 3.1 Belgium 0.0 0.0 1.4 3.1 0.7 0.8 Spain 0.0 0.0 1.6 3.3 0.9 1.8 Lithuania 0.0 0.0 1.6 3.3 1.1 2.0 Venezuela 1.0 3.8 3.6 5.0 2.9 3.7 Greece 0.0 0.0 1.5 2.9 1.0 2.1 France 0.0 0.0 1.5 2.9 0.9 0.6 Puerto Rico 0.0 1.7 3.0 4.3 1.6 4.2 Italy 0.0 1.3 2.6 3.9 1.5 2.0 Israel 0.0 0.0 2.1 3.3 1.6 6.8 New Zealand 0.0 0.0 2.6 3.6 1.5 2.9 Ireland 0.0 0.0 2.5 3.3 0.9 1.0 Slovakia 0.0 0.0 2.1 2.9 1.6 1.3 Russia 0.0 2.0 4.0 4.7 5.2 2.9 South Korea 0.0 0.0 0.7 1.4 0.4 0.6 Austria 0.0 0.0 1.4 2.0 0.6 0.9 Canada 0.0 0.0 1.3 1.9 0.6 1.1 Taiwan 0.0 0.0 2.1 2.6 1.5 1.0 Hong Kong 0.0 0.0 1.9 2.4 1.1 1.1 Pakistan 3.0 3.4 4.8 5.2 4.2 3.5 Germany 0.0 0.0 1.2 1.6 0.5 4.2 Uruguay 0.0 0.0 2.9 3.3 2.4 2.3 Australia 0.0 0.0 2.5 2.9 1.3 1.6 Mexico 0.0 0.0 2.6 2.8 1.3 2.4 USA 0.0 0.0 1.9 1.9 0.9 1.4 Sri Lanka 2.1 0.0 3.5 3.1 3.2 3.3 Switzerland 0.0 0.0 1.5 1.0 0.6 0.6 Singapore 0.0 0.0 3.8 3.2 4.8 2.6 Netherlands 0.0 0.0 1.2 0.6 0.5 0.2 Slovenia 0.0 0.0 1.7 0.8 1.1 0.8 Indonesia 17.2 16.7 10.0 9.1 11.4 7.2 United Kingdom 0.0 0.0 2.8 1.7 0.9 1.0 Paraguay 5.7 2.6 5.4 4.0 5.0 3.6 Nicaragua 4.7 0.0 5.0 3.5 9.4 2.6 El Salvador 5.7 0.0 5.1 3.1 5.5 2.6 Kuwait 0.0 0.0 3.0 0.7 2.3 0.2 South Africa 0.0 0.0 3.4 1.0 3.5 0.6 Malaysia 9.1 0.0 6.0 3.5 6.5 4.2 Thailand 2.0 0.0 3.9 0.3 3.3 0.5 China 6.2 0.0 7.4 3.8 4.0 3.5 Bolivia 25.0 7.7 13.3 5.1 12.8 4.4 ● ● ● ● ● ● ● ● ● ● ● ● ●● ● ● ● ● ● ● ● ● ● ● ● ● ● ● ● ● ● ● ● ● ● ● ● ● ● ● ● ● ● ● ● ● ● ● ● ● ● ● ● ● ● ● ● 0 2 4 6 8 10 12 50 100 150
percent packet loss
mean connection siz
e [KB]
● fixed
mobile
Figure 5: Mean connection size versus packet loss, per country
● ● ● ● ● ● ● ● ● ● ● ● ● ● ● ● ● ● ● ● ● ● ● ● ● ● ● ● ● ● ● ● ● ● ● ● ● ● ● ● ● ● ● 0.5 1.0 1.5 2.0 2.5 3.0 50 100 150
percent packet loss
mean connection siz
e [KB]
● fixed
mobile
Figure 6: Mean connection size versus packet loss, per country, for the subset of countries whose mean packet loss is no more than 3%
0.00 0.05 0.10 0.15 0.20 Hour Fr
action of Sum of Bytes
0 2 4 6 8 10 12 14 16 18 20 22 0 % 5 % 10 % A v er age P ack et Loss fixed bytes mobile bytes fixed packet loss mobile packet loss
Figure 7: Daily distribution for size of connec-tions and packet loss, all countries
some individual countries are in Appendix A. We deter-mined the latitude and longitude of the client address, from which we obtained the local time zone relative to GMT, see Sec. 3, and thus we could bin the traffic such that the hour “0” corresponds to midnight for the given client. Also shown on the plots is the mean per-connection packet loss in the respective hour.
In Figure 7 the daily demand pattern for fixed- and mobile-access are very much alike—fixed has a slightly higher afternoon peak, and mobile-access has a bit higher proportion the post-midnight early-morning hours. Packet loss on mobile-access is higher than on fixed-access and has a larger increase during the heavy traffic period of the day.
As one would expect, the packet loss for both mobile-and fixed-access increases during the busy period of the day. If one considered the regression of the per-hour packet loss on the per-hour fraction of Bytes sent, then the hypothesis of zero slope would be rejected with ex-tremely high confidence (p-value less than 1e-6) for both mobile- and fixed-access. The correlation of packet loss with the fraction of Bytes sent is 0.94 for mobile-access and 0.95 for fixed-access.
4.5 Comparison with July 2009
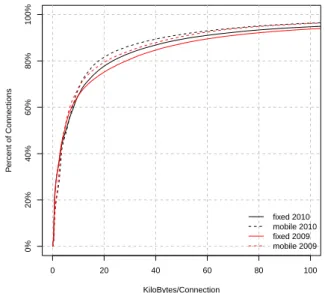
We were interested in whether the KBytes-per-con-nection has changed over time, particularly for mobile-access. We compared the July 2010 data with July 2009. For the July 2009 data, we again computed the cumulative distribution function of KBytes-per-connec-tion, for given country and given access type. Then
KiloBytes/Connection P ercent of Connections 0 20 40 60 80 100 0% 20% 40% 60% 80% 100% fixed 2010 mobile 2010 fixed 2009 mobile 2009
Figure 8: Distribution for size of connections, all countries, 2009 versus 2010
for each country for which we had sufficient data from July 2009, which was 53 out of the 57 countries, and for each access type, we applied the Kolmogorov-Smirnov test to the sample CDFs from 2009 and from 2010. For 47 of the 53 countries, the sample CDFs are from dis-tinct distributions with 99% confidence or greater, for both fixed and mobile access.
Rather than showing the analogue of Table 1, we show the difference. For the 47 countries with statisti-cally distinct distributions, Table 3 shows the 3rd quar-tile, and mean, from the July 2010 CDF minus that from July 2009, for given access type, and where the rows are sorted by the last column. Negative values in the table indicate that the 3rd quartile, or the mean, from 2010 is smaller than that from 2009, which would suggest smaller connections in 2010.
Figure 8 shows the CDF of bytes-per-connection from all countries, Figure 9 from the USA. To the extent that the CDF for July 2010 data lies above that for July 2009 data, for given access type, indicates that connections have become a bit smaller.
5. CONCLUSIONS
We examined the distribution of the number of bytes-per-connection, and packet loss from a sampling of logs from servers of Akamai Technologies.
Regarding to the original question of whether the more adverse conditions on mobile-access networks leads to shorter connections, the rough, first-order answer is “yes”; though, a fuller answer is much more nuanced. One caution to keep in mind is that the statistical
anal-Table 3: Difference in KiloBytes-per-Connection July 2010 versus July 2009
KiloBytes-per-Connection 3rd Quartile from 2010 Mean from 2010
minus minus
3rd Quartile from 2009 Mean from 2009
Country Fixed Mobile Fixed Mobile
Kuwait -3 -92 -26 -691 Puerto Rico -6 0 -2 -217 Moldova -2 -2 58 -130 Morocco -2 -7 -47 -96 Paraguay -5 -2 -1 -66 China -8 -15 -3 -64 Pakistan 0 -2 -25 -61 Sri Lanka -4 -4 -4 -55 Mexico -3 -4 -6 -50 Poland -5 -6 -51 -50 Brazil -4 -6 -38 -49 Russia -4 -6 -82 -49 Argentina 1 -4 -15 -38 Estonia -1 0 -21 -37 Taiwan -2 -7 -10 -30 New Zealand -4 -4 7 -24 Uruguay -5 -6 -29 -23 Czech Republic -3 -3 -45 -19 Norway -4 -4 20 -16 Croatia -7 -13 -13 -14 Venezuela -4 -1 -44 -14 Hong Kong 1 -4 -13 -10 Hungary -1 -5 -76 -10 Israel 2 -2 -9 -10 Australia -3 -5 9 -9 Indonesia 0 -3 4 -9 Italy -4 -6 -11 -7 Greece -5 -5 -18 -4 Canada -5 -2 0 -3 Switzerland -3 -10 -26 -1 USA -3 0 48 5 Egypt -1 5 -25 6 Chile 0 -1 -5 8 Netherlands -8 -6 -30 9 Thailand 0 4 -10 9 Lithuania -3 -3 -72 11 Bolivia 1 -4 -84 12 Slovenia -3 -11 -5 12 Austria -2 -1 3 14 Slovakia -2 -3 -21 17 Germany -5 -4 -18 25 United Kingdom -2 -1 17 26 Ukraine 1 3 -79 38 Ireland -4 -1 16 48 Belgium -3 -6 10 55 South Africa -1 4 -17 62 France 0 -6 -13 82 KiloBytes/Connection P ercent of Connections 0 20 40 60 80 100 0% 20% 40% 60% 80% 100% USA fixed 2010 USA mobile 2010 USA fixed 2009 USA mobile 2009
Figure 9: Distribution for size of connections, USA, 2009 versus 2010
ysis of the present study does not prove a causal re-lationship. Tables 1 and 2 do show that on a per-country basis, packet loss is higher and the mean con-nection size is smaller on mobile-access for most coun-tries; but there are noted exceptions. From the view-point of distributions, we found that the difference be-tween the bytes-per-connection for mobile-access ver-sus fixed-access, as well as the packet-loss distributions, was statistically significant, for all countries we anal-ysed. However, when plotted, the visual difference is typically small. Also, for some countries, the mobile-access had the larger connections.
In a scatter plot of per-country mean connection size versus mean packet loss, there is a statistically signifi-cant trend of smaller connections having higher packet loss for both mobile- and fixed-access, though there is great variability. Aggregating across counties, we found that the daily demand variation is about the same for mobile- and fixed-access, and for both, the packet loss does increase during the busy period of the day, though the increase of mobile-access is greater, suggest-ing greater sensitivity to the increased demand, that is a greater likelihood of constrained capacity. Though, as reported in Appendix A, some countries have little to no daily variation in packet loss. We also found per-connection packet loss for both fixed- and mobile-access is often greater than the overall access-network packet loss, indicating smaller connections having higher loss.
Self-selection explains partially why mobile-access con-nections are typically smaller than fixed-access connec-tions. Users may prefer not to stream long video clips,
engage in large downloads, or do other high volume transactions over mobile-access connections. Prevalence of high-speed mobile-access connections could lead to more traffic over mobile-access. In other words, a com-plementary effect would occur, where higher speed of mobile-access would enable more large-volume transac-tions.
Comparing our results from 2010 to those from 2009 of the same time period, we found that connections have become a bit smaller over time. The high packet loss ev-ident in some access networks may lead to smaller con-nections as users decide to discontinue use as they per-ceive their experience unsatisfactorily. Also, as newer web browser versions open more connections in hope of sustaining higher download speeds [40], the size of connections tends to decrease over time.
Acknowledgments
During this work, MH was a Visiting Student at MIT CSAIL. MH’s work was supported by FICNIA and TEKES. We would like to thank Steven Bauer, David Clark, Rub´en Garc´ıa, Tuomo Komulainen, William Lehr, Antti Riikonen, Jesse Sowell, and Stephen Woodrow for their assistance and comments. Any opinions expressed, and any errors are solely the responsibility of the authors.
6. REFERENCES
[1] Sandvine, “Fall 2010 Global Internet Phenomena,” Tech. Rep., 2010.
[2] Akamai, “State of the Internet 2Q/2010,” Tech. Rep., 2010.
[3] Cisco, “Cisco visual networking index: forecast and methodology, 2009-2014,” Tech. Rep., 2010. [4] Comscore, “The 2009 U.S. Digital Year in
Review,” Tech. Rep., 2010.
[5] M. Hibberd, “Mobile data traffic almost triples year on year,” Informa, 2010.
[6] Nielsen, “Android Soars, but iPhone Still Most Desired as Smartphones Grab 25% of U.S. Mobile Market,” 2010.
[7] A. Smith, “Mobile Access 2010,” Pew Research Center, Tech. Rep., 2010.
[8] ——, “Home Broadband 2010,” Pew Research Center, Tech. Rep., 2010.
[9] Validas, “Verizon Wireless Smartphones Consume More Data than iPhones,” 2010.
[10] Akamai, “State of the Internet 4Q/2009,” Tech. Rep., 2009.
[11] G. Blennerud, “Mobile broadband: busting the myth of the scissor effect,” Ericsson Business Review, no. 2, pp. 50–55, 2010.
[12] T. Smura, A. Kivi, and J. T¨oyli, “A framework for analysing the usage of mobile services,” Info, vol. 11, no. 4, pp. 53–67, 2009.
[13] T. Hossfeld, K. Tutschku, and F. U. Andersen, “Mapping of file-sharing onto mobile
environments: feasibility and performance of eDonkey with GPRS,” in IEEE Wireless Communications and Networking Conference (WCNC), 2005, pp. 2453–2458.
[14] P. Svoboda, “Measurement and Modelling of Internet Traffic over 2.5 and 3G Cellular Core Networks,” Ph.D. dissertation, Vienna University of Technology, 2008.
[15] R. Kalden and H. Ekstr¨om, “Searching for mobile mice and elephants in GPRS networks,”
SIGMOBILE Mob. Comput. Commun. Rev., vol. 8, pp. 37–46, 2004.
[16] P. Benko, G. Malicsko, and A. Veres, “A large-scale, passive analysis of end-to-end TCP performance over GPRS,” in Twenty-third Annual Joint Conference of the IEEE Computer and Communications Societies (INFOCOM), 2004, pp. 1882–1892.
[17] M. Ivanovich, J. Li, T. Neame, and P. Fitzpatrick, “Modelling GPRS data traffic,” in IEEE Global Telecommunications Conference (GLOBECOM), 2004, pp. 3300–3304.
[18] L. Plissonneau, J.-L. Costeux, and P. Brown, “Analysis of Peer-to-Peer Traffic on ADSL,” in Passive and Active Network Measurement Conference (PAM), 2005, pp. 69–82.
[19] K. Cho, K. Fukuda, H. Esaki, and A. Kato, “The impact and implications of the growth in
residential user-to-user traffic,” in Proceedings of the 2006 Conference on Applications,
Technologies, Architectures, and Protocols for Computer Communications (SIGCOMM), 2006, pp. 207–218.
[20] ——, “Observing slow crustal movement in residential user traffic,” in Proceedings of the 2008 ACM CoNEXT Conference, 2008.
[21] M. Dischinger, A. Haeberlen, K. P. Gummadi, and S. Saroiu, “Characterizing residential broadband networks,” in Proceedings of the 7th ACM SIGCOMM Conference on Internet Measurement (IMC), 2007, pp. 43–56.
[22] M. Siekkinen, D. Collange, G. Urvoy-Keller, and E. W. Biersack, “Performance Limitations of ADSL Users: A Case Study,” in Passive and Active Network Measurement Conference (PAM), 2007.
[23] M. Afanasyev, T. Chen, G. M. Voelker, and A. C. Snoeren, “Analysis of a mixed-use urban wifi network: when metropolitan becomes neapolitan,” in Proceedings of the 8th ACM SIGCOMM Conference on Internet Measurement (IMC), 2008, pp. 85–98.
“Measuring Mobile Peer-to-Peer Usage: Case Finland 2007,” in Passive and Active Network Measurement Conference (PAM), 2009, pp. 165–174.
[25] A. Riikonen and A. Kivi, “IP Traffic Measurements 2008: Mobile Internet Usage Patterns,” TKK Helsinki University of Technology, Tech. Rep., 2009.
[26] S. Bauer, D. Clark, and W. Lehr, “Broadband microfoundations: the need for traffic data,” in Beyond Broadband Access. New America Foundation, 2009.
[27] G. Maier, A. Feldmann, V. Paxson, and M. Allman, “On dominant characteristics of residential broadband internet traffic,” in Proceedings of the 9th ACM SIGCOMM Conference on Internet Measurement (IMC), 2009, pp. 90–102.
[28] G. Maier, F. Schneider, and A. Feldmann, “A First Look at Mobile Hand-Held Device Traffic,” in Passive and Active Measurement Conference (PAM), 2010, pp. 161–170.
[29] M. Pietrzyk, J. L. Costeux, G. U. Keller, and T. E. Najjary, “Challenging statistical
classification for operational usage: the ADSL case,” in Proceedings of the 9th ACM SIGCOMM Conference on Internet Measurement (IMC), 2009, pp. 122–135.
[30] P. Romirer-Maierhofer, F. Ricciato, A. D’Alconzo, R. Franzan, and W. Karner, “Network-Wide Measurements of TCP RTT in 3G,” in Traffic Monitoring and Analysis, 2009, pp. 17–25. [31] Ofcom, “UK broadband speeds, May 2010: The
performance of fixed-line broadband delivered to UK residential consumers,” Tech. Rep., 2010. [32] M. E. Wetzstein, Microeconomic Theory.
South-Western, 2005.
[33] I. Vogelsang, “The relationship between mobile and fixed-line communications: A survey,” Information Economics and Policy, vol. 22, no. 1, pp. 4–17, 2010.
[34] M. R. Ward and G. A. Woroch, “The effect of prices on fixed and mobile telephone penetration: Using price subsidies as natural experiments,” Information Economics and Policy, vol. 22, no. 1, pp. 18–32, 2010.
[35] A. Bohlin, H. Gruber, and P. Koutroumpis, “Diffusion of new technology generations in mobile communications,” Information Economics and Policy, vol. 22, no. 1, pp. 51–60, 2010. [36] Finnish Communications Regulatory Authority
(Ficora), “Communications market in Finland 2009,” Tech. Rep., 2010.
[37] W. H. Lehr and J. M. Chapin, “On the
convergence of wired and wireless access network
architectures,” Information Economics and Policy, vol. 22, no. 1, pp. 33–41, 2010.
[38] W. Lehr, “Mobile broadband and implications for broadband competition and adoption,”
Broadband of America, Tech. Rep., 2009. [39] Akamai, “Akamai’s Edgescape Geo-Location
Service,” Tech. Rep., 2010.
[40] N. Dukkipati, T. Refice, Y. Cheng, J. Chu, T. Herbert, A. Agarwal, A. Jain, and N. Sutin, “An argument for increasing TCP’s initial congestion window,” SIGCOMM Comput. Commun. Rev., vol. 40, no. 3, pp. 26–33, 2010.
APPENDIX
0.00 0.05 0.10 0.15 0.20 Hour Fr
action of Sum of Bytes
0 2 4 6 8 10 12 14 16 18 20 22 0 % 5 % 10 % A v er age P ack et Loss
Argentina fixed bytes Argentina mobile bytes Argentina fixed packet loss Argentina mobile packet loss
Figure 10: Daily distribution for size of connec-tions and packet loss, Argentina
0.00 0.05 0.10 0.15 0.20 Hour Fr
action of Sum of Bytes
0 2 4 6 8 10 12 14 16 18 20 22 0 % 5 % 10 % A v er age P ack et Loss
Australia fixed bytes Australia mobile bytes Australia fixed packet loss Australia mobile packet loss
Figure 11: Daily distribution for size of connec-tions and packet loss, Australia
0.00 0.05 0.10 0.15 0.20 Hour Fr
action of Sum of Bytes
0 2 4 6 8 10 12 14 16 18 20 22 0 % 5 % 10 % A v er age P ack et Loss
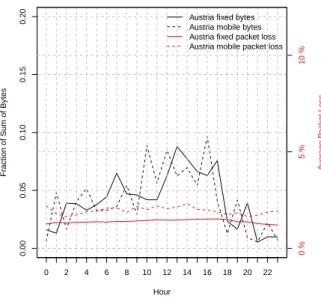
Austria fixed bytes Austria mobile bytes Austria fixed packet loss Austria mobile packet loss
Figure 12: Daily distribution for size of connec-tions and packet loss, Austria
0.00 0.05 0.10 0.15 0.20 Hour Fr
action of Sum of Bytes
0 2 4 6 8 10 12 14 16 18 20 22 0 % 5 % 10 % A v er age P ack et Loss
Brazil fixed bytes Brazil mobile bytes Brazil fixed packet loss Brazil mobile packet loss
Figure 13: Daily distribution for size of connec-tions and packet loss, Brazil
0.00 0.05 0.10 0.15 0.20 Hour Fr
action of Sum of Bytes
0 2 4 6 8 10 12 14 16 18 20 22 0 % 5 % 10 % A v er age P ack et Loss
Canada fixed bytes Canada mobile bytes Canada fixed packet loss Canada mobile packet loss
Figure 14: Daily distribution for size of connec-tions and packet loss, Canada
0.00 0.05 0.10 0.15 0.20 Hour Fr
action of Sum of Bytes
0 2 4 6 8 10 12 14 16 18 20 22 0 % 5 % 10 % A v er age P ack et Loss
Chile fixed bytes Chile mobile bytes Chile fixed packet loss Chile mobile packet loss
Figure 15: Daily distribution for size of connec-tions and packet loss, Chile
0.00 0.05 0.10 0.15 0.20 Hour Fr
action of Sum of Bytes
0 2 4 6 8 10 12 14 16 18 20 22 0 % 5 % 10 % A v er age P ack et Loss
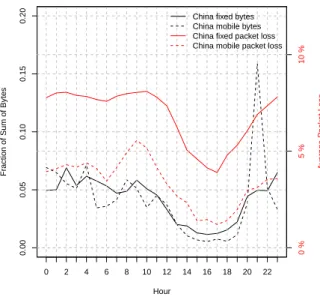
China fixed bytes China mobile bytes China fixed packet loss China mobile packet loss
Figure 16: Daily distribution for size of connec-tions and packet loss, China
0.00 0.05 0.10 0.15 0.20 Hour Fr
action of Sum of Bytes
0 2 4 6 8 10 12 14 16 18 20 22 0 % 5 % 10 % A v er age P ack et Loss
France fixed bytes France mobile bytes France fixed packet loss France mobile packet loss
Figure 17: Daily distribution for size of connec-tions and packet loss, France
0.00 0.05 0.10 0.15 0.20 Hour Fr
action of Sum of Bytes
0 2 4 6 8 10 12 14 16 18 20 22 0 % 5 % 10 % A v er age P ack et Loss
Germany fixed bytes Germany mobile bytes Germany fixed packet loss Germany mobile packet loss
Figure 18: Daily distribution for size of connec-tions and packet loss, Germany
0.00 0.05 0.10 0.15 0.20 Hour Fr
action of Sum of Bytes
0 2 4 6 8 10 12 14 16 18 20 22 0 % 5 % 10 % A v er age P ack et Loss
Greece fixed bytes Greece mobile bytes Greece fixed packet loss Greece mobile packet loss
Figure 19: Daily distribution for size of connec-tions and packet loss, Greece
0.00 0.05 0.10 0.15 0.20 Hour Fr
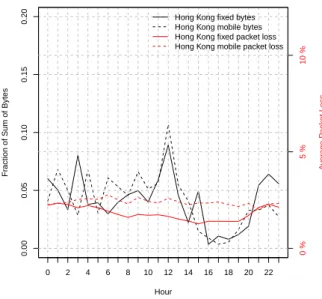
action of Sum of Bytes
0 2 4 6 8 10 12 14 16 18 20 22 0 % 5 % 10 % A v er age P ack et Loss
Hong Kong fixed bytes Hong Kong mobile bytes Hong Kong fixed packet loss Hong Kong mobile packet loss
Figure 20: Daily distribution for size of connec-tions and packet loss, Hong Kong
0.00 0.05 0.10 0.15 0.20 Hour Fr
action of Sum of Bytes
0 2 4 6 8 10 12 14 16 18 20 22 0 % 5 % 10 % A v er age P ack et Loss
Hungary fixed bytes Hungary mobile bytes Hungary fixed packet loss Hungary mobile packet loss
Figure 21: Daily distribution for size of connec-tions and packet loss, Hungary
0.00 0.05 0.10 0.15 0.20 Hour Fr
action of Sum of Bytes
0 2 4 6 8 10 12 14 16 18 20 22 0 % 5 % 10 % A v er age P ack et Loss
Indonesia fixed bytes Indonesia mobile bytes Indonesia fixed packet loss Indonesia mobile packet loss
Figure 22: Daily distribution for size of connec-tions and packet loss, Indonesia
0.00 0.05 0.10 0.15 0.20 Hour Fr
action of Sum of Bytes
0 2 4 6 8 10 12 14 16 18 20 22 0 % 5 % 10 % A v er age P ack et Loss
Ireland fixed bytes Ireland mobile bytes Ireland fixed packet loss Ireland mobile packet loss
Figure 23: Daily distribution for size of connec-tions and packet loss, Ireland
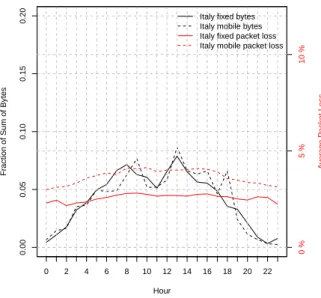
0.00 0.05 0.10 0.15 0.20 Hour Fr
action of Sum of Bytes
0 2 4 6 8 10 12 14 16 18 20 22 0 % 5 % 10 % A v er age P ack et Loss
Italy fixed bytes Italy mobile bytes Italy fixed packet loss Italy mobile packet loss
Figure 24: Daily distribution for size of connec-tions and packet loss, Italy
0.00 0.05 0.10 0.15 0.20 Hour Fr
action of Sum of Bytes
0 2 4 6 8 10 12 14 16 18 20 22 0 % 5 % 10 % A v er age P ack et Loss
Malaysia fixed bytes Malaysia mobile bytes Malaysia fixed packet loss Malaysia mobile packet loss
Figure 25: Daily distribution for size of connec-tions and packet loss, Malaysia
0.00 0.05 0.10 0.15 0.20 Hour Fr
action of Sum of Bytes
0 2 4 6 8 10 12 14 16 18 20 22 0 % 5 % 10 % A v er age P ack et Loss
Norway fixed bytes Norway mobile bytes Norway fixed packet loss Norway mobile packet loss
Figure 26: Daily distribution for size of connec-tions and packet loss, Norway
0.00 0.05 0.10 0.15 0.20 Hour Fr
action of Sum of Bytes
0 2 4 6 8 10 12 14 16 18 20 22 0 % 5 % 10 % A v er age P ack et Loss
Pakistan fixed bytes Pakistan mobile bytes Pakistan fixed packet loss Pakistan mobile packet loss
Figure 27: Daily distribution for size of connec-tions and packet loss, Pakistan
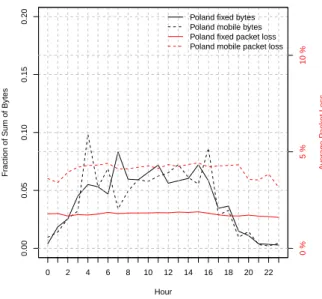
0.00 0.05 0.10 0.15 0.20 Hour Fr
action of Sum of Bytes
0 2 4 6 8 10 12 14 16 18 20 22 0 % 5 % 10 % A v er age P ack et Loss
Poland fixed bytes Poland mobile bytes Poland fixed packet loss Poland mobile packet loss
Figure 28: Daily distribution for size of connec-tions and packet loss, Poland
0.00 0.05 0.10 0.15 0.20 Hour Fr
action of Sum of Bytes
0 2 4 6 8 10 12 14 16 18 20 22 0 % 5 % 10 % A v er age P ack et Loss
Slovakia fixed bytes Slovakia mobile bytes Slovakia fixed packet loss Slovakia mobile packet loss
Figure 29: Daily distribution for size of connec-tions and packet loss, Slovakia
0.00 0.05 0.10 0.15 0.20 Hour Fr
action of Sum of Bytes
0 2 4 6 8 10 12 14 16 18 20 22 0 % 5 % 10 % A v er age P ack et Loss
Spain fixed bytes Spain mobile bytes Spain fixed packet loss Spain mobile packet loss
Figure 30: Daily distribution for size of connec-tions and packet loss, Spain
0.00 0.05 0.10 0.15 0.20 Hour Fr
action of Sum of Bytes
0 2 4 6 8 10 12 14 16 18 20 22 0 % 5 % 10 % A v er age P ack et Loss
Taiwan fixed bytes Taiwan mobile bytes Taiwan fixed packet loss Taiwan mobile packet loss
Figure 31: Daily distribution for size of connec-tions and packet loss, Taiwan
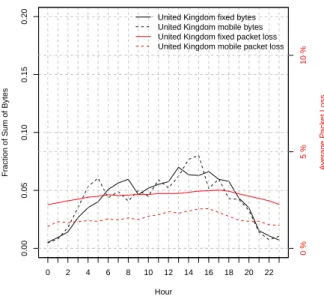
0.00 0.05 0.10 0.15 0.20 Hour Fr
action of Sum of Bytes
0 2 4 6 8 10 12 14 16 18 20 22 0 % 5 % 10 % A v er age P ack et Loss
United Kingdom fixed bytes United Kingdom mobile bytes United Kingdom fixed packet loss United Kingdom mobile packet loss
Figure 32: Daily distribution for size of connec-tions and packet loss, United Kingdom
0.00 0.05 0.10 0.15 0.20 Hour Fr
action of Sum of Bytes
0 2 4 6 8 10 12 14 16 18 20 22 0 % 5 % 10 % A v er age P ack et Loss
USA fixed bytes USA mobile bytes USA fixed packet loss USA mobile packet loss
Figure 33: Daily distribution for size of connec-tions and packet loss, USA
0.00 0.05 0.10 0.15 0.20 Hour Fr
action of Sum of Bytes
0 2 4 6 8 10 12 14 16 18 20 22 0 % 5 % 10 % A v er age P ack et Loss
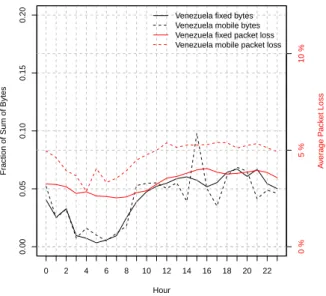
Venezuela fixed bytes Venezuela mobile bytes Venezuela fixed packet loss Venezuela mobile packet loss
Figure 34: Daily distribution for size of connec-tions and packet loss, Venezuela