Open Archive TOULOUSE Archive Ouverte (OATAO)
OATAO is an open access repository that collects the work of Toulouse researchers and
makes it freely available over the web where possible.
This is an author-deposited version published in :
http://oatao.univ-toulouse.fr/
Eprints ID : 16647
To link to this article : DOI:10.1016/j.jpowsour.2016.03.095
URL :
http://dx.doi.org/10.1016/j.jpowsour.2016.03.095
To cite this version :
Péan, Clarisse and Rotenberg, Benjamin and
Simon, Patrice and Salanne, Mathieu Multi-scale modelling of
supercapacitors:From molecular simulations to a transmission line
model. (2016) Journal of Power Sources, vol. 326. pp. 680-685.
ISSN 0378-7753
Any correspondence concerning this service should be sent to the repository
administrator:
[email protected]
Multi-scale modelling of supercapacitors: From molecular simulations
to a transmission line model
C. Pean
a,b,c, B. Rotenberg
a,c, P. Simon
b,c, M. Salanne
a,c,d,* aSorbonne Universit!es, UPMC Univ. Paris 06, UMR 8234, PHENIX, F-75005 Paris, FrancebCIRIMAT, UMR CNRS 5085, Universit!e Paul Sabatier, F-31062 Toulouse, France
cR!eseau sur le Stockage Electrochimique de l'Energie (RS2E), FR CNRS 3459, 80039 Amiens Cedex, France
dMaison de la Simulation, USR 3441, CEA e CNRS - INRIA - Universit!e Paris Sud e Universit!e de Versailles, F-91191 Gif-sur-Yvette, France
h i g h l i g h t s
! Model supercapacitors are simulated under constant applied potential conditions. ! The results are injected in a transmission line model.
! The predicted charging plots agree very well with non-equilibrium MD.
Keywords:
Supercapacitors
Molecular dynamics simulation Porous materials
Dynamic processes Transport properties
a b s t r a c t
We perform molecular dynamics simulations of a typical nanoporous-carbon based supercapacitor. The organic electrolyte consists in 1-ethyl-3-methylimidazolium and hexafluorophosphate ions dissolved in acetonitrile. We simulate systems at equilibrium, for various applied voltages. This allows us to deter-mine the relevant thermodynamic (capacitance) and transport (in-pore resistivities) properties. These quantities are then injected in a transmission line model for testing its ability to predict the charging properties of the device. The results from this macroscopic model are in good agreement with non-equilibrium molecular dynamics simulations, which validates its use for interpreting electrochemical impedance experiments.
1. Introduction
Carbon electrodes-based supercapacitors are electrochemical energy storage devices characterized by good power performances. They can be charged/discharged on very short timescales (e.g. a few seconds), so that they are useful in many applications[1]. They also show exceptional cycle lifes, since they can sustain millions of cy-cles whereas batteries survive a few thousand at best. This is due to the molecular mechanism involved in the charge storage. It simply consists in the adsorption of the ions from the electrolyte on high surface area electrodes. Unlike Li-ion batteries, there is no limita-tion due to faradaic reaclimita-tions and to the transport of electrons and
ions inside a low conductivity material[2]. The volumetric capac-itance, and hence the energy density of the devices, dramatically increases when using nanoporous carbon electrodes[3]. This effect can be optimized by matching the average pore size with the adsorbed ions dimension [4,5], even if the pore size dispersity should be taken into account [6]. However, the power density performances of such devices may be affected. In sub-nanometric pores, the ions become highly confined[7], which has raised the question whether one should expect detrimental transport limitations.
In recent years, several simulation studies have aimed at un-derstanding the dynamics of the ions at the molecular scale. Kon-drat et al. have combined molecular dynamics with a phenomenological mean-field type model to study the charging of slit-pores with various wettabilities towards ionic liquids. They have shown that in the generic case (wettable pores), charging is a diffusive process [8,9]. Although the calculated diffusion
*Corresponding author. Sorbonne Universit!es, UPMC Univ. Paris 06, UMR 8234, PHENIX, F-75005 Paris, France.
E-mail address:[email protected](M. Salanne).
coefficients for the ions are generally lower than in the bulk ionic liquids, they observed a voltage range in which they eventually became larger, due to the onset of collective modes [9]. More recently, He et al. have also observed such effects in molecular dynamics simulations when the size of the slit-pores match the ionic dimensions[10]. In the case of the adsorption of electrolytes in more complex nanoporous carbons with several types of pores, the enhancement of the diffusivity is not observed[11,12]. However the diffusion coefficient values remain reasonable since they are on average lower than the bulk liquid ones by one order of magnitude only, which explains the fast charging of these supercapacitors.
Injecting the information extracted from molecular-scale sim-ulations into macroscopic models would be very valuable. For supercapacitors, the canonical model used to interpret electro-chemical impedance spectra is the transmission line model intro-duced by de Levie[13,14]. It is an equivalent circuit which consists in an infinite succession of electrode slices composed of a resistance and a capacitor, that are connected together. In a recent work we have shown that it was possible to fit the variation of the total charge on the electrode with respect to time when charging a nanoporous carbon-based supercapacitor using non-equilibrium molecular dynamics simulations[15]. The only fitting parameter was the in-pore resistivity. Here we go further in that direction, by showing that the transmission line model can be fully parameter-ized without any fitting, simply by including physical quantities determined in equilibrium molecular dynamics simulations. The resulting model shows a very good agreement with non-equilibrium molecular dynamics, which validates its use for the sample sizes we consider. The simulated system consists in a generic electrolyte, i.e. 1-butyl-3-methylimidazolium and hexa-fluorophosphate ions [C4mimþ][PF6#] dissolved in acetonitrile at
the concentration of 1.5 mol L#1, and a realistic model of nano-porous carbide-derived carbons for the electrodes.
2. Molecular dynamics simulations
The simulation cells consists of [C4 mimþ][PF6#] dissolved in
acetonitrile (at the concentration of 1.5 mol L#1, which is classically used in experiments[16,17]), surrounded by two identical nano-porous carbon electrodes placed symmetrically. The position of the carbon atoms inside the electrodes, which are held fixed, were obtained by quenched molecular dynamics by Palmer et al.[18]. They have an average pore size of 0.9 nm, and the structural characteristics of the electrodes match well with the experimental data for a carbide-derived carbon synthesized at 1200+C. We will
therefore label it CDC-1200 in the following. The distances between the two electrodes along the z direction are chosen in order to reproduce the experimental density of the bulk electrolyte. The lengths of the box are provided inTable 1together with the number of molecules, and a representative snapshot is shown inFig. 1.
Molecular dynamics simulations are conducted with a timestep of 2 fs. The simulations are performed in the NVE ensemble at room temperature (298 K). Following our previous works[19,20], we use
the coarse-grained model of Roy and Maroncelli [21,22]for the ionic liquid [C4mimþ][PF6#] and the one of Edwards et al.[23]for
acetonitrile. Three interaction sites describe the cation and the acetonitrile molecules, while a single site describes the anion. The Coulombic interactions are calculated through a two-dimensional Ewald summation [24,25] because two dimensional periodic boundary conditions are used (there is no periodicity in the z direction).
Two series of simulations were performed. The first one involves non-equilibrium simulations, which aim at simulating the charging process, and proceeds via the following steps. The system is first equilibrated for a few nanoseconds with a constant charge of 0 e on all carbon atoms and then with a 0 V potential difference between the two electrodes. Then at t ¼ 0, this potential difference
DJ
0is suddenly set to 1 V (on each electrode we haveJ
þ¼DJ
0/2 andJ
#¼#DJ
0/2) and maintained constant using a method developed by Reed et al.[24]from the model of metallic carbon electrodes proposed by Siepmann and Sprik[26]. In this approach, the charge distribution on each electrode is obtained by requiring that the potential experienced by each atom is equal to the preset electrode potential value at each molecular dynamics time step. It is computationally expensive compared to constant charge simula-tions but is compulsory for a realistic description of the charge repartition, which is rather broadly distributed[19,27], and of dy-namic processes. In particular we have shown that simulations in which the electrode charge distribution is held fixed yields unphysically high temperature increases during transient regimes[28]. Simulations are continued long enough for the total charge accumulated on the electrode to reach a plateau. Discharge simu-lations are also performed, by suddenly setting the potential dif-ference to 0 V. In this work we perform a charge-discharge-charge cycle, for a total simulation time of 16 ns.
The second series deals with equilibrium simulations. In that case, the system is first equilibrated with a constant charge of 0 e, ± 0.005 e, or ± 0.01 e, which is equally distributed among electrode atoms. We previously showed that these charges are good starting values to initialize constant potential simulations at respectively 0, 1 or 2 V potential differences. Constant-potential production runs of 13 ns are then performed at these values.
3. Results and discussion
3.1. Electrosorption observation
It is well established that fluids have different transport prop-erties when they are confined in porous media compared to the bulk[29e33]. In the case of electrolytes, the diffusion coefficients of the ions are particularly impacted [34,35]. In addition, when a liquid is adsorbed inside a porous electrode with applied voltage, its composition changes, sometimes leading to an unexpected enhancement of the diffusivity with respect to the bulk[8e10]. In-pore resistivities, mean-square displacements, diffusion co-efficients, as well as adsorption lifetimes are complementary quantities which can be extracted from computer simulations to characterize the singular transport in the pores of the material.
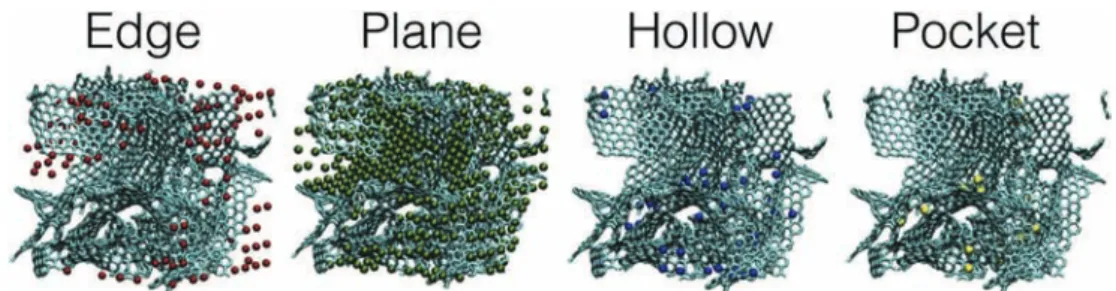
In the case of complex porous carbons such as the CDC we study here, there are numerous confinement sites that cannot be repre-sented by simple slit pores. In a previous work, we have identified four different types of sites, which are respectively labelled edge, plane, hollow or pocket, from the less confined to the more confined. The ranking of the sites is based on the degree of confinement, which is defined by the percentage of the solid angle around the ion which is occupied by the carbon atoms[7]. These sites are relatively homogeneously distributed inside the CDC-1200 electrode, as shown inFig. 2.
Table 1
Lengths of the box and number of molecules for each kind of simulation. The chosen carbide-derived carbon (CDC) is in both cases the CDC-1200 in contact with the ionic liquid [C4mimþ][PF6#] dissolved in acetonitrile at a concentration of 1.5 mol L#1. Two dimensional periodic boundary conditions are used, i.e. there is no periodicity in the
z direction. Nionscorresponds to the number of ion pairs and NACNto the number of acetonitrile molecules.
Simulations Lx¼ Ly(nm) Lz(nm) NC Nions NACN
Non-equilibrium 4,37 19,44 3649 230 2146 Equilibrium 4,37 32,46 3649 384 3584
In order to understand the charging mechanism in such a complex porous network, it is instructive to examine the individual trajectories of the ions in the simulation cell. An example is shown inFig. 3where we follow the trajectory in the z direction of an anion entering the positive electrode, during a non-equilibrium charging simulation. During some time intervals the ion is trap-ped - electrosorbed - at the electrode surface, while during others it diffuses more freely. Electrosorption periods are characterized by a fixed value of z and of the ion coordination number by the elec-trolyte molecule (solvation number, SN) and by the carbon atoms of the electrode (surface coordination number, SCN), which are also shown onFig. 3. When the ion is electrosorbed, the SCN fluctuates around a fixed value corresponding to a hollow type confinement site. When it diffuses, its SCN decreases while its SN increases. Thus, the carbon atoms counterbalance the loss of solvent molecules inside the electrode. The typical residence times of electrosorbed ions at the surface, observed inFig. 3, are around a nanosecond,
which is consistent with the timescales in our previous work[11].
3.2. Transmission line model
When a potential difference is imposed to the supercapacitor, the combination of all these individual diffusion/electrosorption processes then leads to the global charging of the supercapacitor. The interpretation of electrochemical impedance experiments generally relies on equivalent electric circuits[36]and for nano-porous carbon electrodes, the most used model is the transmission line model (TLM)[13,14,37,38], where the charge penetrates pro-gressively inside the electrode. We showed previously that this model was suitable to interpret our simulations[15]. The TLM is based on an infinite succession of electrode slices connected together, as shown inFig. 4. Each slice is described by a capacitance and a resistance.
When modelling the simulation cell shown inFig. 1with a TLM,
Fig. 1. Typical snapshot of the simulation cell. Blue: acetonitrile; red: C4mimþ; green: PF6#and turquoise: carbon electrodes. (For interpretation of the references to colour in this figure legend, the reader is referred to the web version of this article.)
Fig. 2. Repartition of the adsorption sites inside our modelled CDC electrode.
Fig. 3. Entrance of an anion inside the positive electrode: Evolution of the z coordinate (green), of the solvation number (dark blue), of the surface coordination number (orange). The limit between the electrode and the bulk is represented by the dashed line in black. The anion alternatively diffuses or becomes electrosorbed in pore sites of varying degree of confinement. When the number of coordination by the carbon increases, the number of solvation decreases. (For interpretation of the references to colour in this figure legend, the reader is referred to the web version of this article.)
the choice of the number of slices is delicate. Indeed, the slices need to be as large as possible to account for a good representation of the selected zones, meaning that the heterogeneities in the charging process[15]due to the local porosity of the material and to the repartition of the confinement sites can be averaged out. Given the small size of the simulated supercapacitors, we chose a two-slice TLM. InFig. 4, Rbulkis the resistance of the electrolyte in the layer of bulk liquid between the two electrodes, Rlis the resistance of the electrolyte adsorbed in an electrode slice, and Clis the capacitance of each slice.
In this two-slice TLM, the total charge of the electrode is given by the following expression[15]:
Q ðtÞ ¼ Qmax ! 1 # A1exp " #
t
t 1 # # A2exp " #t
t 2 #$ (1) where Qmax¼c bV0¼ ClV0t
1¼ 2 a þpffiffiffiffiffiffiffiffiffiffiffiffiffiffiffiffiffia2# 4bt
2¼ 2 a # ffiffiffiffiffiffiffiffiffiffiffiffiffiffiffiffiffi a2# 4b p A1¼ 1 2 ! 1 þ 2bd # ac 2c ffiffiffiffiffiffiffiffiffiffiffiffiffiffiffiffiffi a2# 4b p $ A2¼ 1 2 ! 1 # 2bd # ac 2c ffiffiffiffiffiffiffiffiffiffiffiffiffiffiffiffiffi a2# 4b p $ : with a ¼R2Rbulkþ 6Rl lðRbulkþ 2RlÞCl b ¼ 2 RlðRbulkþ 2RlÞCl2 c ¼R 2 lðRbulkþ 2RlÞCl d ¼R 1 bulkþ 2Rl :A very basic calculation allows to see how the components of
Q(t) physically behave. In the approximation where Rlis larger than
Rbulk, A1#1 and A2#1 scale as R#1=2l , while
t
1andt
2scale as Rl.The layers capacitance Clis a direct output from the simulations since we can measure the total charge accumulated on each region of the electrode at each timestep. Rbulk is computed from the
electrical conductivity
s
¼ 5.3 S m#1. Rlis the only parameter which is difficult to extract from the simulations. A first approach that we have used in a previous work[15]is to determine it by fitting the plots Q ¼ f(t) obtained by non-equilibrium simulations of the charging process using a least-square method. In our previous work, we have shown that the agreement between the TLM and the raw data from the simulations is good, and so the two slices model is sufficient for the supercapacitors modeled here.In this work we describe another way to reach the unknown parameter Rl. From equilibrium simulations conducted at a fixed potential value, the transport of the anions, cations or acetonitrile molecules inside the electrodes can be accurately characterized by computing their mean square displacements (MSD) and diffusion coefficients[11].
In particular, equilibrium molecular dynamics simulations allow to calculate the electrical conductivity of a bulk ionic liquid, by using the following Green-Kubo formula[39]:
K ¼
b
e 2 V t/∞lim 1 6 v vt *' ' ' ' ' X N i qiD
riðtÞ ' ' ' ' ' 2+ ; (2)where K is the conductivity,
b
¼ 1/kBT with T the temperature and kB the Boltzmann constant, V is the volume of the system, e the elementary charge,D
ri(t) is the displacement of ion i, bearing a formal charge qi, during time t and N is the number of ions in the simulation cell. Due to the sum over all the ions, long simulation times are required for gathering enough statistics. In the system we consider here, additional difficulties arise from the geometry of the simulation cell (two-dimensional periodicity) and the fact that the electrolyte is adsorbed in a porous network. We also need to ac-count for the exchange of ions with the bulk electrolyte. We thus have to use the modified relationshipK0*
J
elec+¼b
e 2 Velec lim Nt/∞ 1 4 v vtF * t;J
elec+ (3)where F(t,
J
elec) is given byF*t;
J
elec+ *'' ' ' ' ' X Nt j XN i qid
r⊥i,tj# tj#1-SiD,tj -' ' ' ' ' ' 2 + Jelec (4) In this function, the two sums run respectively over the number of time intervals Ntused to calculate the auto-correlation function and all the ions N in the simulation cell. Velecis the volume occupiedby the ions inside the electrode. Si
D is a discontinuous presence
function, which takes a value of 1 if an ion is present in the elec-trode at time tjand 0 otherwise. The displacements of ion i are calculated along the x and y coordinates only, so that we note the corresponding quantity as
d
r⊥i (and the 6 in Equation(2)is now replaced by a 4). The resulting in-pore conductivity depends on the electric potential which is applied to the electrodes
J
elec.The results obtained for the function F(t,
J
elec) are reported for different electrode potentials inFig. 5. A linear r!egime is reached forFig. 4. Equivalent circuit in the transmission line model. Rbulkis the resistance of the electrolyte in the bulk region, while Rland Clare the resistance and the capacitance inside the
long times, from which we can determine K0(
J
elec). The in-poreresistance defined in the transmission line model is then given by:
Rl *
J
elec+¼ l A 1 K0*J
elec+ (5)where l is the length of the electrode slice (here it is the length of the electrode along the z direction divided by 2) and A its section. The dependence on the applied potential that we observe is not included in the TLM, so that we use the value of Rlat 0 V in the following. When inserting this value into Equation(1)(Rlenters in the constants A1et A2and mostly in the constants
t
1ett
2), we cancalculate the Q ¼ f(t) plot for a charging process using Equation(1)
and the one for a discharging process using
Q ðtÞ ¼ Qmax ! A1exp " #
t
t 1 # þ A2exp " #t
t 2 #$ (6) The evolution of the total charge yielded by the TLM is compared inFig. 6 with the results of our non-equilibrium mo-lecular dynamics simulations, for a charge-discharge-charge cycle. The agreement is remarkably good, which means that it is possibleto predict in a reliable way the behavior of supercapacitors in non-equilibrium conditions using non-equilibrium properties only. If we assume that the system is large enough to represent a macroscopic electrode, it validates the use of the TLM for interpreting experi-mental data and provides a microscopic insight on the parameters extracted from impedance spectroscopy.
4. Conclusion
The examination of individual trajectories of the electrolyte ions and solvent molecules adsorbed inside a typical nanoporous carbide-derived carbon electrode during its charging shows that while they diffuse from pore to pore they experience many (elec-tro-)sorption events at the electrode surface. When switching from the local pore scale to the macroscopic scale of an electrode, it is necessary to account for all the trajectories of all the adsorbed species. In terms of equivalent electrical circuit, such a behavior is well represented by the transmission line model introduced by de Levie.
In this work, we have shown that it is possible to fully param-eterize a transmission line model from equilibrium molecular dy-namics only. The relevant quantities are the bulk electrolyte conductivity and the capacitance, which are routinely evaluated in such simulations. The conductivity of the electrolyte inside the
electrodes is more difficult to determine, and it requires to perform
long simulations. The accuracy of the parameterized TLM is vali-dated by comparing the evolution of the charge inside the electrode during a charge-discharge-charge cycle to the case of non-equilibrium molecular dynamics simulations. This study opens the door for a quantitative comparison between molecular-scale simulations and electrochemical impedance experiments, even if the results will have to be generalized to other systems. For example, many new electrolytes are currently designed in order to improve the energy density of supercapacitors[40,41], and it will be necessary to determine their transport properties inside the pores for assessing their power performances. For the electrodes, many new materials are based on graphene[42], and are thus more ordered than the carbide-derived carbon we consider here. It will therefore be necessary to check the validity of the TLM under such conditions. Finally, in the case of pseudocapacitors [43e45], the additional faradaic mechanisms may impact the charging dynamics at the molecular scale. A recent simulation study has shown that the electron transfer rates are enhanced by the frustration of the solvation structure close to MnO2surfaces[46]. Determining such
rates would allow to derive macroscopic models for pseudocapa-citors with deep molecular-scale insights.
Acknowledgments
We acknowledge the support from the European Research Council under the European Union's Seventh Framework Pro-gramme (FP/2007-2013)/ERC grant Agreement n.102539 (Advanced grant, Ionaces project). We are grateful for the computing resources on OCCIGEN (CINES, French National HPC) and CURIE (TGCC, French National HPC) obtained through the project x2015096728.
References
[1] J.R. Miller, P. Simon, Electrochemical capacitors for energy management, Sci-ence 321 (2008) 651e652,http://dx.doi.org/10.1126/science.1158736.http:// www.sciencemag.org/content/321/5889/651.
[2] P. Simon, Y. Gogotsi, B. Dunn, Where do batteries end and supercapacitors begin ? Science 343 (2014) 1210e1211, http://dx.doi.org/10.1126/sci-ence.1249625.http://www.sciencemag.org/content/343/6176/1210. [3] J. Chmiola, G. Yushin, Y. Gogotsi, C. Portet, P. Simon, P.-L. Taberna, Anomalous Fig. 5. Mean square displacements multiplied by anions and cations charge (Q-MSD),
at different electrode potentials.
0 2 4 6 8 10 12 14 16
t (ns)
0 5 10 15 20 25 30Q
tot(e)
Fig. 6. Comparison between the values of the total charge on the positive electrode during a charge-discharge cycle obtained with non-equilibrium simulations (black) and the predicted values of the total charge using the transmission line model using in-pore resistances Rlobtained with equilibrium simulations (red). (For interpretation of
the references to colour in this figure legend, the reader is referred to the web version of this article.)
increase in carbon capacitance at pore sizes less than 1 nanometer, Science 313 (2006) 1760e1763, http://dx.doi.org/10.1126/science.1132195. http:// www.sciencemag.org/content/313/5794/1760.
[4] C. Largeot, C. Portet, J. Chmiola, P.-L. Taberna, Y. Gogotsi, P. Simon, Relation between the ion size and pore size for an electric double-layer capacitor, J. Am. Chem. Soc. 130 (2008) 2730e2731, http://dx.doi.org/10.1021/ ja7106178.http://dx.doi.org/10.1021/ja7106178.
[5] R. Lin, P. Huang, J. Segalini, C. Largeot, P.L. Taberna, J. Chmiola, Y. Gogotsi, P. Simon, Solvent effect on the ion adsorption from ionic liquid electrolyte into sub-nanometer carbon pores, Electrochim. Acta 54 (2009) 7025e7032,http:// dx.doi.org/10.1016/j.electacta.2009.07.015. http://www.sciencedirect.com/ science/article/pii/S0013468609009347.
[6] S. Kondrat, C.R. Perez, V. Presser, Y. Gogotsi, A.A. Kornyshev, Effect of pore size and its dispersity on the energy storage in nanoporous supercapacitors, En-ergy & Environ. Sci. 5 (4) (2012) 6474e6479, http://dx.doi.org/10.1039/ C2EE03092F. http://pubs.rsc.org/en/content/articlelanding/2012/ee/ c2ee03092f.
[7] C. Merlet, C. Pean, B. Rotenberg, P.A. Madden, B. Daffos, P.-L. Taberna, P. Simon, M. Salanne, Highly confined ions store charge more efficiently in super-capacitors, Nat. Commun. 4 (2013) 2701, http://dx.doi.org/10.1038/ ncomms3701. http://www.nature.com/ncomms/2013/131029/ncomms3701/ full/ncomms3701.html.
[8] S. Kondrat, A.A. Kornyshev, Charging dynamics and optimization of nano-porous supercapacitors, J. Phys. Chem. C 117 (2013) 12399e12406,http:// dx.doi.org/10.1021/jp400558y.http://dx.doi.org/10.1021/jp400558y. [9] S. Kondrat, P. Wu, R.A. Qiao, A.A. Kornyshev, Accelerating charging dynamics
in subnanometre pores, Nat. Mater. 13 (2014) 387e393,http://dx.doi.org/ 10.1038/nmat3916. http://www.nature.com/nmat/journal/v13/n4/full/ nmat3916.html.
[10] Y. He, R. Qiao, J. Vatamanu, O. Borodin, D. Bedrov, J. Huang, B.G. Sumpter, The importance of ion packing on the dynamics of ionic liquids during micropore charging, J. Phys. Chem. Lett. 7 (2016) 36e42.
[11] C. Pean, B. Daffos, B. Rotenberg, P. Levitz, M. Haefele, P.-L. Taberna, P. Simon, M. Salanne, Confinement, desolvation, and electrosorption effects on the diffusion of ions in nanoporous carbon electrodes, J. Am. Chem. Soc. doi: 10.1021/jacs.5b07416. URLhttp://pubs.acs.org/doi/pdf/10.1021/jacs.5b07416. [12] N.N. Rajput, J.D. Monk, F.R. Hung, Ionic liquids confined in a realistic activated carbon model: a molecular simulation study, J. Phys. Chem. C 118 (2014) 1540e1553.
[13] R. de Levie, On porous electrodes in electrolyte solutions : I. capacitance ef-fects, Electrochim. Acta 8 (1963) 751e780.
[14] R. de Levie, On the impedance of electrodes with rough interfaces, J. Electroanal. Chem. 261 (1989) 1e9.
[15] C. Pean, C. Merlet, B. Rotenberg, P.A. Madden, P.-L. Taberna, B. Daffos, M. Salanne, P. Simon, On the dynamics of charging in nanoporous carbon-based supercapacitors, ACS Nano 8 (2014) 1576e1583, http://dx.doi.org/ 10.1021/nn4058243.http://dx.doi.org/10.1021/nn4058243.
[16] W.-Y. Tsai, P.-C. Gao, B. Daffos, P.-L. Taberna, C.R. Perez, Y. Gogotsi, F. Favier, P. Simon, Ordered mesoporous silicon carbide-derived carbon for high-power supercapacitors, Electrochem. Commun. 34 (2013) 109e112.
[17] A. Brandt, A. Balducci, Theoretical and practical energy limitations of organic and ionic liquid-based electrolytes for high voltage electrochemical double layer capacitors, J. Power Sources 250 (2014) 343e351.
[18] J. Palmer, A. Llobet, S.-H. Yeon, J. Fischer, Y. Shi, Y. Gogotsi, K. Gubbins, Modeling the structural evolution of carbide-derived carbons using quenched molecular dynamics, Carbon 48 (2010) 1116e1123,http://dx.doi.org/10.1016/ j.carbon.2009.11.033. http://www.sciencedirect.com/science/article/pii/ S0008622309007684.
[19] C. Merlet, B. Rotenberg, P.A. Madden, P.-L. Taberna, P. Simon, Y. Gogotsi, M. Salanne, On the molecular origin of supercapacitance in nanoporous car-bon electrodes, Nat. Mater. 11 (2012) 306e310,http://dx.doi.org/10.1038/ nmat3260. http://www.nature.com/nmat/journal/v11/n4/full/nmat3260. html.
[20] C. Pean, B. Daffos, C. Merlet, B. Rotenberg, P.-L. Taberna, P. Simon, M. Salanne, Single electrode capacitances of porous carbons in neat ionic liquid electrolyte at 100)C : a combined experimental and modeling approach, J. Electrochem. Soc. 162 (2015) A5091eA5095, http://dx.doi.org/10.1149/2.0151505jes.
http://jes.ecsdl.org/content/162/5/A5091.abstract.
[21] D. Roy, N. Patel, S. Conte, M. Maroncelli, Dynamics in an idealized ionic liquid model, J. Phys. Chem. B 114 (2010) 8410e8424,http://dx.doi.org/10.1021/ jp1004709.http://pubs.acs.org/doi/abs/10.1021/jp1004709.
[22] D. Roy, M. Maroncelli, An improved four-site ionic liquid model, J. Phys. Chem. B 114 (2010) 12629e12631,http://dx.doi.org/10.1021/jp108179n.http://dx. doi.org/10.1021/jp108179n.
[23] D.M. Edwards, P. Madden, I. McDonald, A computer simulation study of the dielectric properties of a model of methyl cyanide, Mol. Phys. 51 (1984) 1141e1161, http://dx.doi.org/10.1080/00268978400100731. http://www. ingentaconnect.com/content/tandf/tmph/1984/00000051/00000005/
art00005.
[24] S.K. Reed, O.J. Lanning, P.A. Madden, Electrochemical interface between an ionic liquid and a model metallic electrode, J. Chem. Phys. 126 (2007) 084704,
http://dx.doi.org/10.1063/1.2464084. http://jcp.aip.org/resource/1/jcpsa6/ v126/i8/p084704_s1.
[25] T.R. Gingrich, M. Wilson, On the Ewald summation of Gaussian charges for the simulation of metallic surfaces, Chem. Phys. Lett. 500 (2010) 178e183,http:// dx.doi.org/10.1016/j.cplett.2010.10.010. http://www.sciencedirect.com/ science/article/B6TFN-51696XX-2/2/071a9d8af52b303caffcb3ff8b637fdc. [26] J.I. Siepmann, M. Sprik, Influence of surface topology and electrostatic
po-tential on water/electrode systems, J. Chem. Phys. 102 (1995) 511e524,
http://dx.doi.org/10.1063/1.469429. http://scitation.aip.org/content/aip/ journal/jcp/102/1/10.1063/1.469429.
[27] D.T. Limmer, C. Merlet, M. Salanne, D. Chandler, P.A. Madden, R. van Roij, B. Rotenberg, Charge fluctuations in nanoscale capacitors, Phys. Rev. Lett. 111 (2013) 106102, http://dx.doi.org/10.1103/PhysRevLett.111.106102. http:// link.aps.org/doi/10.1103/PhysRevLett.111.106102.
[28] C. Merlet, C. Pean, B. Rotenberg, P.A. Madden, P. Simon, M. Salanne, Simulating supercapacitors: can we model electrodes as constant charge surfaces? J. Phys. Chem. Lett. 4 (2013) 264e268,http://dx.doi.org/10.1021/jz3019226.
http://dx.doi.org/10.1021/jz3019226.
[29] G. Hummer, J.C. Rasaiah, J.P. Noworyta, Water conduction through the hy-drophobic channel of a carbon nanotube, Nature 414 (2001) 188e190. [30] J.D. Moore, J.C. Palmer, Y.-C. Liu, T.J. Roussel, J.K. Brennan, K.E. Gubbins,
Adsorption and diffusion of argon confined in ordered and disordered microporous carbons, Appl. Surf. Sci. 256 (2010) 5131e5136, http:// dx.doi.org/10.1016/j.apsusc.2009.12.071. http://www.sciencedirect.com/ science/article/pii/S0169433209017930.
[31] A. H. Farmahini, A. Shahtalebi, H. Jobic, S. K. Bhatia, Influence of structural heterogeneity on diffusion of CH4and CO2in silicon carbide-derived
nano-porous carbon, J. Phys. Chem. Cdoi:10.1021/jp502929k. URLhttp://dx.doi.org/ 10.1021/jp502929k.
[32] K. Falk, B. Coasne, R. Pellenq, F.-J. Ulm, L. Bocquet, Subcontinuum mass transport of condensed hydrocarbons in nanoporous media, Nat. Commun. 6 (2015) 6949.
[33] G. Ori, C. Massobrio, A. Pradel, M. Ribes, B. Coasne, Structure and dynamics of ionic liquids confined in amorphous porous chalcogenides, Langmuir 31 (2015) 6742e6751.
[34] K.L. Van Aken, J.K. McDonough, Effect of cation on diffusion coefficient of ionic liquids at onion-like carbon electrodes, J. Phys. Condens. Matter 26 (28) (2014) 284104,http://dx.doi.org/10.1088/0953-8984/26/28/284104. [35] P.-A. Cazade, R. Hartkamp, B. Coasne, Structure and dynamics of an electrolyte
confined in charged nanopores, J. Phys. Chem. C 118 (2014) 5061e5072,
http://dx.doi.org/10.1021/jp4098638.http://dx.doi.org/10.1021/jp4098638. [36] L. Zubieta, R. Bonert, Characterization of double-layer capacitors for power
electronics applications, IEEE Trans. Ind. Appl. 36 (1997) 199e205,http:// dx.doi.org/10.1109/28.821816.
[37] B.E. Conway, Electrochemical Supercapacitors, Kluwer Academic, Plenum Publishers, 1999.
[38] P.-L. Taberna, P. Simon, J.-F. Fauvarque, Electrochemical Characteristics, Impedance Spectroscopy, Studies of carbon-carbon supercapacitors, J. Electrochem. Soc. 150 (2003) A292eA300, http://dx.doi.org/10.1149/ 1.1543948.http://jes.ecsdl.org/content/150/3/A292.
[39] J.-P. Hansen, I. McDonald, Theory of Simple Liquids, fourth ed., Academic Press, 1986.
[40] S. Pohlmann, T. Olyschlager, P. Goodrich, J.A. Vicente, J. Jacquemin, A. Balducci, Azepanium-based ionic liquids as green electrolytes for high voltage super-capacitors, J. Power Sources 273 (2015) 931e936.
[41] C. Schütter, T. Husch, M. Korth, A. Balducci, Toward new solvents for EDLCs: from computational screening to electrochemical validation, J. Phys. Chem. C 119 (2015) 13413e13424.
[42] P.-C. Gao, W.-Y. Tsai, B. Daffos, P.-L. Taberna, C.R. Perez, Y. Gogotsi, P. Simon, F. Favier, Graphene-like carbide derived carbon for high-power super-capacitors, Nano Energy 1 (2014) 747e754, http://dx.doi.org/10.1016/ j.nanoen.2014.12.017. http://www.sciencedirect.com/science/article/pii/ S2211285514002869.
[43] M. Toupin, T. Brousse, D. B!elanger, Charge storage mechanism of mno2
slec-trode used in aqueous electrochemical capacitor, Chem. Mater 16 (2004) 3184e3190.
[44] T. Brousse, D. Belanger, J.W. Long, To be or not to be pseudocapacitive? J. Electrochem. Soc. 162 (2015) A5185eA5189.
[45] V. Augustyn, J. Come, M.A. Lowe, J.W. Kim, P.-L. Taberna, S.H. Tolbert, H.D. Abruna, P. Simon, B. Dunn, High-rate electrochemical energy storage through liþ intercalation pseudocapacitance, Nat. Mater 12 (2013) 518e522. [46] R.C. Remsing, I.G. McKendry, D.R. Strongin, M.L. Klein, M.J. Zdilla, Frustrated solvation structures can enhance electron transfer rates, J. Phys. Chem. Lett. 6 (2015) 4804e4808.