HAL Id: hal-00998303
https://hal.archives-ouvertes.fr/hal-00998303
Submitted on 1 Jun 2014HAL is a multi-disciplinary open access archive for the deposit and dissemination of sci-entific research documents, whether they are pub-lished or not. The documents may come from teaching and research institutions in France or abroad, or from public or private research centers.
L’archive ouverte pluridisciplinaire HAL, est destinée au dépôt et à la diffusion de documents scientifiques de niveau recherche, publiés ou non, émanant des établissements d’enseignement et de recherche français ou étrangers, des laboratoires publics ou privés.
Weighted Krippendorff’s alpha is a more reliable metrics
for multi- coders ordinal annotations: experimental
studies on emotion, opinion and coreference annotation.
Jean-Yves Antoine, Jeanne Villaneau, Anaïs Lefeuvre
To cite this version:
Jean-Yves Antoine, Jeanne Villaneau, Anaïs Lefeuvre. Weighted Krippendorff’s alpha is a more re-liable metrics for multi- coders ordinal annotations: experimental studies on emotion, opinion and coreference annotation.. EACL 2014, Apr 2014, Gotenborg, Sweden. 10 p. �hal-00998303�
Weighted Krippendorff's alpha is a more reliable metrics for
multi-coders ordinal annotations: experimental studies on emotion, opinion
and coreference annotation
Jean-Yves Antoine
Université François Rabelais de
Tours, LI (EA 6300)
Blois, France
[email protected]Jeanne Villaneau
Université Européenne de
Bretagne, IRISA
Lorient, France
[email protected]Anaïs Lefeuvre
Université François Rabelais
de Tours, LI (EA 6300)
Blois, France
Abstract
The question of data reliability is of first im-portance to assess the quality of manually an-notated corpora. Although Cohen ’ s κ is the prevailing reliability measure used in NLP, al-ternative statistics have been proposed. This paper presents an experimental study with four measures (Cohen’s κ, Scott’s π, binary and weighted Krippendorff ’ s α) on three tasks: emotion, opinion and coreference annotation. The reported studies investigate the factors of influence (annotator bias, category prevalence, number of coders, number of categories) that should affect reliability estimation. Results show that the use of a weighted measure re-stricts this influence on ordinal annotations. They suggest that weighted α is the most reli-able metrics for such an annotation scheme.
1
Introduction
The newly intensive use of machine learning techniques as well as the need of evaluation data has led Natural Language Processing (NLP) to develop large annotated corpora. The interest for such enriched language resources has reached domains (semantics, pragmatics, affective com-puting) where the annotation process is highly affected by the coders subjectivity. The reliabil-ity of the resulting annotations must be trusted by measures that assess the inter-coders agreement. While medecine, psychology, and more gener-ally content analysis, have considered for years the issue of data reliability, NLP has only inves-tigated this question from the mid 1990s. The influential work of Carletta (1996) has led the κ statistic (Cohen, 1960) to become the prevailing standard for measuring the reliability of corpus annotation. Many studies have however ques-tioned the limitations of the κ statistic and have proposed alternative measures of reliability. Krippendorff claims that “popularity of κ
not-withstanding, Cohen’s κ is simply unsuitable as
a measure of the reliability of data” in a paper presenting his α coefficient (Krippendorff, 2008).
Except for some rare but noticeable studies (Arstein and Poesio, 2005), most of these critical works restrict to theoretical issues about chance agreement estimation or limitations due to vari-ous statistical biases (Arstein and Poesio, 2008). On the opposite, this paper investigates experi-mentally these questions on three different tasks: emotion, opinion and coreference annotation. Four measures of reliability will be considered: Cohen’s κ (Cohen, 1960), Scott’s π (Scott, 1955) and two measures of Krippendorff’s α (Krippen-dorff, 2004) with different distance.
Section 2 gives a comprehensive presentation of these metrics. Section 3 details the potential methodological biases that should affect the reli-ability estimation. In section 4, we explain the methodology we followed for this study. Lastly, experimental results are presented in section 5.
2
Reliability measures
Any reliability measure considers the most perti-nent criterion to estimate data reliability to be reproducibility. Reproducibility can be estimated by observing the agreement among independent annotators (Krippendorff, 2004): the more the coders agree on the data they have produced, the more their annotations are likely to be repro-duced by any other set of coders.
Pure observed agreement is not considered as a good estimator since it does not give any ac-count to the amount of chance that yields to this agreement. For instance, a restricted number of coding categories should favor chance agree-ment. What must be estimated is the proportion of observed agreement beyond the one that is expected by chance: (1) Measure = e e o A A A − − 1
where Ao is the observed agreement between coders and Ae is an estimation of the possible chance agreement. Reliability metrics differ by the way they estimate this chance agreement.
Cohen’s κκκκ (Cohen, 1960) defines chance as the statistical independence of the use of coding categories by the annotators. It postulates that chance annotation is governed by prior distribu-tions that are specific to each coder (annotator bias). κ was originally developed for two coders and nominal data. (Davies and Fleiss, 1982) has proposed a generalization to any number of cod-ers, while (Cohen, 1968) has defined a weighted version of the κ measure that fulfils better the need of reliability estimation for ordinal annota-tions: the disagreement between two ordinal an-notations is no more binary, but depends on a Euclidian distance. This weighted generalization restricts however to a two coders scheme (Art-stein and Poesio, 2008): a weighted version of the multi-coders κ statistics is still missing.
Unlike Cohen’s κ, Scott’s ππππ (Scott, 1955) does not aim at modelling annotator bias. It de-fines chance as the statistical independence of the data and the set of coding categories, inde-pendently from the coders. It considers therefore the annotation process and not the behaviour of the annotators. Scott’s original proposal con-cerned only two coders. (Fleiss 1971) gave a generalisation of the statistics to any number of coders through a measure of pairwise agreement. Krippendorff‘s ααα (Krippendorff, 2004) con-α siders chance independently from coders like Scott’s π, but data reliability is estimated de-pending on disagreement instead of agreement:
(2) Alpha = e o e D D D −
where Do is the observed disagreement be-tween coders and De is an estimation of the pos-sible chance disagreement. Another original as-pect of this metrics is to allow disagreement es-timation between two categories through any distance measure. This implies that α handles directly any number of coders and any kind of annotation (nominal or ordinal coding scheme). In this paper, we will consider the α statistics with a binary as well as a Euclidian distance, in order to assess separately the influence of the distance measure and the metrics by itself.
3
Quality criteria for reliability metrics
There is an abundant literature about the criteria of quality a reliability measure should satisfy
(Hayes, 2007). These works emphasize on two important points:
• A trustworthy measure should provide sta-ble results: measures must be reasonably independent of any factor of influence. • The magnitude of the measure must be
in-terpreted in terms of absolute level of reli-ability: the statistics must come up with trustworthy reliability thresholds.
These questions have mainly been investigated from a theoretical point of view. This section summarizes the main conclusions that should be drawn from these critical studies.
3.1 Annotator bias and number of coders Annotator bias refers to the influence of the idio-syncratic behavior of the coders. It can be esti-mated by a bias index which measures the extent to which the distribution of categories differs from one coder’s annotation to another (Sim and Wright, 2005). Annotator bias has an influence on the magnitude of the reliability measures (Feinstein and Cicchetti,1990). Besides, it con-cerns the invariance of the measures to the per-mutation or selection of annotators but also to the number of coders. A review of the literature shows that theoretical studies on annotator bias are not convergent. In particular, opposite argu-ments have been proposed concerning Cohen’s κ (Di Eugenio and Glass 2004, Arstein and Poesio 2008, Hayes, 2007). This is why we have carried on experiments that investigate:
• to what extent measures depend on the se-lection of a specific set of coders (§ 5.3), • to what extent the stability of the measures
depends on the number of coders (§ 5.4). Arstein and Poesio (2005) have shown that the greater the number of coders is, the lower the annotator bias decreases. Our aim is to go further this conclusion: we will study whether one measure needs fewer coders than another one to converge towards an acceptable annotator bias.
3.2 Category prevalence
Prevalence refers to the influence on reliability estimation of a coding category under which a disproportionate amount of annotated data falls. It can be estimated by a prevalence index which measures the frequency differences of categories on cases where the coders agree (Sim and Wright, 2005). When the prevalence index is
high, chance-corrected measures are spuriously reduced since chance agreement is higher in this situation (Brennan and Sliman, 1992; Di Eugenio and Glass, 2004). This yields some authors to propose corrected coefficients like the PABAK measure (Byrt and al., 1993), which is a preva-lence adjusted and annotator bias adjusted ver-sion of Cohen’s κ. The influence of prevalence will not be investigated here, since no category is significantly prevalent in our data.
3.3 Number of coding categories
The number of coding categories has an influ-ence on the reliability measures magnitude: the larger the number of categories is, the less the coders have a chance to agree. Even if this de-crease should concern chance agreement too, lower reliability estimations are observed with high numbers of categories (Brenner and Kliebsch, 1996). This paper investigates this in-fluence by comparing reliability values obtained with a 3-categories and a 5-categories coding scheme applied on the same data (see § 5.1). 3.4 Interpreting the magnitude of
meas-ures in terms of effective reliability One last question concerns the interpretation of the reliability measures magnitude. It has been particularly investigated with Cohen’s κ. Carletta (1996) advocates 0.8 to be a threshold of good reliability, while a value between 0.67 and 0.8 is considered sufficient to allow tentative conclu-sion to be drawn. On the opposite, Krippendorff (2004b) claims that this 0.67 cutoff is a pretty low standard while Neuendorf (2002) supports an even more restrictive interpretation.
Thus, the definition of relevant levels of reli-ability remains an open problem. We will see how our experiments should draw a methodo-logical framework to answer this crucial issue.
4
Experiments: methodology
4.1 Introduction
We have conducted experiments on three dif-ferent annotation tasks in order to guarantee an appreciable generality of our findings. The first two experiments correspond to an ordinal anno-tation. They concern the affective dimension of language (emotion and opinion annotation). They have been conducted with naïve coders to pre-serve the spontaneity of judgment which is searched for in affective computing.
The third experiment concerns coreference annotation. It is a nominal annotation that has
been designed to be used as a comparison with the previous ordinal annotations tasks.
The corresponding annotated corpora are available (TestAccord database) on the french Parole_Publique1 corpus repository under a CC-BY-SA Creative Commons licence.
4.2 Emotion corpus
Emotion annotation consists in adding emo-tional information to written messages or speech transcripts. There is no real consensus about how an emotion has to be described in an annotation scheme. Two main approaches can be found in the literature. On the one hand, emotions are coded by affective modalities (Scherer, 2005), among which sadness, disgust, enjoyment, fear, surprise and anger are the most usual (Ekman, 1999; Cowie and Cornelius, 2003). On the other hand, an ordinal classification in a multidimen-sional space is considered. Several dimensions have been proposed among which three are pre-vailing (Russell, 1980): valence, intensity and activation. Activation distinguishes passive from active emotional states. Valence describes whether the emotional state conveyed by the text is positive, negative or neutral. Lastly, intensity describes the level of emotion conveyed.
Whatever the approach, low to moderate inter-annotator agreements are observed, what ex-plains that reference annotation must be achieved through a majority vote with a significant num-ber of coders (Schuller and al. 2009). Inter-coder agreement is particularly low when emotions are coded into modalities (Devillers and al., 2005; Callejas and Lopez-Cozar, 2008). This is why this study focuses on an ordinal annotation.
Our works on emotion detection (Le Tallec and al., 2011) deal with a specific context: affec-tive robotics. We consider an affecaffec-tive multimo-dal interaction between hospitalized children and a companion robot. Consequently, this experi-ment will concern a child-dedicated corpus. Al-though many works already focused on child language (MacWhinney, 2000), no emotional child corpus is currently available in French, our studied language. We have decided to create a little corpus (230 sentences) of fairy tales, which are regularly used in works related to child affect analysis (Alm and al., 2005; Volkova and al., 2010). The selected texts come from modern fairy tales (Vassallo, 2004; Vanderheyden, 1995) which present the interest of being quite confi-dential. This guarantees that the coders discover
1
the text during the annotation. We asked 25 sub-jects to characterize the emotional value con-veyed by every sentence through a 5-items scale of values, ranging from very negative to very positive.
As shown on Table 1, this affective scale en-compasses valence and intensity dimensions. It enables to compare without methodological bias an annotation with 3 coding categories (valence: negative, positive, neutral) and the original 5-categories (valence+intensity) annotation.
A preliminary experiment showed us that children meet difficulties to handle a 5-values emotional scale. This is why the annotation was conducted on the fairy tales corpus with adults (11 men/14 women; average age: 31.6 years). All the coders have a superior level of education (at least, high-school diploma), they did not know each other and worked separately during the an-notation task. Only four of them had a prior ex-perience in corpus annotation.
Value Meaning Valence / Polarity
Intensity / Strength -2 very negative negative strong -1 moderately
negative
negative moderate 0 no emotion neutral none 1 moderately
positive
positive moderate 2 very positive positive strong Table 1. emotion or opinion annotation schemes
The coders were not trained but were given precise annotation guidelines providing some explanations and examples on the emotional val-ues they had to use. They achieved the annota-tion once, without any restricannota-tion on time. They had to rely on their own judgment, without con-sidering any additional information. Sentences were given in a random order to investigate an out-of-context perception of emotion. We con-ducted a second experiment where the order of the sentences followed the original fairy tale, in order to study the influence of the discourse con-text. The criterion of data significance – at least five chance agreements per category – proposed by (Krippendorff, 2004) is greatly satisfied for the valence annotation (3 categories). It is ap-proached on the complete annotation where we can assure 4 chance agreements per category.
4.3 Opinion corpus
The second experiment concerns opinion an-notation. Emotion detection can be related to a
certain extent, with opinion mining (or sentiment analysis), whose aim is to detect the attitude of people in the texts they produce. A basic task in opinion mining consists in classifying the polar-ity of a given text, which should be either a sen-tence (Wilson and al., 2005), a speech turn or a complete document (Turney, 2002). Polarity plays the same role as valence does for affect analysis: it describes whether the expressed judgment is positive, negative, or neutral. One should also characterize the sentiment strength (Thelwall and al., 2010). This feature can be re-lated to the notion of intensity used in emotional annotation. Both polarity and sentiment strength are considered in our annotation task.
This experiment has been carried out on a cor-pus of film reviews. The reviews were relatively short texts written by ordinary people on dedi-cated French websites (www.senscritique.com and www.allocine.fr). They concerned the same French movie. The corpus contains 183 sen-tences. Its annotation was conducted by the 25 previous subjects. The methodology is identical to the emotion annotation task. The subjects were asked to qualify the opinion that was conveyed by every sentence of the reviews by means of the same scale of values (Table 1). This scale encompasses this time the polarity and sentiment strength dimensions. Once again, the sentences were given in a random order and contextual or-der respectively. The criterion of data signifi-cance is satisfied here too.
On both annotations, experiments with the random or the contextual order give similar re-sults. Results from the contextual annotation will be given only when necessary.
4.4 Coreference corpus
The last experiment concerns coreference an-notation. We have developed an annotated cor-pus (ANCOR) which clusters various types of spontaneous and conversational speech. With a total of 488,000 lexical units, it is one of the largest coreference corpora dedicated to spoken language (Muzerelle and al. 2014). Its annotation was split into three successive phases:
• Entity mentions marking, • Referential relations marking, • Referential relations characterization The experiment described in this paper con-cerns the characterization of the referential rela-tions. This nominal annotation consists in classi-fying relations among five different types:
• Direct coreference (DIR) – Coreferent mentions are NPs with same lexical heads.
• Indirect coreference (IND) – These
men-tions are NPs with distinct lexical heads.
• Pronominal anaphora (PRO) – The
subse-quent coreferent mention is a pronoun.
• Bridging anaphora (BRI) – The
subse-quent mention does not refer to its antece-dent but depends on it for its referential in-terpretation (example: meronymy).
• Bridging pronominal anaphora (BPA) –
Bridging anaphora where the subsequent mention is a pronoun. This type empha-sizes metonymies (example: Avoid Cen-tral Hostel… they are unpleasant)
The subjects (3 men / 6 women) were adult people (average age: 41.2 years) with a high pro-ficiency in linguistics (researchers in NLP or cor-pus linguistics). They know each other but worked separately during the annotation, without any restriction on time. They are considered as experts since they participated to the definition of the annotation guide. The study was con-ducted on an extract of 10 dialogues, represent-ing 384 relations. Krippendorff’s (2004) criterion of significance is therefore satisfied here too. 4.5 Reliability measures
The experiments have been conducted with four chance-balanced reliability measures2 :
• Multi-κ : multiple coders/binary distance
Cohen’s κ (Davies and Fleiss, 1982),
• Multi-π : multiple coders/binary distance
Scott’s π (Fleiss, 1971),
• αb : Krippendorff’s α with binary distance,
• α : standard Krippendorff’s α with a 1-dimension Euclidian distance.
The use of Euclidian distance is unfounded on coreference which handles a nominal annotation. Thus, α will not be computed on this last corpus.
2
Experiments were also conducted with Cronbach’αc (Cronbach, 1951). This metrics is based on a correlation measure. Krippendorff (2009) considers soundly that corre-lation coefficients are inappropriate to estimate reliability. Our results show that αc is systematically outperformed by the other metrics. In particular, it is highly dependent to coder bias. For instance we observed a relative standard deviation of αc measures higher than 22% when measuring the influence of coders set permuation (§ 5.3, table 5). This observation discards Cronbach’αc as a trustworthy measure.
5
Results
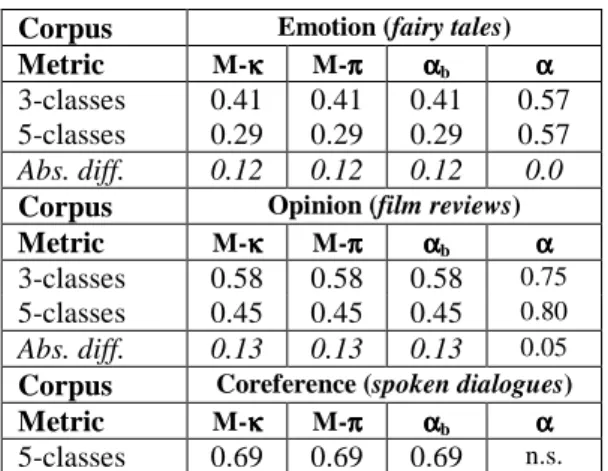
5.1 Influence of the number of categories Our affective coding scheme enables a direct comparison between a 3-classes (valence or po-larity) and a 5-classes annotation. The 3-classes scheme clusters the coding categories with the same valence or polarity. For instance {-2,-1} negative values are clustered in the same cate-gory which receive the index 1. For the computa-tion of the weighted α, the distance between negative (-1) and positive (1) classes will be equal to 2. Table 2 presents the reliability meas-ures observed on all of the corpora.
Corpus Emotion (fairy tales) Metric M-κκκκ M-ππππ ααααb ααα α
3-classes 0.41 0.41 0.41 0.57 5-classes 0.29 0.29 0.29 0.57
Abs. diff. 0.12 0.12 0.12 0.0
Corpus Opinion (film reviews) Metric M-κκκκ M-ππππ ααααb ααα α
3-classes 0.58 0.58 0.58 0.75
5-classes 0.45 0.45 0.45 0.80 Abs. diff. 0.13 0.13 0.13 0.05
Corpus Coreference (spoken dialogues) Metric M-κκκκ M-ππππ ααααb ααα α
5-classes 0.69 0.69 0.69 n.s.
Table 2. Reliability measures: emotion and opinion random annotation as well as coreference annotation
Several general conclusions can be drawn from these figures. At first, low inter-coder agreements are observed on affective annotation, which is coherent with many other studies (Dev-illers and al., 2005; Callejas and Lopez-Cozar, 2008). Non-weighted metrics (multi-κ,multi-π, αb) range from 0.29 to 0.58, depending on the
annotation scheme. This confirms that these an-notation tasks are prone to high subjectivity. Higher levels of agreement may have been ob-tained if the annotators were trained with super-vision. As said before, this would have reduced the spontaneity of judgment. Furthermore, a comprehensive meta-analysis (Bayerl and Paul, 2011) has shown that no difference may be found on data reliability between experts and novices.
The reliability measures given by the weighted version of Krippendorff’s α on the two affective tasks are significantly higher: α values range from 0.57 to 0.80, which suggests a rather suffi-cient reliability. These results are not an artifact. They come from better disagreement estimation. For instance, the difference between a positive
and a negative annotation is more serious than between the positive and the neutral emotion, what a weighted metrics accounts for.
Satisfactory measures are found on the con-trary on the coreference task (0.69 with every metric). This result was expected, since a large part of the annotation decisions are based on ob-jective (syntactic or semantic) considerations.
Whatever the experiment you consider,
multi-κ, multi-π and αb coefficients present very close
values (identical until the 3rd decimal). A similar observation was made by (Arstein and Poesio, 2005) with 18 coders. This validates the theoreti-cal hypothesis on the convergence of individual-distribution and single-individual-distribution measures when the number of coders increases. Our ex-periments show that annotator bias is moderate with 25 coders when inter-coders agreement is rather low (affective tasks), while 9 coders are enough to guarantee a low annotator bias when data reliability is higher (coreference task).
Lastly, the comparison between the two anno-tation schemes (3 or 5 classes) in affective tasks provides some indications on the influence of the number of coding categories on reliability esti-mation3. As expected (see § 3.3), multi-κ, multi-π and αb values increase significantly when the number of classes decreases.
On the contrary, weighted α is significantly less affected by the increase of the number of categories. The α value remains unchanged on the emotional corpus and its variation restricts to 0.05 on the opinion task. It seems that the use of a Euclidian distance counterbalances the higher risk of disagreement when the number of catego-ries grows. Such an independence of the number of coding categories is an interesting property for a reliability measure, which has never been re-ported as far as we know.
Metric M-κκκκ M-ππππ ααααb αααα
3-classes 0.61 0.61 0.61 0.78 5-classes 0.49 0.49 0.49 0.83
Abs. diff. 0.12 0.12 0.12 0.05
Table 3. Reliability measures with 3 and 5 annotation classes: opinion contextual annotation (film reviews).
Finally, Table 3 presents as an illustration the reliabilities measures we obtained with the con-textual annotation of the opinion corpus. These
3
The 3-classes coding scheme is a semantic reduction of the 5-classes one. One should wonder whether the same results can be observed with unrelated categories. (Chu-Ren and
al., 2002) shows indeed that expanding PoS tags with
sub-categories does not increase categorical ambiguity.
results are fully coherent with the previous ones. One should note in addition that reliability meas-ures are significantly higher on these contextual annotations: the context of discourse helps the coders to qualify opinions more objectively. 5.2 Influence of prevalence
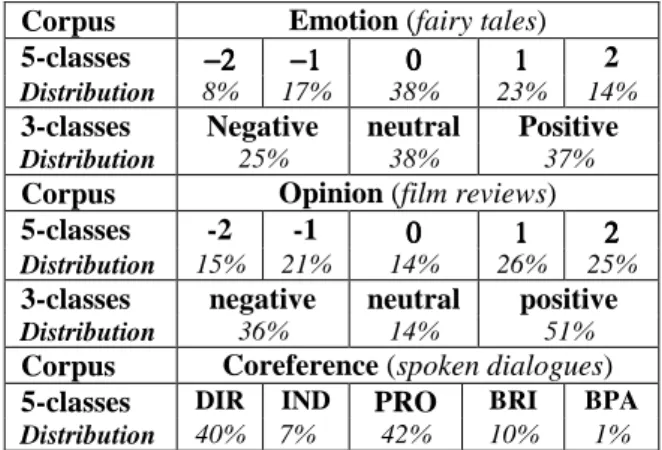
Table 4 presents the distribution of the annota-tions on the three corpora. (Devillers and al., 2005; Callejas and Lopez-Cozar, 2008) reported that more than 80% of the speech turns are clas-sified as neutral in their emotional corpora. This prevalence was not found on our affective cor-pora. Positive annotations are nearly as frequent as the neutral ones on the emotion task. This ob-servation is due to the deliberate emotional na-ture of fairy tales. Likewise, the neutral opinion is minority among the film reviews, which aim frequently at expressing pronounced judgments. Positive opinions are slightly majority on the opinion corpus but this prevalence is limited: it represents an increase of only 50% of frequency, by comparison with a uniform distribution.
Corpus Emotion (fairy tales) 5-classes −2−2−2−2 −1−1−1−1 0000 1111 2
Distribution 8% 17% 38% 23% 14%
3-classes Negative neutral Positive
Distribution 25% 38% 37%
Corpus Opinion (film reviews) 5-classes -2 -1 0000 1111 2222
Distribution 15% 21% 14% 26% 25%
3-classes negative neutral positive
Distribution 36% 14% 51%
Corpus Coreference (spoken dialogues) 5-classes DIR IND PRO BRI BPA
Distribution 40% 7% 42% 10% 1%
Table 4. Distribution of the coding categories
In the coreference corpus, two classes are highly dominant, but they are not prevalent alone. There is no indication in the literature that the prevalence of two balanced categories has a bias on data reliability measure. For all these rea-sons, we didn't investigate the influence of preva-lence. Besides, relevant works are questioning the importance of the influence of prevalence on inter-coders agreement measures (Vach, 2005). 5.3 Influence of coders set permutation “a coefficient for assessing the reliability of data must treat coders as interchangeable (Krippen-dorff, 2004b). We have studied the stability of reliability measures computed on any combina-tion of 10 coders (among 25) on the affective corpora, and 4 coders (among 9) on the
corefer-ence corpus. The influcorefer-ence of permutation is quantified by a measure of relative standard de-viation (e.g. related to the average value) among the sets of coders (Table 5).
Corpus Emotion (fairy tales) Metric M-κκκκ M-ππππ ααααb αααα
3-classes 7.4% 7.7% 7.6% 6.2%
5-classes 9.0% 9.1% 9.1% 6.1%
Corpus Opinion (film reviews) 3-classes 3.4% 3.3% 3.3% 2.6%
5-classes 4.0% 4.0% 4.1% 1.7%
Corpus Coreference (spoken dialogues) 5-classes 4.6% 4.6% 4.6% n.c.
Table 5. Relative standard deviation of measures on any independent sets of coders
Binary metrics do not differ on this criterion:
multi-κ, multi-π and αb present very similar
re-sults. On the opposite, the benefit of a Euclidian distance of agreement is clear: α is significantly less influenced by coders set permutation.
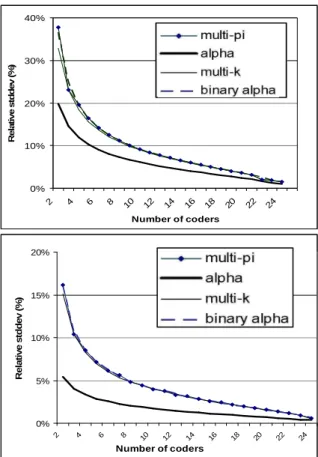
5.4 Influence of the number of coders A good way to limit annotator bias is to enroll an important number of annotators. This need is unfortunately contradictory with a restriction of annotation costs. The estimation of data reliabil-ity must thereby remain trustworthy with a minimal number of coders. As far as we know, there is no clear indication in the literature about the definition of such a minimal size.
We have conducted an experiment which in-vestigates the influence of the number of coders on the relevancy of reliability estimation. Con-sidering N annotations (N=25 for affective anno-tation and N=9 for coreference annoanno-tation), we compute all the possible reliability values with any subsets of S coders, S varying from 2 to N. As an estimation of the trustworthiness of the coefficients, the relative standard deviation of the reliability values is computed for every size S (Figures 1 to 3). The influence of the number of coders is obvious: detrimental standard devia-tions are found with small coders set sizes. This finding concerns above all multi-κ, multi-π and αb, which present very close behaviors on all
annotations. One the opposite, the weighted
α coefficient converges significantly faster to a trustworthy reliability measure The comparison between αb and α is enlightening. It shows again that the main benefit of Krippendorff’s proposal results from its accounting for a weighted dis-tance in a multi-coders ordinal annotation.
0% 10% 20% 30% 40% 2 4 6 8 10 12 14 16 18 20 22 24 Number of coders R e la ti v e s td d e v ( % ) multi-pi alpha multi-k alpha binary 0% 5% 10% 15% 20% 2 4 6 8 10 12 14 16 18 20 22 24 Number of coders R e la ti v e s td d e v ( % ) multi-pi alpha multi-k binary alpha
Figure 1. Relative standard deviation on any set of coders of a given size. 5-classes coding scheme.
Emo-tion (top) and opinion (bottom) random annotaEmo-tion.
0% 10% 20% 30% 2 4 6 8 10 12 14 16 18 20 22 24 Number of coders R e la ti v e s td d e v ( % ) multi-pi alpha multi-k binary alpha 0% 5% 10% 15% 2 4 6 8 10 12 14 16 18 20 22 24 Number of coders R e la ti v e s td d e v ( % ) multi-pi alpha multi-k alpha binary
Figure 2. Relative standard deviation on any set of coders of a given size. 3-classes coding scheme.
0% 5% 10% 2 3 4 5 6 7 8 Number of coders R e la ti v e s td d e v ( % ) multi-pi multi-k binary alpha
Figure 3. Relative std deviation of measures on any sets of coders for a given coders set size: coreference
6
Conclusion and perspectives
Our experiments were conducted on various an-notation tasks which assure a certain representa-tiveness of our conclusions:
• Cohen’s κ, Krippendorff‘s α and Scott’s π provide close values when they use the same measure of disagreement.
• A convergence of these measures has been noticed in the literature when the number of coders is high. We observed it even on very restricted sets of annotators.
• The use of a weighted measure (Euclidian distance) has several benefits on ordinal data. It restricts the influence on reliability measure of both the number of categories and the number of coders. Unfortunately, Cohen’s κ statistics cannot consider a weighted distance in a multi-coders framework contrary to Krippendorff’s α. • There is no benefit of using Krippendorff‘s
α on nominal data, since a binary distance is mandatory on this situation.
To conclude, the main interest of Krippen-dorff’s α is thus its ability to integrate any kind of distance. In light of our results, the weighted version of this coefficient must be preferred every time an ordinal annotation with multiple coders is considered.
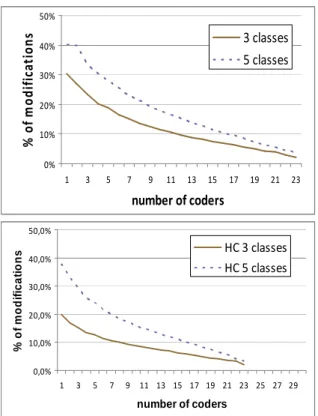
Our experiments leave open an essential ques-tion: the objective definition of trustworthy thresholds of reliability. We propose to investi-gate this question in terms of expected modifica-tions of the reference annotation. A majority vote is generally used as a gold standard to create this reference with multiple coders. As a preliminary experiment, we have compared our reference affective annotations (25 coders) with those ob-tained on any other included set of coders.
0% 10% 20% 30% 40% 50% 1 3 5 7 9 11 13 15 17 19 21 23 number of coders % o f m o d if ic a t io n s 3 classes 5 classes 0,0% 10,0% 20,0% 30,0% 40,0% 50,0% 1 3 5 7 9 11 13 15 17 19 21 23 25 27 29 number of coders % o f m o d if ic a ti o n s HC 3 classes HC 5 classes
Figure 4. Average modifications of the reference ac-cording to the number of coders. Emotion annotation
(top) and opinion annotation (bottom)
Figure 4 presents the average percentage of modifications of the reference according to the number of coders. We wonder to what extent these curves can be related to reliability ures. It seems indeed that the higher the meas-ures are, the lower the modifications are too. For instance, almost all of the coefficients present higher or equal reliability values with 3 coding categories (Tables 2 & 3), which corresponds to lower levels of modifications on Figure 3. Like-wise, reliability measures are higher on the opin-ion annotatopin-ion, where we observe lower modifi-cations of the reference.
As a result, we expect results like those pre-sented on figure 4 to enable a direct interpreta-tion of reliability measures. For instance, with a
multi-κ values of 0.41, or a αb value of 0.57
(Ta-ble 2, 3-classes emotion annotation), one should expect around 8% of errors on our reference an-notation if 10 coders are considered. We plan to extend these experiments with simultated syn-thetic data to characterize precisely the relations between absolute reliability measures and ex-pected confidence in the reference annotation. We expect to obtain with simulated annotation a sufficient variety of agreement to establish sound recommendations on data reliability thresholds. We intend to modify randomly human annota-tions to conduct this simulation.
References
Cecilia Alm, Dan Roth, Richard Sproat. 2005. Emo-tions from Text: Machine Learning for Text-based Emotion Prediction, In Proc. HLT&EMNLP’2005. Vancouver, Canada. 579-586
Ron Arstein and Masimo Poesio. 2008. Inter-Coder Agreement for Computational Linguistics.
Compu-tational Linguistics. 34(4):555-596.
Ron Artstein and Massimo Poesio. 2005. Bias de-creases in proportion to the number of annotators. In Proceedings FG-MoL’2005, 141:150, Edin-burgh, UK.
Petra Saskia Bayerl and Karsten Ingmar Paul, 2011. What Determines Inter-Coder Agreement in Man-ual Annotations? A Meta-Analytic Investigation .
Computational Linguistics. 37(4), 699:725.
Paul Brennan and Alan Silman. 1992. Statistical methods for assessing observer variability in clini-cal measures. BMJ, 304:1491-1494.
Ted Byrt, Janet Bishop, John Carlin. 1993. Bias, prevalence and kappa. Journal of Clinical
Epide-miology, 46:423-429.
Hermann Brenner and Ulrike Kliebsch. 1996. Depen-dance of weighted kappa coefficients on the num-ber of categories. Epidemiology. 7:199-202. Zoraida Callejas and Ramon Lopez-Cozar. 2008.
In-fluence of contextual information in emotion anno-tation for spoken dialogue systems, Speech
Com-munication, 50:416-433
Jean Carletta. 1996. Assessing agreement on classifi-cation tasks: the Kappa statistic. Computational
Linguistics, 22(2):249-254
Jacob Cohen. 1960. A coefficient of agreement for nominal scales. Educational and Psychological
Measurement, 20:37-46.
Jacob Cohen. 1968. Weighted kappa: nominal scale agreement with provision for scaled disagreement or partial credit. Psychol. Bulletin, 70(4):213–220 Roddy Cowie and Randolph Cornelius. 2003.
De-scribing the emotional states that are expressed in speech. Speech Communication. 40 :5-32.
Lee J. Cronbach. 1951. Coefficient alpha and the in-ternal structure of tests. Psychometrica. 16:297-334 Laurence Devillers, Laurence Vidrascu, Lori Lamel. 2005. Emotion detection in real-life spoken dialogs recorded in call center. Journal of Neural
Net-works, 18(4):407-422.
Paul Ekman. 1999. Patterns of emotions: New
Analy-sis of Anxiety and Emotion. Plenum Press,
New-York, NY.
Barbara Di Eugenio and Michael Glass. 2004. The kappa statistic: A second look. Computational
Lin-guistics, 30(1):95–101
Mark Davies and Joseph Fleiss. 1982. Measuring agreement for multinomial data. Biometrics, 38(4):1047-1051.
Alvan Feinstein and Domenic Cicchetti. 1990. High agreement but low Kappa : the problem of two paradoxes. J. of Clinical Epidemiology, 43:543-549 Joseph L. Fleiss. 1971 Measuring nominal scale agreement among many raters. Psychological
Bul-letin, 76(5): 378–382
Andrew Hayes. 2007. Answering the call for a stan-dard reliability measure for coding data.
Communi-cation Methods and Measures 1, 1:77-89.
Klaus Krippendorff. 2004. Content Analysis: an
In-troduction to its Methodology. Chapter 11. Sage:
Thousand Oaks, CA.
Klaus Krippendorff. 2004b. Reliability in Content Analysis: Some Common Misconceptions and Recommendations. Human Communication
Re-search, 30(3): 411-433, 2004
Klaus Krippendorff. 2008. Testing the reliability of content analysis data: what is involved and why. In Klaus Krippendorff, Mark Angela Bloch (Eds) The
content analysis reader. Sage Publications.
Thou-sand Oaks, CA.
Klaus Krippendorff. 2009. Testing the reliability of
content analysis data: what is involved and why. In
Klaus Krippendorff , Mary Angela Bock. The
Con-tent Analysis Reader. Sage: Thousand Oaks, CA
Marc Le Tallec, Jeanne Villaneau, Jean-Yves An-toine, Dominique Duhaut. 2011 Affective Interac-tion with a Companion Robot for vulnerable Chil-dren: a Linguistically based Model for Emotion Detection. In Proc. Language Technology
Confer-ence 2011, Poznan, Poland, 445-450.
Brian MacWhinney. 2000. The CHILDES project :
Tools for analyzing talk. 3rd edition. Lawrence Erl-baum associates Mahwah, NJ.
Judith Muzerelle, Anaïs Lefeuvre, Emmanuel Schang, Jean-Yves Antoine, Aurore Pelletier, Denis Mau-rel, Iris Eshkol, Jeanne Villaneau. 2014. AN-COR_Centre, a large free spoken French corefer-ence corpus: description of the resource and reli-ability measures. In Proc. LREC’2014 (submitted). Kimberly Neuendorf. 2002. The Content Analysis
Guidebook. Sage Publications, Thousand Oaks, CA
James Russell. 1980. A Circumplex Model of Affect,
J. Personality and Social Psy., 39(6): 1161-1178.
Klaus Scherer. 2005. What are emotions? and how can they be measured? Social Science Information, 44 (4):694–729.
Björn Schuller, Stefan Steidl, Anto Batliner. 2009. The Interspeech'2009 emotion challenge. In
Pro-ceedings Interspeech'2009, Brighton, UK. 312:315.
William Scott. 1955. Reliability of content analysis: the case of nominal scale coding. Public Opinions
Quaterly, 19:321-325.
Julius Sim and Chris Wright. 2005. The Kappa Statis-tic in Reliability Studies: Use, Interpretation, and Sample Size Requirements. Physical Therapy, 85(3):257:268.
Mike Thelwall, Kevan Buckley, Georgios Paltoglou, Di Cai, Arvid Kappas. 2010. Sentiment strength detection in short informal text. Journal of the
American Society for Information Science and Technology, 61 (12): 2544–2558.
Peter Turney. 2002. Thumbs up or thumbs down? Semantic orientation applied to unsupervised clas-sification of reviews, In Proceedings ACL’02, Philadelphia, Pennsylvania, 417-424.
Werner Vach, 2005. The dependence of Cohen’s kappa on the prevalence does not matter, Journal
of Clinical Epidemiology, 58, 655-661).
Rose-Marie Vassallo. 2004. Comment le Grand Nord
découvrit l’été. Flammarion, Paris, France.
Kees Vanderheyden. 1995. Le Noel des animaux de la
montagne. Fairy tale available at the URL :
http://www.momes.net/histoiresillustrees/contesde montagne/noelanimaux.html
Ekaterina Volkova, Betty Mohler, Detmar Meurers, Dale Gerdemann and Heinrich Bülthoff. 2010. Emotional perception of fairy tales: achieving agreement in emotion annotation of text, In
Pro-ceedings NAACL HLT 2010. Los Angeles, CA.
Theresa Wilson, Janyce Wiebe, Paul Hoffmann. 2005. Recognizing contextual polarity in phrase-level sentiment analysis. In Proc. of HLT-EMNLP’2005. 347-354.