Publisher’s version / Version de l'éditeur:
Chemical Communications, 46, 48, pp. 9164-9166, 2010-12-28
READ THESE TERMS AND CONDITIONS CAREFULLY BEFORE USING THIS WEBSITE. https://nrc-publications.canada.ca/eng/copyright
Vous avez des questions? Nous pouvons vous aider. Pour communiquer directement avec un auteur, consultez la
première page de la revue dans laquelle son article a été publié afin de trouver ses coordonnées. Si vous n’arrivez pas à les repérer, communiquez avec nous à [email protected].
Questions? Contact the NRC Publications Archive team at
[email protected]. If you wish to email the authors directly, please see the first page of the publication for their contact information.
NRC Publications Archive
Archives des publications du CNRC
This publication could be one of several versions: author’s original, accepted manuscript or the publisher’s version. / La version de cette publication peut être l’une des suivantes : la version prépublication de l’auteur, la version acceptée du manuscrit ou la version de l’éditeur.
For the publisher’s version, please access the DOI link below./ Pour consulter la version de l’éditeur, utilisez le lien DOI ci-dessous.
https://doi.org/10.1039/C0CC03297B
Access and use of this website and the material on it are subject to the Terms and Conditions set forth at
Structure and dynamics of ammonium borohydride
Flacau, Roxana; Ratcliffe, Christopher I.; Desgreniers, Serge; Yao, Yansun;
Klug, Dennis D.; Pallister, Peter; Moudrakovski, Igor L.; Ripmeester, John A.
https://publications-cnrc.canada.ca/fra/droits
L’accès à ce site Web et l’utilisation de son contenu sont assujettis aux conditions présentées dans le site LISEZ CES CONDITIONS ATTENTIVEMENT AVANT D’UTILISER CE SITE WEB.
NRC Publications Record / Notice d'Archives des publications de CNRC:
https://nrc-publications.canada.ca/eng/view/object/?id=1b5fcfbc-cca0-4f6e-8aba-8277b4c9185c https://publications-cnrc.canada.ca/fra/voir/objet/?id=1b5fcfbc-cca0-4f6e-8aba-8277b4c9185c
Chem. Commun., 2010, 46, 9164-9166 DOI:10.1039/C0CC03297B (Communication)
Structure and dynamics of ammonium borohydride
†‡
Roxana Flacaua, Christopher I. Ratcliffe*a, Serge Desgreniersb, Yansun Yaoa, Dennis D. Kluga, Peter Pallistera, Igor L.
Moudrakovskia and John A. Ripmeestera
aSteacie Institute for Molecular Sciences, National Research Council of Canada, Ottawa, Ontario, Canada K1A 0R6. E-mail:
[email protected]; Fax: +1 613-998-7833; Tel: +1 613-991-1240
bLaboratoire de physique des solides denses, Department of Physics, University of Ottawa, Ottawa, Ontario, Canada K1N 6N5
Received 16th August 2010, Accepted 6th October 2010 First published on the web 29th October 2010
Synchrotron powder X-ray diffraction, ab initio molecular dynamics calculations and solid state 1H and 2H NMR are used to refine the structure of crystalline NH4BH4 including H atoms. Rapid reorientations of both ions mean that on average half-hydrogens occupy the corners of a cube around B or N.
Hydrogen is one of the most important candidates to eventually replace gasoline as the fuel of choice, and substantial scientific effort is being devoted to find suitable materials for hydrogen storage.1 For all such materials a good knowledge of their structural properties is necessary in order to understand decomposition dynamics and products. Owing to their high gravimetric and
volumetric hydrogen density, alkali metal borohydrides have attracted considerable attention. Extensive experimental and theoretical structural studies have been carried out in an effort to understand and tailor their hydrogen desorption and adsorption dynamics.2–5 Several research directions are being explored, but there is no definite solution to the high temperature hydrogen desorption and irreversibility problems associated with these compounds. Ammonium borohydride, NH4BH4, has the highest gravimetric hydrogen density, 24.523 wt%, yet although it was first synthesized more than 50 years ago,6 its structure and properties are only now being fully explored. The reported instability above −40 °C perhaps put this potential H-storage material out of the research focus. An excellent preliminary study was recently published.7 Here we report a detailed study of the structure and dynamics of NH4BH4, which does indeed decompose at room temperature, but slowly enough to allow its investigation by various techniques. Using Raman spectroscopy, solid state NMR, powder X-ray diffraction (PXRD) and theoretical methods we add more details to the proposed structure.7 Synchrotron radiation PXRD data were analyzed using the Rietveld method in conjunction with the Maximum Entropy Method (MEM)8,9 to determine the most probable charge density distribution in the unit cell and hence to locate H atoms, which contribute 40% of the electron density. MEM has been used successfully before to help locate some atoms in complex compounds.10
NH4BH4 was synthesized from NH4F and NaBH4 (Sigma-Aldrich) in liquid ammonia, using Parry et al.'s6 procedure. As we report elsewhere, we found the initial reaction product to be NH3 solvates, which decompose by 250 K into NH4BH4 and NH3. The resulting NH4BH4 powder could be stored indefinitely at liquid nitrogen temperature. The presence of NH4+ and BH
4− ions was confirmed by Raman spectroscopy. At 77 K, the main peak measured in the B–H stretching vibration region is the symmetric stretching mode ν1at 2296 cm−1, while two intense modes (3119 and 3181 cm−1) appear in the N–H stretching vibration region. Our spectra are in very good agreement with those reported recently.7
Preliminary PXRD patterns collected on a Bruker AXS-D8 Advance diffractometer were indexed to a cubic fcc unit cell with a = 6.98233 Å (295 K). No structural phase transitions were observed down to −120 °C. Since the quality of these data was not suitable for performing Rietveld analysis, however, higher quality data were collected at room temperature using synchrotron radiation (λ = 0.516601 Å) at the Canadian Light Source (CLS).§ Decomposition of the sample was prevented by pressurizing it in
a diamond anvil cell (DAC) at 0.5 Gpa.§
Rietveld analysis is imperative to confirm the proposed space group7 and determine atom positions. Until recently H atoms were considered “invisible” to PXRD due to a very low scattering power, but with synchrotron radiation and image plate detectors it is now sometimes feasible to determine H atom positions, for example in several light metal borohydrides.16–18 The diffraction pattern of NH4BH4 at 0.5 GPa in the DAC showed the same cubic phase (with a = 6.81451 Å) as at one atmosphere, plus three lines from the stainless steel gasket (a bcc phase). With no a priori knowledge about the location of the H atoms, the Rietveld analysis was started including only B and N atoms. Their positions in the unit cell were chosen based on the well-established Fm
m structures of Na, K, and Rb borohydrides (4a and 4b for nitrogen and boron atoms, respectively). The R factors for this
Rietveld fit, Rwp = 1.58% and RI = 37.96%, are poor and reflect the fact that the H atoms were excluded (refinement plot in Fig. S1, ESI‡).
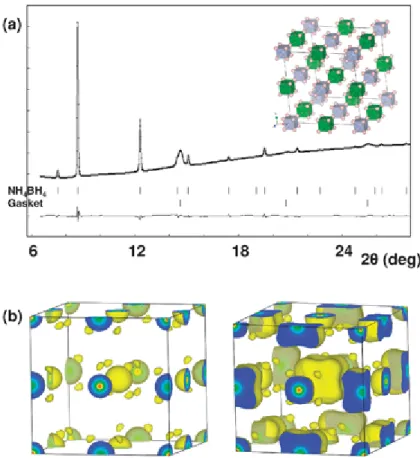
Since 32 out of a total of 80 electrons present in the NH4BH4 unit cell are hydrogen electrons, the contribution of H atoms to the total scattering power of this H-rich material is significant. Consequently, MEM was used to determine probable locations for the electron density associated with the H atoms. Fig. 1b shows the 3D electron density distribution as derived by MEM starting with a uniform density distribution obtained by dividing the total number of electrons in the unit cell by the volume of the unit cell, and using the structure factors extracted using the Rietveld method as constraints. In addition to the spherical charge distributions corresponding to the boron and nitrogen atoms, the density map reveals extra charge density features.
Eight such features surround each of the boron and nitrogen atoms at distances of about 1 Å, suggesting that they correspond to the hydrogen atoms in the unit cell. Based on this observation we included hydrogen atoms at the 32f crystallographic sites, with half occupancies, and refined their coordinates during the Rietveld fit. This led to a significant improvement of the fit between the observed and calculated patterns (Fig. 1). The quality of the fit (Rwp = 0.66%, Rp = 0.40%, RI = 4.91%, and RF = 3.17%) attests to
Fig. 1 (a) Final Rietveld fit. (b) MEM-calculated electron density distribution maps, isosurface levels 0.5 e Å−3 (left) and 0.35 e Å−3 (right). B is at the centre of the cell with N in the centre of the faces.
the correctness of the cubic Fm m model. The resulting H atom positions (x,x,x) were x(H1) = 0.411(2) and x(H2) = 0.916(8), with B–H and N–H distances of 1.04 Å and 0.98 Å, respectively. These values are about 15% shorter than those reported in different neutron diffraction studies of BH4− and NH4+ ions,19,20 typical of the differences usually found between these two techniques where X-ray diffraction probes the electronic cloud, while neutron diffraction determines the average nuclear positions. Another factor to consider is that the accessible range of d-spacing was reduced to about 1 Å because the sample was confined in a DAC, which can affect the accuracy of the parameters refined.
To investigate the structural model proposed from the MEM refinement, Car–Parrinello molecular dynamics (CPMD)
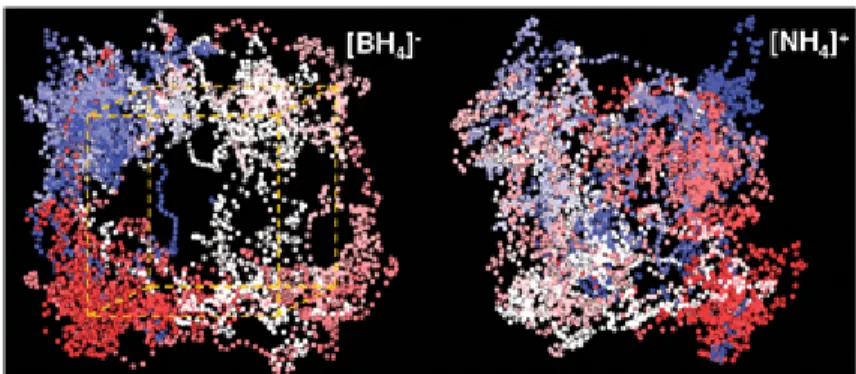
calculations were employed to study the lattice dynamics.§ The theoretical model was started from a rocksalt structure for B and N using the experimental lattice constant at 0.5 GPa. Four H atoms were then placed in the 32f symmetry sites with a tetrahedral arrangement around each N and B atom. After equilibration at 300 K, the CPMD trajectories were collected for a period of 14.5 ps, Fig. 2. The results show great reorientational mobility for both ions in NH4BH4, as suggested in a previous computational study.7 Furthermore the trajectories show that even on this very short timescale an H atom on either NH4+or BH
4− is able to visit any of the eight corners of a cube transcribed around the atom to which it is attached, thus supporting the MEM model. The trajectory for NH4+ appears to show both site-to-site jumps and rotational diffusion whereas BH
4− shows largely jumps, so that overall NH4+ reorients more freely than BH4−. This difference in dynamics is also evident in the MEM analysis, where the smaller contours for the H of NH4+ suggest a greater smearing out of their electron density. Analysis also shows that the B–H and N–H bonds vibrate over 1.1–1.36 Å and 0.95–1.15 Å, with average distances of 1.23 and 1.05 Å, respectively (Fig. S2, ESI‡), thus reinforcing the fact that the X-ray diffraction underestimates the B–H and N–H distances.
Experimental information on the dynamics of the ions is provided by solid state 1H and 2H NMR studies25
as a function of temperature.§ At 77 K and above the 2H NMR lineshape is single, narrow (FWHM < 1800 Hz) and featureless. This indicates unequivocally that both ions are reorienting pseudo-isotropically at rates which are already rapid on the NMR timescale (≪ 1.5 × 10⁻⁶ s−1), since 2H NMR lineshapes for static N–D and B–D bonds should show doublets roughly 150 and 80 kHz apart
respectively (based on quadrupole coupling constants of ND3BH3 or NH3BD3).26 This is consistent with reorientations such that each H or D visits the 8 positions at the corners of the cube indicated by the structural study. Note, however, that reorientation between tetrahedral sites or rotational diffusion over a sphere would give a similar result.
1H and 2H spin-lattice relaxation times (T
1) are related to the correlation time (τc) for a motion by: 27
K is a collection of constants involving geometric factors, the dipolar coupling factors for 1H and quadrupolar coupling factors for 2H. ω
o is the Larmor frequency. τc has an Arrhenius dependence on temperature and the activation energy (Ea):
Fig. 2 H atom thermal trajectories over 14.5 ps, coloured by the simulation time from beginning (blue) to end (red).
1/T1 = K[ωoτc/(1 + (ωoτc)2) + 4ω
oτc/(1 + 4(ωoτc)2)]
τc = τco exp(E a/RT)
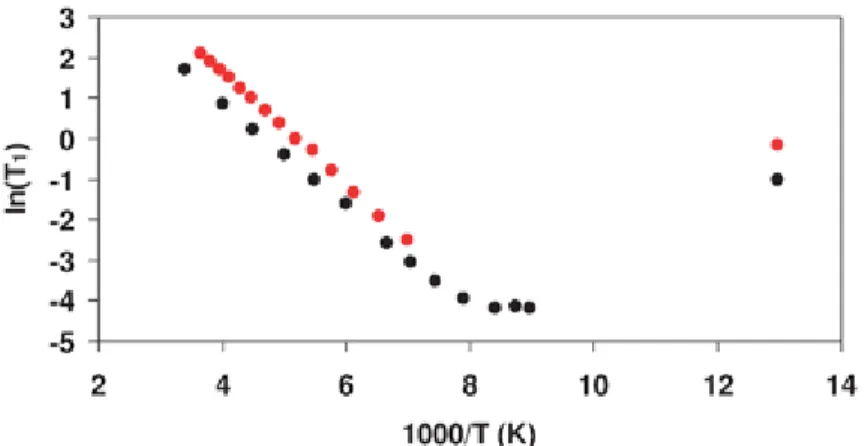
The ln(T1) vs. 1/T plots (Fig. 3) show the high temperature linear slopes of the relaxation curves, where the correlation times are already very short (ωoτc ≪ 1). Least squares fits to the linear regions give Ea = 11.5 ± 0.1 kJ mol−1 for 1H and E
a = 10.7 ± 0.1 kJ mol−1 for 2H. The 2H curve reaches a T
1 minimum of 15.2 ms at 117 K, and for both 1H and 2H the T1 values at 77 K are on the rising low temperature slope of the relaxation curve. The data do not allow separation of the contributions to relaxation arising from each ion, although the 2H data suggest that a possible second minimum may occur between 110–77 K, since a single relaxation process fits all the data very well except for the point at 77 K. While the derived Ea is in effect an average for the motions of the two ions, nevertheless their individual Eas must be quite similar. The small difference in Ea between 1H and 2H may reflect quantum effects, and with such low activation energies it is also very likely that relaxation will be influenced by tunnelling at low temperatures. Further theoretical calculations of barriers for rotation of the two ions about various axes (for the somewhat unrealistic situation where surrounding ions are fixed at equilibrium positions) give barrier values ranging 20.1–37.4 and 16.3– 19.5 kJ mol−1 for BH4− and NH4+ respectively. These will be upper limits as in reality cooperative motions of all ions should reduce the barriers. These are of the same magnitude as the NMR results, but suggest that BH4− is slightly more hindered than NH4+.
From the 2H T
1 results the intercept of the linear slope at infinite T and the T1 minimum can be used to determine a value of τc0, and hence the correlation time τc at any T. Thus, at 300 K τc is estimated to be 16 ps, which is quite consistent with the MD simulations where several sites are visited in 14.5 ps. It is a matter of conjecture as to whether the rapid motions might occasionally bring atoms close enough for reaction to occur, though we have not yet seen such an event in any of the MD simulations.
In conclusion, through high quality PXRD and MEM analysis hydrogen atom positions were located in the Fm m structure of NH4BH4, disordered over the corners of a cube surrounding the central atom (B or N). MD calculations and solid state NMR results are fully consistent with this structure and show that the disorder is dynamic, corresponding to very rapid reorientation of both ions at room temperature.
Notes and references
Fig. 3 NMR spin-lattice relaxation times (T1) as a function of temperature: red = 1H, black = 2H.
1 L. Schlapbach and A. Züttel, Nature, 2001, 414, 353 Article .
2 R. S. Kumar and A. L. Cornelius, J. Alloys Compd., 2009, 476, 5 Article ChemPort .
3 K. Miwa, M. Aoki, T. Noritake, N. Ohba, Y. Nakamori, S. Towata, A. Züttel and S. Orimo, Phys. Rev. B: Condens. Matter
Mater. Phys., 2006, 74, 155122 Article .
4 K. B. Harvey and N. R. McQuaker, Can. J. Chem., 1971, 49, 3272 Article ChemPort .
6 R. W. Parry, D. R. Schultz and P. R. Girardot, J. Am. Chem. Soc., 1958, 80, 1 Article ChemPort .
7 A. J. Karkamkar, S. M. Kathmann, G. K. Schenter, D. J. Heldebrant, N. Hess, M. Gutowski and T. Autrey, Chem. Mater., 2009, 21, 4356 Article ChemPort .
8 M. Takata, E. Nishibori and M. Sakata, Z. Kristallogr., 2001, 216, 71 Article ChemPort . 9 F. Izumi and T. Ikeda, Commission on Powder Diffraction, IUCr Newsletter, 2001, 26, 7 .
10 T. Ikeda, Y. Akiyama, F. Izumi, Y. Kiyozumi, F. Mizukami and T. Kodaira, Chem. Mater., 2001, 13, 1286 Article ChemPort .
11 A. P. Hammersley, S. O. Svensson, M. Hanfland, A. N. Fitch and D. Hausermann, High Pressure Res., 1998, 14, 235 . 12 S. Desgreniers and K. Lagarec, J. Appl. Crystallogr., 1994, 27, 432 Article .
13 F. Izumi and K. Momma, Solid State Phenom., 2007, 130, 15 Article ChemPort .
14 F. Izumi and R. A. Dilanian, Recent Research Developments in Physics 3, II, Transworld Research Network, Trivandrum, 2002, 699 .
15 K. Momma and F. Izumi, J. Appl. Crystallogr., 2008, 41, 653 Article ChemPort .
16 Y. Filinchuk, D. Chernyshov, A. Nevidomskyy and V. Dmitriev, Angew. Chem., Int. Ed., 2008, 47, 529 Article ChemPort . 17 Y. Filinchuk, A. V. Talyzin, D. Chernyshov and V. Dmitriev, Phys. Rev. B: Condens. Matter Mater. Phys., 2007, 76, 092104
Article .
18 Y. Filinchuk, D. Chernyshov and R. Cerny, J. Phys. Chem. C, 2008, 112, 10579 Article ChemPort .
19 M. R. Hartman, J. J. Rush, T. J. Udovic, R. C. Bowman Jr. and S.-J. Hwang, J. Solid State Chem., 2007, 180, 1298 Article ChemPort .
20 B. V. Lotsch, J. Senken, W. Kockelmann and W. Schnick, J. Solid State Chem., 2003, 176, 180 Article ChemPort . 21 P. Giannozzi, et al., J. Phys.: Condens. Matter, 2009, 21, 395502 Article . http://www.quantum-espresso.org. 22 J. P. Perdew, K. Burke and M. Ernzerhof, Phys. Rev. Lett., 1996, 77, 3865 Article ChemPort .
23 S. Nosé, Mol. Phys., 1984, 52, 255 ChemPort .
24 P. Tangney and S. Scandolo, J. Chem. Phys., 2002, 116, 14 Article ChemPort .
25 C. I. Ratcliffe, in NMR Crystallography, ed. R. K. Harris, R. E. Wasylishen and M. J. Duer, Wiley, Chichester UK, 2009, 355 .
26 G. H. Penner, Y. C. P. Chang and J. Hutzal, Inorg. Chem., 1999, 38, 2868 Article ChemPort .
27 N. Bloembergen, E. M. Purcell and R. V. Pound, Phys. Rev., 1948, 73, 679 Article ChemPort ; R. Kubo and K. Tomita, J.
Phys. Soc. Jpn., 1954, 9, 888 ChemPort .
Footnotes
† This article is part of a ChemComm ‘Hydrogen’ web-based themed issue.
‡ Electronic supplementary information (ESI) available: Preliminary Rietveld fit excluding H atoms, and bond length distribution plots calculated from MD. See DOI: 10.1039/c0cc03297b
§ Experimental details: (a) PXRD at the CLS used the HXMA beamline. Diffraction images were recorded on a MAR 345 detector and integrated with Fit2D software11 and calibration measurements of a NIST LaB6 standard. XRDA12was used for pattern indexing and the RIETAN-FP package13 for Rietveld analysis. The Maximum Entropy Analysis was performed using PRIMA14 software and the electron density distributions were plotted using VESTA.15 All MEM calculations were performed over a 643 pixel mesh representing the unit cell. The DAC confined the sample in a 200 μm diameter hole drilled in a stainless steel gasket. Pressure inside the DAC was monitored using the ruby fluorescence technique. To avoid any chemical reaction, no pressure transmitting medium was used. (b) CPMD
calculations were performed using the Quantum ESPRESSO package with ultrasoft pseudopotentials.21 The generalized gradient approximation (GGA) was employed.22 Electronic wave functions and charge densities were expanded in a plane-wave basis set using an energy cutoff of 40 and 240 Ry., respectively. CPMD calculations were performed at 300 K with a canonical ensemble (NVT). Temperature was controlled by a Nosé thermostat.23 The supercell contained 32 NH4BH4 pairs. Zone centre Brillouin sampling was used. A fictitious electron mass of 200 a.u. and a time step of 6 a.u. were used.24 The supercell was equilibrated for 3 ps and then trajectories were obtained. (c) 1H NMR lineshapes were obtained at 200 MHz on a Bruker Advance 200 spectrometer and for 2H at 46.05 MHz on a Bruker AMX 300 spectrometer. Spin-lattice relaxation time (T1) measurements as a function of temperature were obtained using inversion recovery pulse sequences. (Low temperatures were obtained with cold nitrogen gas and Eurotherm controllers, and at 77 K by immersing the coil in liquid nitrogen.)