HAL Id: hal-02401881
https://hal.archives-ouvertes.fr/hal-02401881
Submitted on 10 Dec 2019
HAL is a multi-disciplinary open access
archive for the deposit and dissemination of sci-entific research documents, whether they are pub-lished or not. The documents may come from teaching and research institutions in France or abroad, or from public or private research centers.
L’archive ouverte pluridisciplinaire HAL, est destinée au dépôt et à la diffusion de documents scientifiques de niveau recherche, publiés ou non, émanant des établissements d’enseignement et de recherche français ou étrangers, des laboratoires publics ou privés.
through Enhancer Shuffling
Richard Wallbank, Simon Baxter, Carolina Pardo-Diaz, Joseph Hanly, Simon
Martin, James Mallet, Kanchon Dasmahapatra, Camilo Salazar, Mathieu
Joron, Nicola Nadeau, et al.
To cite this version:
Richard Wallbank, Simon Baxter, Carolina Pardo-Diaz, Joseph Hanly, Simon Martin, et al.. Evo-lutionary Novelty in a Butterfly Wing Pattern through Enhancer Shuffling. PLoS Biology, Public Library of Science, 2016, 14 (1), pp.e1002353. �10.1371/journal.pbio.1002353�. �hal-02401881�
Massachusetts, United States of America, 6 Department of Biology, University of York, York, United Kingdom, 7 Institut de Systématique Evolution et Biodiversité, UMR 7205, CNRS MNHN UPMC EPHE, Muséum National d'Histoire Naturelle, CP50, Paris, France, 8 Centre d’Ecologie Fonctionnelle et Evolutive, UMR 5175, CNRS–Université de Montpellier–Université Paul-Valéry–EPHE, Montpellier, France, 9 Dept. of Animal and Plant Sciences, University of Sheffield, Sheffield, United Kingdom
☯ These authors contributed equally to this work. *[email protected]
Abstract
An important goal in evolutionary biology is to understand the genetic changes underlying novel morphological structures. We investigated the origins of a complex wing pattern found among Amazonian Heliconius butterflies. Genome sequence data from 142 individu-als across 17 species identified narrow regions associated with two distinct red colour pat-tern elements, dennis and ray. We hypothesise that these modules in non-coding sequence represent distinct cis-regulatory loci that control expression of the transcription factor optix, which in turn controls red pattern variation across Heliconius. Phylogenetic analysis of the two elements demonstrated that they have distinct evolutionary histories and that novel adaptive morphological variation was created by shuffling these cis-regulatory modules through recombination between divergent lineages. In addition, recombination of modules into different combinations within species further contributes to diversity. Analysis of the tim-ing of diversification in these two regions supports the hypothesis of introgression movtim-ing regulatory modules between species, rather than shared ancestral variation. The dennis phenotype introgressed into Heliconius melpomene at about the same time that ray origi-nated in this group, while ray introgressed back into H. elevatus much more recently. We show that shuffling of existing enhancer elements both within and between species provides a mechanism for rapid diversification and generation of novel morphological combinations during adaptive radiation.
OPEN ACCESS
Citation: Wallbank RWR, Baxter SW, Pardo-Diaz C, Hanly JJ, Martin SH, Mallet J, et al. (2016) Evolutionary Novelty in a Butterfly Wing Pattern through Enhancer Shuffling. PLoS Biol 14(1): e1002353. doi:10.1371/journal.pbio.1002353
Academic Editor: Nick H. Barton, Institute of Science and Technology Austria (IST Austria), AUSTRIA
Received: June 17, 2015
Accepted: December 8, 2015
Published: January 15, 2016
Copyright: © 2016 Wallbank et al. This is an open access article distributed under the terms of the
Creative Commons Attribution License, which permits unrestricted use, distribution, and reproduction in any medium, provided the original author and source are credited.
Data Availability Statement: All complete genome sequence data are available through the Short Read Archive with project accession number ERP009041 (full details in SamplesS3 Table). The sequence alignment, association data and other raw data are available on DataDryadhttp://dx.doi.org/10.5061/ dryad.t3r02.
Funding: This study was funded by the Biotechnology and Biological Sciences Research Councilhttp://www.bbsrc.ac.ukgrant number H01439X/1 to CDJ; the European Research Council MimEvol grant to MJ and the European Research
Author Summary
Butterflies show an amazing diversity of patterns on their wings. In fact, most of the 18,000 species of butterfly can be distinguished on the basis of their wing pattern. Much of this diversity is thought to arise through novel switches in the genome that turn genes on in new contexts during wing development, thereby producing new patterns. Here we study a set of switches that control the expression of optix, a gene that places red patches onto the wings of Heliconius butterflies. We show that two patterning switches—one that produces red rays on the hindwing and the other a red patch on the base of the forewing— are located adjacent to one another in the genome. These switches have each evolved just once among a group of 16 species but have then been repeatedly shared between species by hybridisation and introgression. Despite the fact that they are now part of a common pattern in the Amazon basin, these two pattern components actually arose in completely different species before being brought together through hybridisation. In addition, recom-bination among these switches has produced new comrecom-binations of patterns within species. Such sharing of genetic variation is one way in which mimicry can evolve, whereby pat-terns are shared between species to send a common signal to predators. Our work suggests a new mechanism for generating evolutionary novelty, by shuffling these genetic switches among lineages and within species.
Introduction
One of the major impediments to evolutionary innovation is the constraint on genetic change imposed by existing function [1]. Mutations that confer advantageous phenotypic effects in a novel trait will often result in negative pleiotropic effects in other traits influenced by the same gene. Several mechanisms have been proposed by which evolution can circumvent such con-straints, resulting in phenotypic diversification. In particular, the modularity of cis-regulatory elements [2–6] means that novel modules can encode new expression domains and functions without disrupting existing expression patterns [6,7]. This modularity underlying gene regula-tion has led to the asserregula-tion that much of morphological diversity has arisen through regulatory evolution [6].
Much of our understanding of modularity in regulatory evolution comes from Drosophila, in which the loss of trichomes on the larval cuticle [5], the gain of melanic wing spots [8–10], or changes in abdominal pigmentation [3,11] have been shown to involve evolutionary changes in cis-regulatory elements. These elegant developmental studies demonstrate the underlying logic of regulatory modularity, whereby novel expression domains can arise without disrupting existing function. These studies have also established a paradigm in which small effect muta-tions alter transcription factor binding sites in these regulatory modules and in combination produce large effect alleles [5]. Similar conclusions come from recent work in other taxa, including mice and jewel wasps [2,12]. This might seem to imply that the evolution of novel regulatory alleles is relatively gradual, requiring the evolution of many small effect substitu-tions, but recent adaptive radiations can show extremely rapid rates of morphological change. The role of regulatory modularity therefore remains to be tested in adaptive radiations in which morphological variation evolves very rapidly.
Here we explore the origins of adaptive novelty among the wing patterns of Heliconius but-terflies. These wing patterns are under strong natural selection for mimicry and warning col-our, as well as being important mating signals [13]. The rapid radiation in Heliconius is accompanied by an even more rapid diversification in mimicry patterns as well as convergence
Council Speciation Genetics to CDJ. The funders had no role in study design, data collection and analysis, decision to publish, or preparation of the manuscript.
Competing Interests: The authors have declared that no competing interests exist.
Abbreviations: BLAST, Basic Local Alignment Search Tool; HPD, highest posterior density; ML, maximum likelihood; SNP, single nucleotide polymorphism.
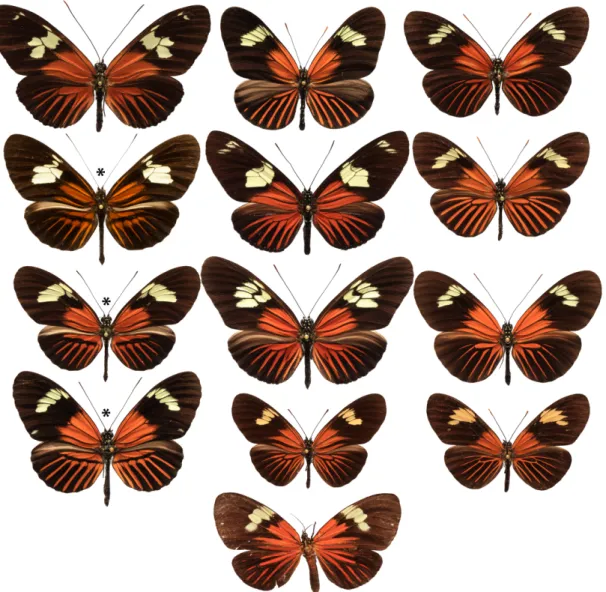
among species found in a given locality [14], both through independent convergent evolution and via introgression of gene regions between races and species [15,16]. Mimetic convergence reaches its peak among red dennis-ray pattern phenotypes in the Amazon (Fig 1), where 11 or more Heliconius species, as well as pierine butterflies and pericopine moths, share the same pattern. In addition to near perfect convergence in wing patterns in a given locality, there is also often striking divergence of patterns between localities as populations adapt to the many different mimicry complexes spread across the Neotropics [17]. This diversity provides an opportunity to study the genetic and developmental basis of evolutionary novelty.
Generally, the patterns on butterfly wings are a good system in which to link genetic changes to the developmental processes that generate diversity [18,19]. Wing colour patterns are mosa-ics of scales, each with a single colour, produced by a combination of pigment and ultrastruc-ture. The relative positions of differently coloured scales are established during larval and
Fig 1. Diversity of the Amazonian dennis-ray mimicry ring. First row: H. burneyi huebneri, H. aoede auca, and H. xanthocles zamora; second row: H. timareta timaretaf. timareta, H. doris doris, and H. demeter ucayalensis; third row: H. melpomene malleti, H. egeria homogena, and H. erato emma; fourth row: H. elevatus pseudocupidineus, Eueides heliconioides eanes, and E. tales calathus; and bottom: Chetone phyleis, a pericopine moth. Stars indicate the three species that are the focus of this study. Butterflies figured are from the Neukirchen Collection, McGuire Centre, Florida. The butterflies are from populations in both Ecuador and Peru.
pupal wing development [20]. Wing development is thought to be broadly conserved in insects, with wing developmental genes showing similar expression patterns between flies and butter-flies [21–23]. This therefore raises the question: how is this conserved landscape of wing devel-opment translated into the diversity of butterfly wing patterns? In Heliconius, pattern diversity is controlled by a surprisingly small number of genomic regions with large effect sizes [24,25]. In particular, genetic mapping and gene expression studies have shown that red elements are associated with expression of the transcription factor optix across all Heliconius species [26,27]. In the absence of fixed coding sequence changes between wing pattern forms, this implies that red pattern variation is controlled by differential regulatory control of optix [27]. Population genomic studies have identified a region of non-coding sequence downstream of optix that is associated with phenotypic change [15,28]. Previous work suggests that there may be several distinct elements within this region. Occasional hybrid phenotypes possess only the“dennis” patch on the base of the forewing or the“ray” elements on the hindwing and have been hypothesised to be rare recombinants, although this has never been tested genetically [29,30]. Similarly, there are also established forms that exhibit only dennis or ray patterns (H. melpom-ene meriana and H. timareta timareta f. contigua, respectively,Fig 2). This suggests that the broad genomic interval already identified might contain discrete regulatory loci that vary the spatial expression of optix in different wing regions, a hypothesis that we can now test with genetic data.
Here we focus on the H. melpomene lineage, in which the Amazonian dennis-ray phenotype has evolved recently from a red-banded ancestor [31]. We carry out a population genomic analysis on H. melpomene and its relatives, H. elevatus and H. timareta, to identify putative reg-ulatory modules associated with distinct red pattern elements. Previously, population genetic evidence has suggested that mimicry among H. melpomene, H. elevatus, and H. timareta has evolved through sharing of the dennis-ray allele by repeated adaptive introgression at the optix locus [16]. This is especially surprising in the case of H. elevatus, which forms part of the “silva-niform” clade that diverged from H. melpomene around 4 million years ago [14]. Our analysis here indicates that the origin of the red pattern elements is considerably more complex than has been previously supposed, with the dennis and ray elements of the widespread dennis-ray pattern having distinct evolutionary origins in different clades within the genus.
Results and Discussion
We took advantage of natural phenotypic variants in which the two red elements, dennis and ray, occur separately to identify putative functional regulatory regions controlling red pattern within the H. melpomene clade. Genomic analysis of 96 individuals from the melpomene-timar-eta clade revealed two distinct regions that showed strong association with the dennis and ray pattern elements, respectively. Our analysis included a race of H. melpomene, H. m. meriana, from the Guiana shield, which possesses the forewing dennis patch but not ray, as well as H. t. timareta f. contigua from Ecuador, which possesses ray but not dennis, plus a recombinant individual from an H. melpomene hybrid zone in Ecuador with dennis but not ray (Fig 2A). Across all 96 individuals, there were significant genotype-by-phenotype associations across all genome regions surveyed. This“background” signal of genotype-by-phenotype association is likely due to the presence of genetically divergent species in our dataset that are to some degree confounded with phenotype. Nonetheless, our analysis identified a peak of genotype-by-phe-notype association spanning roughly 50 kb and located from 60–110 kb 3ʹ of the optix gene, similar to what has been observed previously (Fig 2B) [28]. This region also corresponds closely to that identified recently in the mimetic species H. erato [15], implying convergence in the
regulatory architecture controlling wing pattern mimicry at a finer scale than has been previ-ously demonstrated [28,31].
Furthermore, within this region in our data, distinct adjacent peaks of association were observed for the dennis and ray elements. Focusing specifically on fixed single nucleotide poly-morphism (SNP) differences between alternative red phenotypes revealed two distinct peaks of association (Fig 2C). One, approximately 10 kb in length, contained SNPs perfectly associated with the red dennis patch. The other adjacent region was broader, roughly 25 kb, and con-tained SNPs perfectly associated with red hindwing rays.
We next used broader taxonomic sampling to further refine these intervals and identify exact sequence haplotypes associated with each of the two phenotypic elements (Fig 2D). To identify recombination breakpoints around dennis and ray haplotypes, we generated a high-quality sequence alignment by de novo assembly of each individual genome and then identified contigs across the associated region using the Basic Local Alignment Search Tool (BLAST). For the dennis region, alignment was assisted by a sequenced fosmid clone from H. m. aglaope (dennis phenotype) to complement the reference genome (derived from a non-dennis butter-fly). The final alignment included the 96 melpomene-timareta individuals used for association analysis and a further 46 individuals that included species with no red (H. cydno) and species from the more distantly related silvaniform clade including H. elevatus, which has the dennis-ray pattern. The distal end of the dennis region, relative to optix, was delineated by a rapid loss of phenotype-associated variants across all species sampled, whilst the proximal end was deter-mined by a single fixed recombination event in the race H. m. meriana (dennis but no ray phe-notype), generating a region of ~7 kb fully associated with dennis. For ray, a breakpoint in the ray-only H. t. timareta f. contigua defined the distal end, whilst a recombination in H. m. meri-ana defined the proximal end, resulting in a larger ~37 kb region (Fig 2D). Each haplotype group was characterised by diagnostic SNPs as well as a fixed architecture of indel variation (Fig 3). These analyses therefore support the hypothesis derived from phenotypic evidence, that dennis and ray phenotypes are controlled by adjacent distinct genetic elements. In combi-nation with previous work showing differential expression of optix across a wide diversity of Heliconius species and races, this provides clear genetic evidence for modularity in the cis-regu-latory control of optix.
We have previously hypothesised that the dennis-ray mimicry pattern introgressed as a sin-gle genomic block between H. melpomene and H. timareta, as well as more distantly between H. melpomene and H. elevatus [16]. Our new data suggest a much more complex history than previously recognised, with dennis and ray having quite distinct origins. As expected, a maxi-mum likelihood (ML) phylogeny shows that the ray alleles fall within the H. melpomene clade, indicating an origin derived from an ancestral H. melpomene phenotype. In contrast, however, alleles producing the dennis phenotype originated within the silvaniform clade, which diverged from H. melpomene around 4 million years ago (Fig 4) [14]. Members of this clade have mot-tled orange/red, black, and yellow“tiger” patterns and are mostly co-mimics of butterflies in the tribe Ithomiini, whereas the melpomene-cydno clade are all co-mimics of other Heliconius
Fig 2. Genotype-by-phenotype association analyses and mapping of dennis and ray regions. (A) Examples of the principal red wing patterns: dennis-ray H. e. pseudocupidineus and H. m. malleti, dennis-only H. m. meriana, dennis-ray-only H. t. timareta f. contigua, and band H. m. rosina. (B) Association analysis across 96 genomes showing statistical association for the dennis (red dots) and ray phenotypes (orange dots). The horizontal black line represents
significance after Bonferroni correction. Boxes show exon positions. (C) Sliding window analysis of fixed differences between specific comparisons to identify dennis- and ray-associated sites (orange and red lines—see alsoS1 FigandS1 Table). (D) Recombination breakpoints allowed separate isolation of regions fully associated with dennis and ray phenotypes. Informative haplotypes are shown (H. elevatus, H. m. malleti, H. t. timareta f. contigua, H. m. meriana, and H. m. rosina, phenotypes shown above). Genotypes are indicated as D/d for dennis present/absent and R/r for ray present/absent. A H. melpomene recombinant hybrid was heterozygous in the dennis region and homozygous for ray-absent, as expected, but was not informative for precise breakpoint delineation because of missing data. See Dryad depository for plot data [32].
species. Nonetheless, the silvaniforms commonly have orange patches on the base of the fore-wing, which in some cases are remarkably similar to the dennis patch of H. melpomene. In par-ticular, the form H. hecale metellus has a dennis-like phenotype (Fig 4A), which suggests a plausible ancestral phenotype that might have provided the source of the dennis allele in H. melpomene.
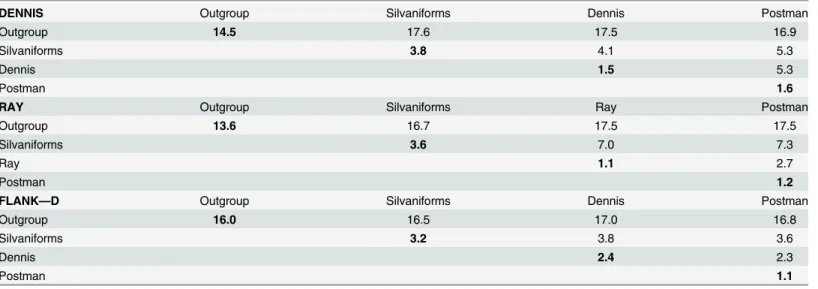
Various scenarios might explain this complex history. Sharing of variation between species can be explained by either retention of ancestral polymorphism or introgression through hybri-disation. We can directly test these alternative scenarios using dated trees inferred from our alignments. In order to provide comparable trees, we used the divergence date between the sil-vaniform and melpomene-cydno clades derived from a recent species tree for the Heliconinii [14] to calibrate the dennis and ray region phylogenies. These trees support introgression and rule out ancestral polymorphism because the dates of coalescence of the H. melpomene and H. elevatus dennis and ray alleles are significantly more recent than the divergence of these two species. These species last shared a common ancestor at around 3.96 Ma (95% highest posterior density [HPD] interval 3.18–4.81 Ma) [14]. In contrast, the dennis allele shared between H. ele-vatus and H. melpomene/timareta diverged around 1.95 Ma (2.79–1.25 Ma HPD). The diver-gence of the ray allele is even more recent and shared a common ancestor between H. elevatus and H. melpomene/timareta around 0.66 Ma (0.93–0.43 Ma HPD). The recent origin of these alleles is also supported by low levels of genetic diversity within these clades, with the average pairwise sequence divergence among the dennis alleles only 1.5%, including those from H. mel-pomene, H. timareta, and the more distantly related H. elevatus (Table 1, top). This is less than that found among the same individuals in flanking sequence (2.4%) and comparable to that among the red-forewing-banded“postman” group for the same locus (1.6%), which includes only more closely related melpomene and timareta individuals. The ray alleles also show only 1.1% average pairwise sequence divergence at the ray locus, similarly less than in the postman group at the same locus. Although sequence diversity is likely to be reduced in these regions because of functional constraint, it seems likely that such constraint is similar across different clades in the phylogeny, so the relatively low levels of diversity within the ray and dennis clade support their recent origin.
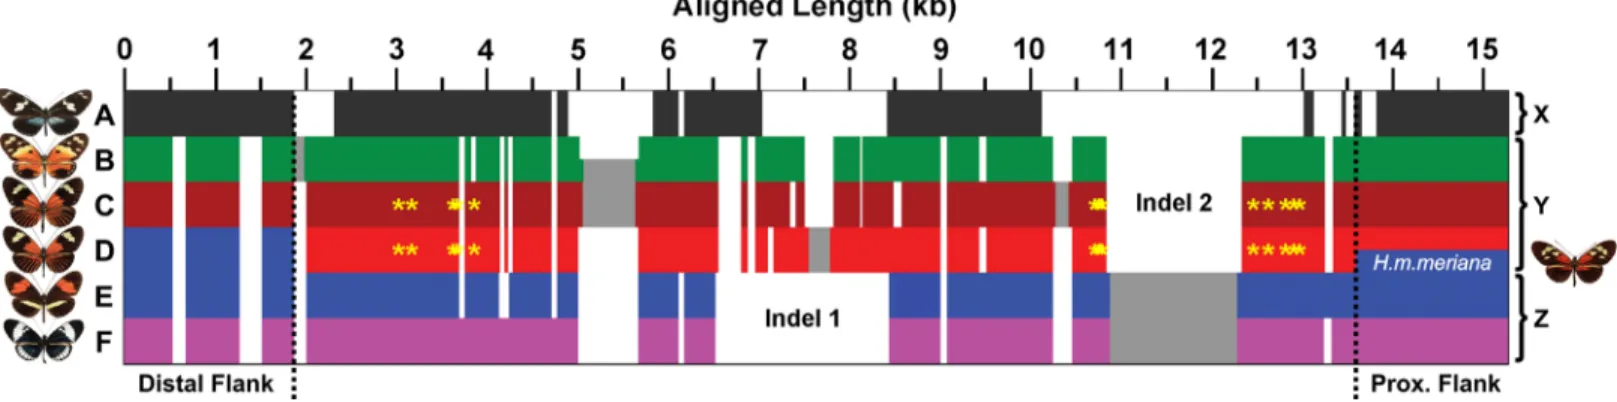
Fig 3. Schematic overview of the dennis region alignment architecture. Each group of alleles is characterised by a complex structure of insertion and deletion variation. Horizontal bars represent aligned allele sequences for the outgroups (A), silvaniforms (B), H. elevatus (C), dennis morph melpomene/ timareta (D), non-dennis morph melpomene/timareta (E), and the cydno/heurippa/pachinus clade (F). There are three general forms of the region: an “outgroup” allele (X) with many indels and lacking large sections of sequence; a silvaniform/dennis allele (Y), which possesses indel 1 and lacks indel 2; and a non-dennis/cydno allele (Z), which lacks indel 1 and possesses indel 2. Dotted lines and blue colouration indicate the point where dennis-morph
melpomene/timareta alleles become silvaniform like (left) and where the dennis-only morph, H. m. meriana, recombines with the other non-rayed melpomene (right). Fixed SNPs in perfect association with the dennis phenotype are indicated by yellow asterisks and form two clusters. See Dryad depository for alignment [32].
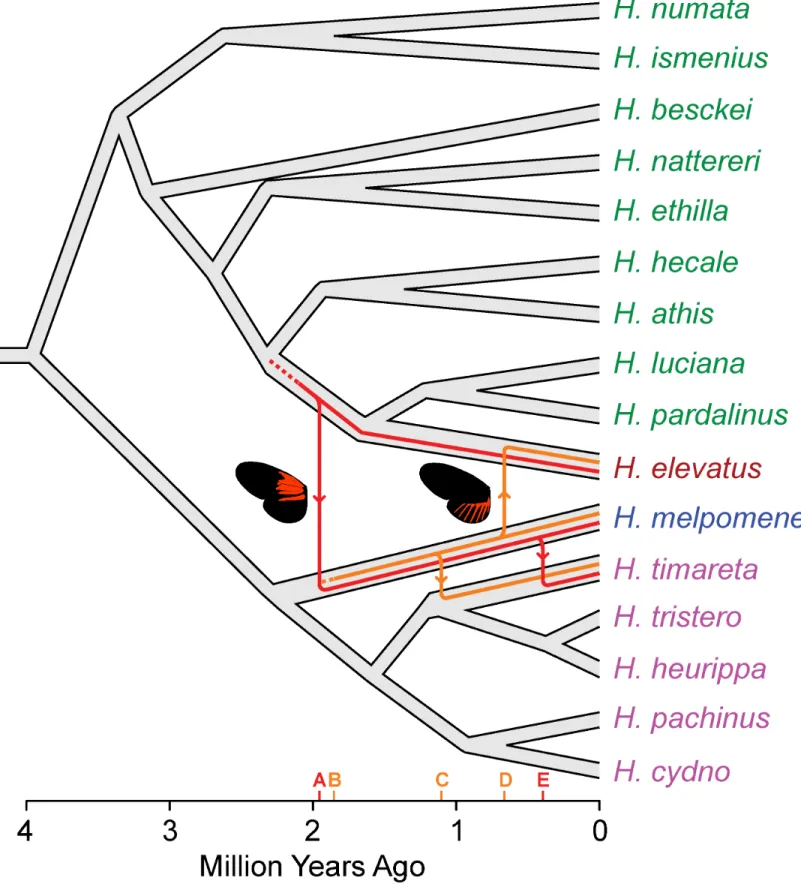
data indicate that the ray allele originated within H. melpomene at around the same time as dennis introgressed into the H. melpomene clade from an ancestor of H. elevatus, sometime around 1.85 Ma (2.53–1.25 Ma HPD;Fig 5andS3 Fig). This suggests that the characteristic mimetic dennis-ray phenotype first came together within H. melpomene at that time. In con-trast, H. elevatus did not acquire the ray allele until about a million years later and perhaps per-sisted during this time as part of the Guiana Shield dennis-only mimicry ring. The dennis and ray alleles of H. timareta are each nested within those of H. melpomene and are more recent than the divergence of these species, implying introgression from H. melpomene into H. timar-eta and consistent with previous analyses [33]. Nonetheless, dennis and ray events also differ in timing, as most of the H. timareta ray alleles diverge from their H. melpomene relatives around 1 Ma, but the dennis alleles diverged only around 0.45 Ma (Fig 5andS3 Fig). H. timareta ray alleles are polyphyletic with respect to H. melpomene, also supporting multiple introgression events and recombination between the regions. Further sampling will be needed to resolve more clearly the timing and number of introgression events between these species.
In addition to recombination between lineages, there is also shuffling of alternate alleles at these regulatory modules within species. Across most of their range, H. melpomene and H. timareta have either postman or dennis-ray haplotypes across the entire studied region.
Table 1. Average pairwise sequence divergence between alleles within the two colour pattern-determining regions (%).
DENNIS Outgroup Silvaniforms Dennis Postman
Outgroup 14.5 17.6 17.5 16.9
Silvaniforms 3.8 4.1 5.3
Dennis 1.5 5.3
Postman 1.6
RAY Outgroup Silvaniforms Ray Postman
Outgroup 13.6 16.7 17.5 17.5
Silvaniforms 3.6 7.0 7.3
Ray 1.1 2.7
Postman 1.2
FLANK—D Outgroup Silvaniforms Dennis Postman
Outgroup 16.0 16.5 17.0 16.8
Silvaniforms 3.2 3.8 3.6
Dennis 2.4 2.3
Postman 1.1
Individuals were grouped by their phenotype rather than taxonomy, and average percentage pairwise divergence was calculated within either the dennis (top) or ray (middle) region alignments. All silvaniforms are grouped together except for H. elevatus, which is grouped with the dennis/ray melpomene and timaretamorphs. As a control, aflanking region distal to the dennis allele relative to optix (seeFig 3) is also shown (bottom). The dennis and postman alleles are equally different to the silvaniforms for sequences outside the putative dennis region, as would be expected from the species tree. SeeS2 Tablefor divergences of ray individuals at the dennis region and dennis individuals at the ray region.
Fig 5. Hypothesis for the origins and introgression of the dennis and ray regions inferred from dated trees. Key events indicated on the x-axis are (A) introgression of dennis from H. elevatus into H. melpomene, inferred from the coalescence time of alleles sampled from these two species; (B) the origin of rayalleles within H. melpomene, inferred from the coalescence of dennis and non-dennis alleles within H. melpomene; (C) introgression of ray into H. timareta; (D) introgression of ray into H. elevatus, and (E) introgression of dennis into H. timareta. Dating of phylogenies was carried out using BEAST, and
contributed to evolutionary innovation in the Heliconius radiation. First, distinct genetic ele-ments are associated with different patches of red on the butterfly wing. This supports the hypothesis of regulatory modularity, which should facilitate evolutionary innovation. Second, the origin of the dennis-ray phenotype in H. melpomene involved a combination of evolution-ary tinkering of existing patterns and introgression between species. Finally, we show that diversity within three lineages (H. elevatus, H. melpomene, and H. timareta) has been generated by shuffling of these distinct regulatory modules among populations and species. Within all three lineages, some populations possess one or other of these elements, providing further flexi-bility in pattern evolution. Our data imply that recombination between lineages can generate novel phenotypic combinations and demonstrate how modularity in the cis-regulatory control of key genes can drive the rapid evolution of novel morphologies. Although the evolution of novel regulatory modules may involve many mutational steps [5], these can subsequently be exchanged between lineages and shuffled into new combinations enabling rapid adaptive evo-lution. Recent studies showing that adaptation can proceed via gene flow of preadapted genetic modules between nearby populations or species suggest that similar mechanisms may be important in other radiations. In sticklebacks, adaptation to freshwater involves movement of alleles through the marine landscape [34]. Mosquitoes, Darwin’s finches, and even humans also show evidence for introgression of alleles between species that facilitate adaptation [35– 37]. The extent to which recombination between regulatory alleles can contribute to morpho-logical novelty in these other groups of organisms remains to be seen.
Materials and Methods
Genome Sequencing and Analysis
Specimen collection. Wings of field caught Heliconius butterflies were removed and stored in labelled envelopes and bodies preserved at−20°C in 20% DMSO, 0.25 M EDTA, salt saturated solution. For sample locations and phenotypes of Heliconius species collected, seeS3 Table. DNA was isolated from one third of a thorax, yielding ~3μg. Tissue was homogenised in buffer ATL using the TissueLyser (Qiagen) set for 4 min at 25 Hz, and DNA purified using the DNeasy Blood and Tissue Kit (Qiagen). RNA was removed with RNase A.
Sequencing and alignment. Whole genome shotgun sequences were generated for 93 samples using the Illumina HiSeq2000 platform, generating 100 bp, paired-end sequences (The Genepool, United Kingdom; Baylor College of Medicine Human Genome Sequencing Center, United States; FAS Center for Systems Biology, Harvard, US). The sequence for the HmD col-our pattern region, obtained previously from 45 additional samples using targeted sequence capture (SureSelect, Agilent Technologies), was also analysed [28].
Raw reads from resequenced genomes were aligned to the H. melpomene melpomene refer-ence (v1.1) using Stampy (v1.0.17) [38], with substitution rates of 0.03, 0.04, and 0.05 for H. melpomene, H. timareta/heurippa/cydno, and silvaniform samples, respectively. Duplicate
reads were removed with Picard (v1.67,http://picard.sourceforge.net). The HE670865 HmBD colour pattern scaffold was extracted from genome BAM files using the Samtools view func-tion, and each sample sorted and indexed. To minimise alignment errors around insertions and deletions, BAM files were combined and analysed using the Genome Analysis Tool Kit (GATK V 1.6–11) function RealignerTargetCreator to produce a single intervals file. The GATK function IndelRealigner was then used to correct read mapping inconsistencies around in/del regions, and then UnifiedGenotyper created a vcf file with the parameters -out_mode EMIT_ALL_CONFIDENT_SITES -baq CALCULATE_AS_NECESSARY -hets 0.01.
Genotype-phenotype association testing. Genotypes of 96 individuals were extracted from vcf files using a custom perl script with a minimum mapping quality of 30, genotype qual-ity of 30, minimum read depth 4, and maximum depth of 300. Sites failing these thresholds were scored as a missing genotype, N. Chi-squared tests for association between genotype and phenotype were performed with R program (R Development Core Team, 2011) package GenABEL, using the ccfast function. Plots (Fig 2B) show p-values with one degree of freedom, with Bonforroni correction for 219,501 informative sites (−log10~6.64).
Fixed nucleotide differences between samples. Fixed nucleotide differences between two sample groups were identified using a custom python script (SM), and their distribution was plotted against scaffold HE670865 using R (R Development Core Team, 2011). Plots display the number of fixed sites within a 5 kb sliding window, moving at 1 kb intervals.
Fosmid and BAC sequencing. A H. m. aglaope fosmid library was screened using a DNA probe amplified using PCR primers BD_probe_F 5ʹ-AAAGTAGTCGGGTGCGCTTA-3ʹ BD_probe_R 5ʹ-CTGACTCGACATCCCTGTCA-3ʹ. Clone 1048-3N15 was purified, sheared with sonication (Bioruptor, Diagenode), subcloned into pGEM-t-Easy vector (Promega), and shotgun sequenced using an ABI3730 DNA Analyzer (Accession KU200223). The 36 Kb clone was assembled into five contigs from 302 reads, and the ends were ordered based on the orien-tation of the vectors used to create the fosmid library. Internal contigs were ordered based on evidence from a H. m. agalope (aglaope.1) de novo genome assembly using ABySS with a k-mer of 41. A second screened clone, 1048-143N20, was partially sequenced by PCR amplifica-tion of the dennis region (S4 Table), su-cloned into pGEM-t-Easy vector, and Sanger sequenced using standard T7F and SP6 primers. The BAC sequence for AEHM-19L14 was sequenced pre-viously and downloaded from NCBI GenBank [39].
Recombination Breakpoint Mapping
The paired-end sequencing reads for the 96 individuals used above plus an additional 43 indi-viduals mainly representing outgroup species (S3 Table) were imported into CLC Genomics Workbench v5.5 and de novo assembled into contigs using default parameters (mismatch: 2; insertion: 3; deletion: 3; length fraction: 0.5; similarity fraction: 0.8). The resulting contigs were imported into Geneious v6.1 as FASTA files. These were used to construct BLAST databases in Geneious for each individual. Two further individuals were sampled in the form of the fully assembled reference sequences for dennis and ray regions, which were acquired from the H. melpomene reference genome v.1.1[16] and the fosmid 1048-3N15 from H. m. aglaope, which provided a reference sequence for the dennis haplotype. In Geneious, these sequences were then used as references to conduct BLASTn searches against the contig sequence databases for each of the 139 de novo assemblies. The BLAST results were then mapped back onto the refer-ence sequrefer-ence. Using the referrefer-ence as a template, matching contigs were concatenated into a single FASTA file for each individual, with Ns filling regions between contigs spaced according to the reference (or closest relative). Unresolvable genomic repeats were detected as regions in which more than two haplotypes matched by BLAST and were replaced with Ns. Heterozygous
Average pairwise divergence analysis. The multiple alignments generated for the dennis and ray region were analysed using MEGA 6.0 (http://www.megasoftware.net/). The average pairwise divergence was calculated for the following groups of taxa—outgroups: H. aoede, H. hecuba, H. hierax, H. xanthocles, H. doris, and H. wallacei; silvaniform group: H. numata bico-loratus, H. n. silvana, H. n. tarapotensis, H. n. elegans, H. ethilla, H. pardalinus ssp. nov., H. p. sergestus, H. ismenius, and H. hecale; dennis group: H. e. pseudocupidineus, H. e. bari, H. m. thelxiopeia, H. m. meriana, H. m. ecuadorensis, H. m. malleti, H. m. aglaope, and H. t. florencia; ray group: H. e. pseudocupidineus, H. e. bari, H. m. thelxiopeia, H. m. ecuadorensis, H. m. mal-leti, H. m. aglaope, H. t. florencia, and H. t. timareta f. contigua; and postman group: H. m. mel-pomene, H. m. rosina, H. m. amaryllis, H. m. amandus, H. m. vulcanus, H. m. cythera, H. m. bellula, and H. t. thelxinoe
Bayesian tree dating analysis. Following the methodology used in Kozak et al. [14], the multiple alignments generated for dennis and ray regions were prepared using the BEAST input file formatting tool, BEUti v1.8.2 [40]. The trees were calibrated by providing a nodal age prior to the silvaniform and melpomene-cydno clade split, with a mean of 3.96 Ma and an interval of 3.18–4.81 Ma, as predicted for that node by Kozak et al. [14]. The tree prior used the “speciation: birth-death process” [41], and the MCMC chain was run for 10,000,000 states, with a 20% burn-in. The chain was run using BEAST v1.8.2 and checked for MCMC conver-gence using the diagnostic tool Tracer v1.5 [42]. The output tree data were then compiled using TreeAnnotator v1.8.2, and the 95% HPD intervals were visualised using TreeFig v1.4.2 [43]. Sequence data files have been submitted to the European Nucleotide Archive with project number ERP009041.
All software are available athttp://tree.bio.ed.ac.uk/software/.
Supporting Information
S1 Fig. Fixed nucleotide sites associated with the ray and dennis phenotypes in scaffold HE670865.Pairwise sequence comparison using H. melpomene and/or H. timareta specimens grouped by phenotype reveals narrow regions associated with specific wing patterning pheno-types. Plots show the number of fixed nucleotide sites within a 5 kb sliding window (at 1 kb intervals) on scaffold HE670865, between two phenotypic groups (S1 Table). Protein coding exons spanning the scaffold, including optix, are shaded black. (A) Sequence comparison of ray and non-ray groups identified a minimal region of fixed nucleotide differences between 354,278 and 372,171 bp. (B) A comparison between dennis and non-dennis expressing pheno-types identified a minimal region of fixed nucleotide differences between 325,007 and 329,296 bp. (C) Sites associated with the ray and dennis phenotype are non-overlapping. SeeS1 Table, below, for samples used in pairwise comparisons. See Dryad depository for plot data [32]. (TIF)
S2 Fig. Phylogenies for multiple alignments of dennis and ray regions. Labelled trees from
Fig 2B, showing dennis morphs including H. elevatus (tree A) clustering with the silvaniform clade and ray morphs including H. elevatus (tree B) clustering with the H. melpomene and H. timareta clade. Individuals that have dennis-only pattern (D) group with dennis morphs (tree A), but not with ray morphs (tree B). The reverse is true of ray-only morphs (R). ML trees rooted to H. aoede outgroup, bootstraps = 1,000 iterations. See Dryad depository for ML tree-files [32].
(TIF)
S3 Fig. Dated phylogenies for multiple alignments of dennis and ray regions with dated species tree for comparison.The nodes for trees generated from the dennis and ray alignments were dated using BEAST MCMC software, and the 95% HPD interval is depicted with horizontal bars. The clades are coloured according toS2 Fig, with the addition of the dennis-ray morph timareta, H. t. florencia, in light brown. Also shown is the equivalent portion of the species tree from Kozak et al. [14], with all dates given in Ma. Major events shown onFig 5in the main text are also marked here for comparison, with (A) showing introgression of dennis from H. elevatus into H. melpomene, inferred from the coalescence time of alleles sampled from these two species, and the recency of this compared to species tree divergence of silvaniform and melpomene clades at 3.96 Ma; (B) marking the origin of ray alleles within H. melpomene, inferred from the coales-cence of dennis and non-dennis alleles within H. melpomene; (C) marking introgression of ray into H. timareta; (D) introgression of ray into H. elevatus, and (E) marking introgression of den-nis into H. timareta. See Dryad depository for dated treefiles with node values [32].
(TIF)
S1 Table. Specimens used to conduct pairwise sequence comparisons for identification of sites associated with the ray and dennis phenotypes (S1 FigandFig 2C).
(XLSX)
S2 Table. Additional nucleotide similarity matrices.Identical nucleotide similarity compari-son was conducted between alleles for the dennis and ray regions as shown inTable 1, but with ray-morph individuals grouped together for the dennis region analysis (top) and dennis-morph individuals grouped for the ray region analysis (bottom).
(XLSX)
S3 Table. List of samples used for sequencing. (XLSX)
S4 Table. Seven pairs of primer sequences used to amplify sequential fragments from the dennis region of fosmid clone 143N20.
(XLSX)
Acknowledgments
We thank Patricio Salazar and Richard Merrill for help with butterfly collection. We thank the Smithsonian Tropical Research Institute for support for tissue collection and work with butter-flies in Panama, and ANAM in Panama and the Ministerio del Ambiente in Ecuador for per-mission to collect butterflies.
Author Contributions
Conceived and designed the experiments: CDJ SWB RWRW CPD. Performed the experiments: SWB RWRW CPD. Analyzed the data: SWB RWRW CPD SHM NN CS JJH. Contributed
underlies adaptation in a Drosophila population. Science. 2009; 326: 1663–1667. doi:10.1126/ science.1178357PMID:20019281
4. Chan YF, Marks ME, Jones FC, Villarreal G, Shapiro MD, Brady SD, et al. Adaptive evolution of pelvic reduction in sticklebacks by recurrent deletion of a Pitx1 enhancer. Science. 2010; 327: 302–305. doi:
10.1126/science.1182213PMID:20007865
5. Frankel N, Erezyilmaz DF, McGregor AP, Wang S, Payre F, Stern DL. Morphological evolution caused by many subtle-effect substitutions in regulatory DNA. Nature. 2011; 474: 598–603. doi:10.1038/ nature10200PMID:21720363
6. Wray GA. The evolutionary significance of cis-regulatory mutations. Nat Rev Genet. 2007; 8: 206–216. doi:10.1038/nrg2063PMID:17304246
7. Wittkopp PJ, Kalay G. Cis-regulatory elements: molecular mechanisms and evolutionary processes underlying divergence. Nat Rev Genet. 2012; 13: 59–69. doi:10.1038/nrg3095
8. Gompel N, Prud’homme B, Wittkopp PJ, Kassner VA, Carroll SB. Chance caught on the wing: cis-regu-latory evolution and the origin of pigment patterns in Drosophila. Nature. 2005; 433: 481–7. doi:10. 1038/nature03235PMID:15690032
9. Werner T, Koshikawa S, Williams TM, Carroll SB. Generation of a novel wing colour pattern by the Wingless morphogen. Nature. 2010; 464: 1143–1148. doi:10.1038/nature08896PMID:20376004
10. Koshikawa S, Giorgianni MW, Vaccaro K, Kassner VA, Yoder JH, Werner T, et al. Gain of cis-regulatory activities underlies novel domains of wingless gene expression in Drosophila. Proc Natl Acad Sci. 2015; 112: 7524–7529. doi:10.1073/pnas.1509022112PMID:26034272
11. Rogers WA, Salomone JR, Tacy DJ, Camino EM, Davis KA, Rebeiz M, et al. Recurrent Modification of a Conserved Cis-Regulatory Element Underlies Fruit Fly Pigmentation Diversity. PLoS Genet. 2013; 9: e1003740. doi:10.1371/journal.pgen.1003740PMID:24009528
12. Loehlin DW, Werren JH. Evolution of Shape by Multiple Regulatory Changes to a Growth Gene. Sci-ence. 2012; 335: 943–947. doi:10.1126/science.1215193PMID:22363002
13. Jiggins CD. Ecological Speciation in Mimetic Butterflies. BioScience. 2008; 58: 541–548. 14. Kozak KM, Wahlberg N, Neild A, Dasmahapatra KK, Mallet J, Jiggins CD. Multilocus species trees
show the recent adaptive radiation of the mimetic Heliconius butterflies. Syst Biol. 2015; 64: 505–524. doi:10.1101/003749PMID:25634098
15. Supple MA, Hines HM, Dasmahapatra KK, Lewis JJ, Nielsen DM, Lavoie C, et al. Genomic architecture of adaptive color pattern divergence and convergence in Heliconius butterflies. Genome Res. 2013; doi:10.1101/gr.150615.112
16. The Heliconius Genome Consortium. Butterfly genome reveals promiscuous exchange of mimicry adaptations among species. Nature. 2012; 487: 94–98. doi:10.1038/nature11041PMID:22722851
17. Kronforst MR, Papa R. The Functional Basis of Wing Patterning in Heliconius Butterflies: The Mole-cules Behind Mimicry. Genetics. 2015; 200: 1–19. doi:10.1534/genetics.114.172387PMID:25953905
18. McMillan WO, Monteiro A, Kapan DD. Development and evolution on the wing. Trends Ecol Evol. 2002; 17: 125–133.
19. Beldade P, Brakefield PM. The genetics and evo-devo of butterfly wing patterns. Nat Rev Genet. 2002; 3: 442–452. doi:10.1038/Nrg818PMID:12042771
20. Nijhout FH. The Development and Evolution of Butterfly Wing Patterns. Smithsonian Institution Schol-arly Press; 1991.
21. Keys DN, Lewis DL, Selegue JE, Pearson BJ, Goodrich LV, Johnson RL, et al. Recruitment of a hedge-hog Regulatory Circuit in Butterfly Eyespot Evolution. Science. 1999; 283: 532–534. doi:10.1126/ science.283.5401.532PMID:9915699
22. Galant R, Skeath JB, Paddock S, Lewis DL, Carroll SB. Expression pattern of a butterfly achaete-scute homolog reveals the homology of butterfly wing scales and insect sensory bristles. Curr Biol. 1998; 8: 807–813. doi:10.1016/S0960-9822(98)70322-7PMID:9663389
23. Weatherbee SD, Frederik Nijhout H, Grunert LW, Halder G, Galant R, Selegue J, et al. Ultrabithorax function in butterfly wings and the evolution of insect wing patterns. Curr Biol. 1999; 9: 109–115. doi:
10.1016/S0960-9822(99)80064-5PMID:10021383
24. Joron M, Papa R, Beltran M, Chamberlain N, Mavarez J, Baxter S, et al. A conserved supergene locus controls colour pattern diversity in Heliconius butterflies. PLoS Biol. 2006; 4: 1831–1840. doi:10.1371/ journal.pbio.0040303
25. Papa R, Kapan DD, Counterman BA, Maldonado K, Lindstrom DP, Reed RD, et al. Multi-Allelic Major Effect Genes Interact with Minor Effect QTLs to Control Adaptive Color Pattern Variation in Heliconius erato. PLoS ONE. 2013; 8: e57033. doi:10.1371/journal.pone.0057033PMID:23533571
26. Reed RD, Papa R, Martin A, Hines HM, Counterman BA, Pardo-Diaz C, et al. optix drives the repeated convergent evolution of butterfly wing pattern mimicry. Science. 2011; 333: 1137–1141. doi:10.1126/ science.1208227PMID:21778360
27. Martin A, McCulloch KJ, Patel NH, Briscoe AD, Gilbert LE, Reed RD. Multiple recent co-options of Optix associated with novel traits in adaptive butterfly wing radiations. EvoDevo. 2014; 5: 1–14. doi:10. 1186/2041-9139-5-7PMID:24499528
28. Nadeau NJ, Whibley A, Jones RT, Davey JW, Dasmahapatra KK, Baxter SW, et al. Genomic islands of divergence in hybridizing Heliconius butterflies identified by large-scale targeted sequencing. Philos Trans R Soc B-Biol Sci. 2012; 367: 343–353.
29. Mallet J. The genetics of warning color in peruvian hybrid zones of Heliconius erato and Heliconius mel-pomene. Proc R Soc Lond Ser B-Biol Sci. 1989; 236: 163–185.
30. Sheppard PM, Turner JRG, Brown KS, Benson WW, Singer MC. Genetics and the Evolution of Mueller-ian Mimicry in Heliconius Butterflies. Philos Trans R Soc Lond B Biol Sci. 1985; 308: 433–610. doi:10. 2307/2398716
31. Hines HM, Counterman BA, Papa R, Albuquerque de Moura P, Cardoso MZ, Linares M, et al. A wing patterning gene redefines the mimetic history of Heliconius butterflies. Proc Natl Acad Sci. 2011; 108: 19666–19671. doi:10.1073/pnas.1110096108PMID:22084094
32. Wallbank RWR, Baxter SW, Pardo-Díaz C, Hanly JJ, Martin SH, Mallet J, et al. Data from: Evolutionary Novelty in a Butterfly Wing Pattern through Enhancer Shuffling. Dryad Digit Repos. 2015;http://dx.doi. org/10.5061/dryad.t3r02
33. Pardo-Diaz C, Salazar C, Baxter SW, Merot C, Figueiredo-Ready W, Joron M, et al. Adaptive Introgres-sion across Species Boundaries in Heliconius Butterflies. PLoS Genet. 2012; 8: e1002752. doi:10. 1371/journal.pgen.1002752PMID:22737081
34. Colosimo PF, Hosemann KE, Balabhadra S, Villarreal G, Dickson M, Grimwood J, et al. Widespread Parallel Evolution in Sticklebacks by Repeated Fixation of Ectodysplasin Alleles. Science. 2005; 307: 1928–1933. doi:10.1126/science.1107239PMID:15790847
35. Lamichhaney S, Berglund J, Almén MS, Maqbool K, Grabherr M, Martinez-Barrio A, et al. Evolution of Darwin/’s finches and their beaks revealed by genome sequencing. Nature. 2015; 518: 371–375. doi:
10.1038/nature14181PMID:25686609
36. Fontaine MC, Pease JB, Steele A, Waterhouse RM, Neafsey DE, Sharakhov IV, et al. Extensive intro-gression in a malaria vector species complex revealed by phylogenomics. Science. 2015; 347: 1258524. doi:10.1126/science.1258524PMID:25431491
37. Jeong C, Alkorta-Aranburu G, Basnyat B, Neupane M, Witonsky DB, Pritchard JK, et al. Admixture facilitates genetic adaptations to high altitude in Tibet. Nat Commun. 2014; 5. doi:10.1038/ ncomms4281
38. Lunter G, Goodson M. Stampy: a statistical algorithm for sensitive and fast mapping of Illumina sequence reads. Genome Res. 2011; 21: 936–939. doi:10.1101/gr.111120.110PMID:20980556
39. Baxter SW, Nadeau NJ, Maroja LS, Wilkinson P, Counterman BA, Dawson A, et al. Genomic hotspots for adaptation: the population genetics of Müllerian mimicry in the Heliconius melpomene clade. PLoS Genet. 2010; 6: e1000794. doi:10.1371/journal.pgen.1000794PMID:20140188
40. Drummond AJ, Suchard MA, Xie D, Rambaut A. Bayesian Phylogenetics with BEAUti and the BEAST 1.7. Mol Biol Evol. 2012; 29: 1969–1973. doi:10.1093/molbev/mss075PMID:22367748
41. Gernhard T. The conditioned reconstructed process. J Theor Biol. 2008; 253: 769–778. doi:10.1016/j. jtbi.2008.04.005PMID:18538793
42. Rambaut A, Suchard MA, Xie D, Drummond AJ. Tracer v1. 6. Comput Program Doc Distrib Author Website Httpbeast Bio Ed Ac UkTracer Accessed 27 July 2014. 2014;