HAL Id: hal-01852658
https://hal.archives-ouvertes.fr/hal-01852658
Submitted on 2 Aug 2018HAL is a multi-disciplinary open access archive for the deposit and dissemination of sci-entific research documents, whether they are pub-lished or not. The documents may come from teaching and research institutions in France or abroad, or from public or private research centers.
L’archive ouverte pluridisciplinaire HAL, est destinée au dépôt et à la diffusion de documents scientifiques de niveau recherche, publiés ou non, émanant des établissements d’enseignement et de recherche français ou étrangers, des laboratoires publics ou privés.
Correlating low energy impact damage with changes in
modal parameters: diagnosis tools and FE validation
Amir Shahdin, Joseph Morlier, Hanno Niemann, Yves Gourinat
To cite this version:
Amir Shahdin, Joseph Morlier, Hanno Niemann, Yves Gourinat. Correlating low energy impact damage with changes in modal parameters: diagnosis tools and FE validation. Structural Health Monitoring, SAGE Publications (UK and US), 2011, 10 (2), pp.199-217. �10.1177/1475921710373297�. �hal-01852658�
This is an author-deposited version published in: http://oatao.univ-toulouse.fr/ Eprints ID: 3531
To cite this document: SHAHDIN, Amir, MORLIER, Joseph, NIEMANN, Hanno,
GOURINAT, Yves. Correlating low energy impact damage with changes in modal parameters Diagnosis tools and FE validation. In: Structural Health Monitoring, 2010, ISSN 1475-9217, EISSN 1741-3168
Any correspondence concerning this service should be sent to the repository administrator: [email protected]
Correlating low energy impact damage with changes in modal
parameters: Diagnosis tools and FE validation
Amir Shahdin*, Joseph Morlier1,*, Hanno Niemann* and Yves Gourinat*
* Université de Toulouse, ISAE/DMSM, Campus Supaero, 10 av. Edouard Belin BP54032, 31055 Toulouse, France
1 Corresponding author Email: [email protected], Phone no: + (33) 5 61 33 81 31,
Fax no: + (33) 5 61 33 83 30
Abstract: This paper presents a basic experimental technique and simplified FE based models for the detection, localization and quantification of impact damage in composite beams around the BVID level. Detection of damage is carried out by shift in modal parameters. Localization of damage is done by a topology optimization tool which showed that correct damage locations can be found rather efficiently for low-level damage. The novelty of this paper is that we develop an All In One (AIO) package dedicated to impact identification by modal analysis. The damaged zones in the FE models are updated by reducing the most sensitive material property in order to improve the experimental/numerical correlation of the frequency response functions. These approximate damage models (in term of equivalent rigidity) give us a simple degradation factor that can serve as a warning regarding structure safety.
Keywords: Structural Health Monitoring, Vibration, Model Updating, Topology Optimization
1.
Theoretical Background
1.1 Vibration based damage detection
The process of implementing a damage detection strategy for engineering structure is referred to as Structural Health Monitoring (SHM). The purpose of structural health monitoring systems is to provide information about the condition of a structure in terms of reliability and safety before the damage threatens the integrity of the structure [1,2]. Structural health monitoring is a vast domain and consists of five major steps, (a) detection of damage in a structure (b) localization of damage (c) classification of the damage type (d) quantification of damage severity and (e) prediction of the remaining service life of the structure [3]. The aerospace industry is the one profiting most from the developments in the field of SHM since damage can lead to major failures, therefore these days vehicles involved have regular costly inspections. These commercial and military aircrafts are increasingly using composite materials to take advantage of their excellent specific strength and stiffness properties. Furthermore, damage detection in composites is much more difficult due to the anisotropy of the material and the fact that much of the damage occurs beneath the top surface of the laminate. This level of damage is often referred to as barely visible impact damage (BVID).
There has been considerable research on the impact performance and damage development in composite materials; see for example references [4-6]. Although not visually apparent, low energy impact damage is found to be quite detrimental to the load bearing capacities of composite structures, underscoring the need for reliable damage detection techniques. Currently successful composite non-destructive testing (NDT) techniques for small laboratory specimens, such as radiographic detection (X-ray) and ultrasound testing (C-Scan) are impractical for large components and integrated vehicles.
In recent years, structural health monitoring (SHM) using vibration based damage detection has been rapidly expanding and has shown to be a feasible approach for detecting and locating damage. A detailed and comprehensive overview on the vibration based damage detection methods has been presented in references [7-11]. The basic principle of vibration based damage detection is that due to damage the modal parameters of a structure are affected in such a way that there is most of the time a decrease in natural frequency accompanied by an increase in damping ratio. Shift in natural frequency is the most common parameter used in the identification of damage. A large variety of works can be found in scientific literature related to the study of structural damage by changes in natural frequencies [12-16]. However, in structures made of composite materials there seems to be a tendency to use damping as a damage indicator tool, as it tends to be more sensitive to damage than the stiffness variations, mainly when delamination is concerned. Therefore reliable estimators of damping ratio has been proposed in scientific literature and tend to be a more sensitive damage indicator as compared to natural frequencies for composites materials (laminated, sandwhiches, entangled ) [17-22]. Although vibration-based structural damage detection is an emerging research topic, its development can still be divided into and modern- type. The traditional-type refers to detection method for structural damage by using only the structural characteristics, such as natural frequencies, modal damping, mode shapes, etc. Several modern techniques e.g., statistical process control, neural networks, advanced signal processing, genetic algorithm, wavelet analysis etc., have been researched for detecting damage in composite materials, many of them showing the effectiveness of dynamic response measurements in monitoring the health of engineering structures [23-32]. These methods are generally classified as modern-type methods for damage detection. For diagnosis purpose, we often need a baseline or undamaged state, in this work we propose to update with experimental data pristine and damaged model beam. This process can be use to monitor a laboratory structure over a long time range for example. This kind of work well establishes the relationship between damping and friction surface by correlating models/experiments with the aim of identifying and quantifying impact damages. This All In One (AIO) package dedicated to impact identification using Patran/Nastran/ Boss Quatro/ Samcef by modal
analysis have been validated on various composites beams but will soon be applied to plate. The Model Update part of this work can be viewed as the FE validation of a previous paper [17] but we also propose here a more general framework for composites diagnosis. For larger structures only NDE techniques using distributed sensors have the potential for detecting and characterizing small defects in composites.
1.2 Finite Element based updating for quantification of damage
When any structure vibrates, it makes major problems from discomfort (including noise), malfunction, reduced performance and early breakdown or structural failure. Therefore a thorough understanding of vibrations of the structure is essential. Today two separate tools are used to model the dynamic behavior of structures, namely experimental and analytical tools. The most widely used numerical tool is the Finite Element Method [33-36]. Furthermore, most industrially used Finite Element codes already contain reliable algorithms for modal parameter computation and give reliable results depending on a suitable modeling of the physical problem. Experimental modal analysis coupled with numerical simulations by Finite Element Methods can be found extensively in scientific literature [15,16, 22,37-42]. Changes in vibration parameters, such as frequencies and mode shapes of beams, plates, even rather complicated truss and bridge structures, have been investigated for different types, sizes, and locations of structural defects by Finite Element vibration analysis. Conclusive points from these investigations are (a) the natural frequencies of a degraded structure will usually decrease due to the loss in stiffness caused by the presence of damage, and (b) the higher mode frequencies and mode shapes are more sensitive to damage than the lower mode frequencies but it is difficult to reconstruct experimentally reliable high frequency mode shapes. An interesting case of damage detection and localization has been presented by Yan et al. [43]. They presented an improved method for establishing a dynamic model of a laminated composite vessel with small damage. The method proposed has two steps: (a) directly meshing structure and ignoring existence of structural damage, (b) for those elements in position of structural damage, their element stiffness are adjusted to simulate structural damage. The improved method can greatly decrease the number of required elements for modeling small structural damage, so that the efficiency of dynamic analysis for damaged structures can be increased.
One of the applications of the results of an experimental vibration test is the updating of an analytical model (FE model in our case). Model updating can be defined as adjustment (fit) of an existing FE model which represents the structure under study, using experimental
data, so that it more accurately reflects the dynamic behavior of that structure. Model updating can be divided into three steps: (a) comparison and correlation of two sets of data, (b) locating the errors and (c) correcting the errors. Correlation can be defined as the initial step to assess the quality of the FE model. If the difference between the FE model and experimental data is within some preset tolerances, the analytical model can be judged to be accurate and no updating is necessary. A good overview of updating of FE models in structural dynamics has been provided by Friswell and Mottershead in reference [44]. In spite of extensive research over the last two decades, model updating is still far from mature and no reliable and general applicable procedures have been formulated so far. In this paper, simplified FE based models have been developed in which damage is catered for by locally changing the rigidity (EI) in the damaged zones by minimizing the difference between the experimental and numerical frequency response functions (FRFs). These simplified damage models give us a degradation factor that can help in the quantification of damage.
In using finite element models for damage detection, either few elements or only a part of a structure is usually considered as the damaged region. The small-region damage assumption is valid only when the information on the candidate damaged area is available i.e., through C-scan or X-ray tests. If the damage location is not known beforehand, then this limitation may be overcome by the use of the topology design method for damage detection and localization. The topology design method was originally developed to find an optimal material distribution of a structure having the minimum compliance or maximum eigen-values [45,46]. Subjected to specific constraints and penalizations, an optimal structure can be found by iteratively changing the stiffness of selected elements and deleting elements with low stiffness. In recent years this method has been expanded to fit a lot of different problems [47]. Amongst these are also formulations for matching eigen-values or frequency response function data [48]. This knowledge has been implemented in MSC. Nastran and structural topology optimization is now possible using the implemented optimization libraries [49].
A new approach, using the stiffness related topology optimization variables for localizing damages has been carried out by Lee et al. [50]. Since it has been shown that damage causes changes in modal parameters, therefore Lee et al. [50] formulated a topology design based formulation for the detection of damage, where both resonances and anti-resonances are used as the damage indication modal parameters. An idea to progressively reduce the candidate damaged elements is also developed to improve the accuracy and efficiency of the proposed method. The topology optimization formulation for damage localization described in this paper is based on the works of Lee et al [50], which are implemented in Nastran for general diagnosis purpose. This method is applied to locate damage in composite beams i.e., to validate the ultrasound (C-Scan) results.
In this work we propose a classical finite element baseline model (updated with high quality vibration results) but we also propose an innovative damage localization method to replace NDT. But as this method is not mature, we prefer to update the finite element models with NDT results (both baseline and damage models). Thus we validate our method on updating different beams impacted with different density and level of impact. This preliminary method will help us to develop a smart SHM method to monitor a part of an aircraft structure like a door panel for example.
2.
Material and Specimen
Carbon-fiber/epoxy pre-pregs of T300/914 are used to fabricate the test beams [52]. The material is supplied by Hexcel composites, the physical properties are set out in Table 1. The specimens are processed in a press. The curing cycle of the laminates is 2 h at 180°C with a warming-up cycle of 0.5 h at 135°C. The laminates are cut into beams using a diamond wheel cutter, following the ASTM D3039/D3470 standards.
Table 1 Physical properties of carbon/epoxy pre-pregs of T300/914
Properties Symbol Value
Young’s modulus in fiber direction E1 144000 MPa
Young’s modulus in transverse direction E2 10000 MPa
Shear Modulus G12 4200 MPa
Poisson ratio υ12, υ 23, υ 31 0.25, 0.3, 0.017
Volume density ρ 1550 kg/m3
The composite laminate beams used in this article have a thickness of 3.12 mm having 24 plies. Their geometric configuration and lay-up is listed in Table 2. The lay-up is chosen as such, in which the delamination is said to have more profound effects on the dynamic characteristics [22].
Table 2 Geometry and lay-up of the composite test specimens
Length 480 mm
Width 50 mm
Thickness 3.12 mm Number of layers (plies) 24
Thickness of each ply 0.125 mm Lay-up [(0/90/45/-45)3]s
The vibration tests are carried out with two steel masses (50 x 30 x 10 mm) attached at the ends. The aim of putting these masses at the ends is to enhance the difference in the modal parameters between the undamaged and the damaged test specimens [17,18].
3.
Experimental Set-up
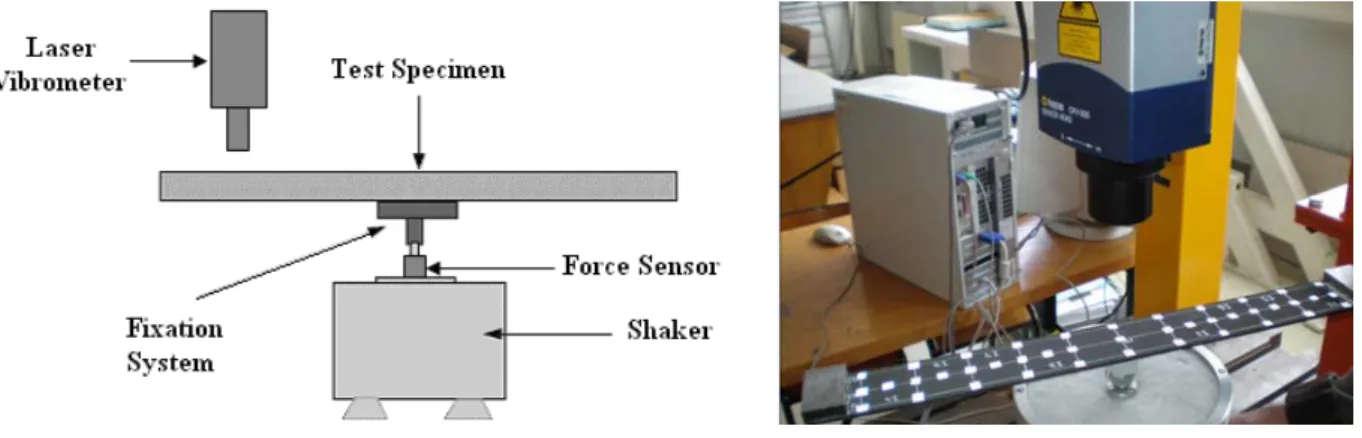
3.1 High Quality Vibration TestsIn order to obtain reliable modal parameters changes we use a non contact Laser Vibrometer and high spatial resolution for increasing the quality of the modal data estimation and mode shape reconstruction. The experimental equipment used for vibration testing is shown in Fig. 1 The experimental set-up is that of a free-free beam excited at its center, based on Oberst method [30]. The Oberst method states that a free-free beam excited at its center has the same dynamical behavior as that of a half length cantilever beam. The test specimen is placed at its center on a B&K force sensor (type 8200) which is then assembled on a shaker supplied by Prodera having a maximum force of 100 N. However the force sensor is not capable of measuring reliable response below 5 Hz. A fixation system is used to place the test specimens on the force sensor. The fixation is glued to the test specimens with a HBM X60 rapid adhesive. The response displacements are measured with the help of a non-contact and high precision Laser Vibrometer OFV-505 provided by Polytec.. Burst random excitation which is a broadband type signal is used. 50% burst percentage is used for burst random excitation. Normally burst random excitations are leakage free but the author after trying different window functions found out that by putting Hanning windows on both the excitation and response signals, better quality signals FRFs are obtained. The signal is averaged 10 times for each measurement point and the frequency band chosen is 0-1600 Hz. A disadvantage of burst random excitation is that it does not take into account the effects of non-linearity, because it is not possible to differentiate between the linear and non-linear effects due to the mixing of the all the frequencies.
Figure 1 Diagram of the experimental set-up for the vibration tests
The center of the composite beams is excited at Point 17 as shown in Fig. 2. The resolution is kept 0.25 Hz to allow a good shape of the resonance peaks at low frequency range and to have a reliable comparison of modal parameters between the two systems.
Response is measured at 33 points that are symmetrically spaced in three rows along the length of the beam to have reliable identifiable mode shapes. The level of the excitation signal is chosen as 1N which is kept fixed during all the vibration tests conducted in this paper.
Figure 2 Composite test-beams with location of damage, excitation and high spatial resolution for 33 measurement points
Modal parameter estimation is carried out with the help of Polymax which is a new non-iterative frequency domain parameter estimation method based on weighted least squares approach. One of the specific advantages of techniques like Polymax lies in the very stable identification of the system poles and participation factors as a function of the specified system order, leading to easy-to-interpret stabilization diagrams. This implies a potential for automating the method and to apply it to "difficult" estimation cases such as high-order and/or highly damped systems with large modal overlap. As Polymax is based on least-squares complex optimization methods, so it calculates the optimal pole value (frequency and damping) based on the 33 measurement points. We do not have access to the average values, variances or standard deviations for the 33 FRFs as the estimated modal parameters are the results of an optimized process. The reference [53] explains Polymax estimator in detail.
3.2 Impact Tests
The impact test system used to damage the composite beams is by a drop-weight system. The impactor tip has a hemispherical head with a diameter of 12.7 mm. The size of the impact window is 80 x 40 mm2 which allows all the impact points to have the same
boundary conditions and all the four ends are clamped. A force sensor (type 9051A) provided by Kistler is placed between the impactor tip and the free falling mass of 2 kg. The impact velocity is measured with the help of an optic sensor. The combined weight of the impact head, freefalling mass, force sensor and the accelerometer is 2.03 kg. Further details on the impact test methodology of this drop tower can be found in the reference [6].
The five composite specimens tested in this article are impacted around the barely visible impact damage limit (BVID). BVID corresponds to the formation of an indentation on the surface of the structure which can be detected by detailed visual inspection and can lead to high damage. In the aeronautical domain, BVID corresponds to an indentation of 0.3 mm after relaxation, aging etc (according to Airbus certifications). In this study, it is decided to take 0.6 mm of penetration depth as detectability criterion just after the impact [6]. As an impact energy of 10 J gives an initial indentation depth of 0.55 mm, so it shall be considered as the BVID limit. Two of the five specimens are impacted with an impact energy (6 and 8 J) below the BVID limit in order to study the damage that is not visible by naked eye, and two (12 and 14 J) above BVID. The impact parameters for the five composite beam specimens studied are listed in Table 3.
Table 3 Impact test parameters
Beam No Energy of Impact (J) Height (mm) Velocity of impact (m/s) measured 1 6 331.8 2.49 2 8 442.3 2.83 3 10 (BVID) 552.9 3.24 4 12 663.5 3.52 5 14 774.1 3.84
The composite beams have three states as shown in Fig. 2. First one is the undamaged state (UD), the second is the damage state due to 4 impacts (D1) and the third is the damage state due to 8 impacts (D2). Vibration tests are carried out after each of these three states. A simple case is studied where the impact points are chosen as such that the damage is symmetric on both sides of the two axes of symmetry.
4.
Diagnosis Methods
4.1. General overview
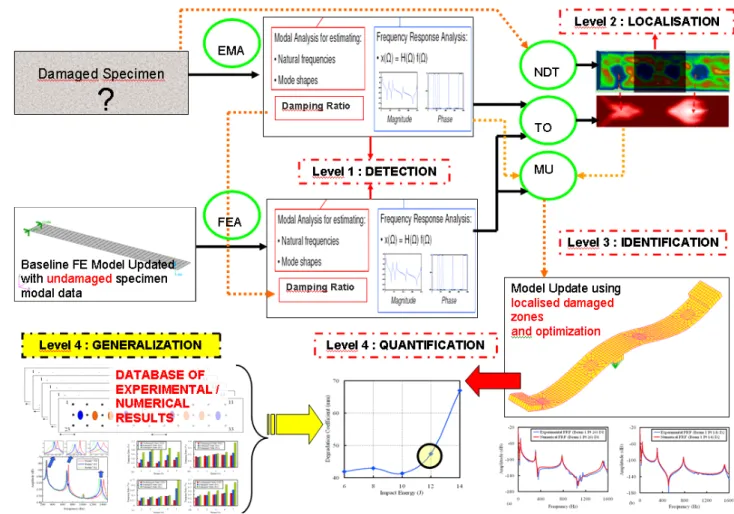
We propose here a more general framework for composites diagnosis experimental modal data and several numerical tools potentially covering SHM levels from level 1 (Detection) to level 4 (Quantification). For this we have developed an All In One (AIO) package dedicated to impact identification using Patran/Nastran/ Boss Quatro/ Samcef described in figure 3. We propose also another solution to quantify damage using a mixed experimental/numerical database of examples of different damage scenarii (type, level, and density of impacts). Learning the impacts effect on composites dynamic behaviour through MLP (MultiLayer
Perceptron), which is a ANN supervised approach capable of establishing any linear or nonlinear relationships between a set of inputs (modal data, damage localization, impact type …) and the outputs (damage quantification and impact force). This approach should be able to identify unknown damage quantification / impact force through the generalization from several database examples (80% of samples used for learning, 20% for quantification).
Figure 3 Principle of damage identification framework. The only a priori information is a baseline model (FEA) and the experimental modal data of the specimen under test. For accomplishing 4 levels of SHM, we propose to use EMA (Experimental Modal Analysis), FEA (Finite Element Analysis) for detection, NDT (Non Destructive Testing by C-scan) and/or TO (Topology Optimization) for damage localization then MU (Model Update) for damage identification. Then we should be soon able to quantify damage and/impact force solving an inverse problem using ANN (Artificial Neural Networks) supervised approach (using experimental/numerical database of examples).
4.2. Detection of damage by pole shift
Detection of damage can be carried out by studying the shift in modal parameters. It has been observed that that with the accumulation of damage in composite beams, there is a decrease in natural frequency accompanied by an increase in damping ratio [17,18]. In order
to explain graphically the shift in modal parameters we shall first study the mathematical representation of an FRF matrix, given in Equation 1.
modes
k 1 R(k) R(k)* H( ) (j (k) p(k)) (j (k) p(k)*)
(1)The numerator R(k) is the residue of the FRF and is a function of the product between mode shape components at all points. The denominator gives the modal frequency and modal damping (second term in Equation (1) is the complex conjugate term also known as poles). The poles p(k), are the roots that satisfy this equation and are related to modal frequency and damping as follows:
p(k) (k) j (k) (2)
The magnitude of each pole is the undamped natural frequency (ωn). The undamped
natural frequency (ωn) is related to the modal damped frequency (ωd) and the modal damping
( ) and also to the mass, stiffness and damping as follows:
2 2 n d K (k) M (3) C 2 (k) M (4)
From these relations it can be observed that a change in stiffness affects only the frequency, while changes in mass and structural damping affect both modal damped frequency (ωd) and
modal damping (). For the damage detection part, the primary interest is to study the decrease in the modal damped frequency (ωd) and the increase in modal damping ( ) due to
damage in the composite beams [54].
4.3. Localization of damage by topology optimization
The localization of damage in composite beams without priori knowledge of its position is carried out by topology optimization in MSC Nastran. The topology optimization uses vibration data for both undamaged and damaged cases. Material is removed in the precise zones of the FE model in order to minimize the error between the experimental and numerical frequency response functions (FRFs), this way an equivalent damage is modeled.
In the beginning, an objective of the topology optimization process has to be identified that is a function of the design variables that are changed in the course of the optimization. As
the main objective of the performed optimizations is the matching of a set of modal parameters, any kind of matching function (e.g. least square formulations) can be considered. In the case of the presented work, a pseudo objective function is chosen, considering the parameters that are to be matched only as constraints. The undertaken approach (Figure 3) is an improvement to the one proposed recently by Lee et al proposed by Niemann et al [51].
Figure 3 Principle of damage localization using topology optimization method. The only a priori information is a baseline model (FEA) and the experimental modal data of the specimen under test [51]. The topology optimizer iterates until it minimizes the difference between experimental and baseline FRF and so on localize equivalent damages.
EQUIVALENT DAMAGE
Damaged Specimen
?
H
i
j
The chosen pseudo objective function is given in Equation (5), where f is the original objective function and P a penalty function consisting of a set of inequality or equality constraints, which are g and h respectively. The parameter rp is a further penalization
coefficient that can be applied to the constraints.
)) ( ), ( , ( ) ( ) ( : min x f x P rp h x g x (5)
The methodology consists of locally altering the stiffness of the elements in the FE model. The design variable is the relative density of each element e as stated in Equation (6).
0
e e
Since the variable is normalized by the original densities, it can only assume values between 0 and 1, as stated in the side constraints. Due to numerical reasons, 0 is replaced by a minimum threshold. This design variable is then multiplied by the corresponding element’s stiffness and mass and thereby alters the properties of the element (Equation 7).
0 E x Ee ep and m x m0 (7) q e e
The design variable is also being penalized, which is supposed to help in getting a clearer solid-void solution by making intermediate design variables more "costly". The values of the penalization exponents p and q are problem-dependent, but a penalization factor of about 3 is generally proposed in common literature [48].
Next step is to define the constraints based on modal parameters, where the primed value always denotes the reference data of the damaged structure, and the plain value corresponds to the current data of the optimized model. Since the goal is to minimize the difference between these values, a proximity is usually defined. The first set of constraint equations requires the chosen angular resonance frequencies to be within the proximity of corresponding resonance frequencies of the damaged structure (Equation 8).
g n (2 2)2 i i i g for i1,2,...,n (8)
The second used set of constraint consists of the magnitude value of the nodal FRF (of an FE node) at a certain excitation frequency . It is required to be within the proximityj H
of that of the damaged structure at the same frequency.
kl j kl j
HH
j H H
g ( ) ( ) for j1,2,...,nH (9)
where the suffix k is the excitation and l is the measurement DOF.
This tool help us to approximate the localization of multi site damages by using one a priori information (baseline model) and experimental data (specimen under vibration test) [53]. The topology optimizer iterates until it minimizes the difference between experimental and baseline FRF and so on localize equivalent damages by local loss of rigidity/mass.
4.4. Quantification of damage by updating of FE models
The aim of this section is to develop Finite Element models that represent damaged composite beams in vibrations. These simplified damage models give us a degradation factor that can help us quantify damage in composite beams. The updating of the FE models by parametric studies developed in Samcef shall be carried out in Boss Quattro. The theoretical aspects of the methodology used can be found in the reference [36]. It can be found on numerous occasions in scientific literature that local damage in a structure always causes reduction of local structural stiffness, so that these variations can be denoted by reduced material coefficients at the local damaged zone. Therefore in order to avoid the above mentioned problems due to direct meshing, dynamics model of a damaged structure can be established using the modified material elastic coefficients in local damage position of the structure. This way it may not be necessary to depict the geometry of small damage. Our methodology takes into account the following to factors:
a) the material property most sensitive to shift in modal parameters
b) damaged area based on ultrasound tests for high correlation results (more precise than topology optimization results)
In order to model a composite laminate beam in a FE software the following three material properties are required: (a) Longitudinal Elastic Modulus (EL), (b) Transverse Elastic
Modulus (ET) and (c) Shear Modulus (G). By carrying out several trail tests by varying
individually the above three material properties, it was found that the Longitudinal Elastic Modulus (EL) is by far the material property which has the most profound effects on the
natural frequencies. These trial tests are performed in the parametric module of Boss Quattro by using Samcef’s DYNAM module. The frequency response functions (FRFs) are calculated by the harmonic REPDYN module in Samcef.
Based on the trial test results, it was decided that in order to keep the damage modeling methodology simple, only the Longitudinal Elastic Modulus (EL) shall be varied in
case of the composite laminate beams. Trial tests also proved that the variations of Transverse Elastic Modulus (ET) and the Shear modulus (G) have a very small effect on the natural
frequencies. Before explaining the updating methodology the author would like to underline certain assumptions undertaken to simplify the approach.
a) the shape of the damaged zones is approximated as circular
b) same damaged area is taken for all the impact points for the same beam as they have been impacted with the same energy level
c) unfortunately the C-scan results did not give sufficient information regarding the position of damage in the thickness (number of damaged plies) due to low-impacts, therefore it has been assumed that the damage is same in all the thickness
The results of the ultrasound (C-Scan) and radiographic tests for the composite laminate Beam 2 for half beam length, impacted at 8J are shown in Fig. 4. The calculated damaged area (conventional controlled area) is also indicated for each impact point.
Figure 4 Calculation of the damaged surface for the composite laminate Beam 2 for half beam length impacted at 8 J (a) Ultrasound (C-Scan) results (b) Radiographic results
As seen in Fig 4, that the calculated damaged area does not show a large dispersion between the four impacted points as they are impacted with the same energy. The procedure of estimating a circular shape zone from the ultrasound and radiographic test results is that in the first step, average value of the damaged area is calculated by taking the mean of the damaged area for the four impact points shown in Fig. 4.
Average Damaged Area for Beam 10 = 595 2
4 mm
Mean (10)
Next this average damaged area is equated to the area of a circle as follows:
2
2 ( )
595mm radius where radius14mm (11)
A complete finite element model of the shell composite laminate beam with 3D end-masses and a 3D base block is shown in Fig. 5 a. The three parts of the composite laminate beams are modeled as follows: (a) Composite beam is modeled (ply by ply) by using
quadrangular Mindlin shell elements, (b) Steel End masses and aluminum base block (for fixing the beam on the shaker) are modeled with 3D brick elements. Trial FE tests have also been carried out by modeling the composite beam in 3D. No significant difference in result is observed by modeling the composite beam by shell or 3D elements. The main advantage of using Mindlin shell elements for the composite part is to reduce the calculation time.
The circular damage zones approximated from the C-Scan results are also shown in blue in Fig. 5 a along with a close up of the mesh around the circular damage zone in Fig 5 c. Triangular elements have been avoided to minimize the risk of computation error due to twisting distortion, therefore only quadrangular elements are used for higher precision. In order to calculate the dynamic response, the composite laminate beam models are excited by a harmonic force of constant amplitude. This excitation force is applied to a node situated 20mm below the center of the base block and is rigidly linked to the bottom nodes of the base block as shown in Fig. 5 b. For the excitation node, all the degrees of freedom (DOFs) are fixed except the translation in Z direction, which signifies the direction of force generated by the shaker.
(a)
(b) (c)
Figure 5 Modeling methodology of damage in Samcef (a) Composite laminate beam model with end masses and base block showing the damaged zones and the excitation (b) Application of harmonic load at the excitation node situated 20 mm beneath the center of the base block (c) Close-up of the mesh around the position of damage where the material properties shall be reduced to simulate the damaged case
For the elements in the damage zone (shown in blue in Fig. 5 a and Fig. 5 c), the Longitudinal Elastic Modulus (EL) is adjusted to simulate damage in the following way:
EL(Undamaged).EL(Damaged) (12)
where is the Longitudinal Elastic Modulus (EL) elements in the impacted zone
(shown in blue in Fig. 5 a and Fig. 5 c) with some damage, is the one for elements without damage and
) (Damaged EL ) (Undamaged EL
is a damage modification coefficient. This way by reducing the material properties by the coefficient in the impacted zones (based on C-Scan results), damage can be simulated in structures relatively easily without facing the problems of excessive gridding number due to direct meshing, as discussed in detail by Yan et al [43]. The change in mass due to damage is negligible; therefore it has not been taken into account. An overview of the updating procedure is shown in the Flow Chart in Fig. 6 by taking into account the damage modification coefficient to simulate the damaged cases:
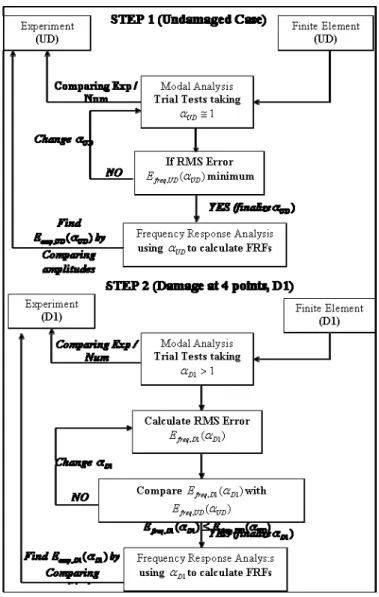
Just to remind the readers that the composite laminate beams have three states, undamaged state (UD), damage at four impact points (D1) and damage at eight impact points (D2). The FE modeling at updating results shall be discussed separately for each case. When establishing a FE model for a damaged test-beam, different values of coefficient are tried (by parametric study in Boss Quattro) until the smallest statistical (root mean square RMS) error is reached between the experimentally and numerically obtained natural frequencies. The statistical error for the undamaged case (UD) is defined in Equation (13) as follows:
N k k UD EXP UD k UD FEM UD UD freq f f N E 1 2 , , , ( ) 1 ) ( (13)whereEfreq,UD(UD) is the statistical error (RMS) between the experimentally obtained natural frequencies and the Finite Element based ones , for the undamaged case (UD) for the kth mode where N is the total number of modes considered.
k UD EXP
f , fFEMk ,UD
In our case, the first four bending modes are studied (Biggest participation factor in term of displacement). Usually the MAC (Modal Assurance Criterion) indicator tool is used to correlate the experimental / numerical mode shapes. By using the same Equation (13) statistical error can be calculated between the natural frequencies for the damaged cases as well. In order to have a better experimental/numerical correlation, the following updating procedure shall be used:
First of all FE models are built for the five composite beams for the undamaged case by considering 1UD in Equation (13).
For the undamaged case, different values of UDclose to 1 are tried and for each
iteration result the statistical error Efreq,UD(UD)is calculated.
When the statistical error Efreq,UD(UD) reaches a minimum value, the corresponding
UD
value can be taken as the required coefficient UD for simulating the undamaged
case (UD).
Once the modification coefficient UD is finalized by using the DYNAM module, the frequency response functions (FRFs) are calculated by the REPDYN module by using the corresponding experimentally obtained damping ratios.
Once the undamaged state FE model is finalized, the same procedure is repeated again for the damaged case.
Parametric studies are carried out to find the modification coefficient D1 for the
damaged state D1, by comparing the natural frequencies between the FE model and the experimental ones.
The statistical error Efreq,D1(D1) for the damaged case (D1) is calculated for each iteration and compared with that of the undamaged caseEfreq,UD(D1).
The aim is to find Efreq,D1(D1)as close as possible toEfreq,UD(UD).
By finalizing the modification coefficient D1 for the damaged state D1, the FRFs are then
calculated and compared with those obtained experimentally
For the second damage state (D2), the same value of the modification coefficient is used i.e.,D1 D2as the four additional impacts have been carried out with the same impact
energy and the same updating procedure is followed.
5.
Application to composite beams
5.1. Damage detection by frequency and damping changes
Frequency and damping changes are studied with the help of the first four bending modes as they have the largest amplitudes for the type of test configuration presented. As discussed previously, damage in a material generally leads to an increase in damping and a decrease in natural frequency, as discussed in Section 4.1. For the 2nd bending mode, the
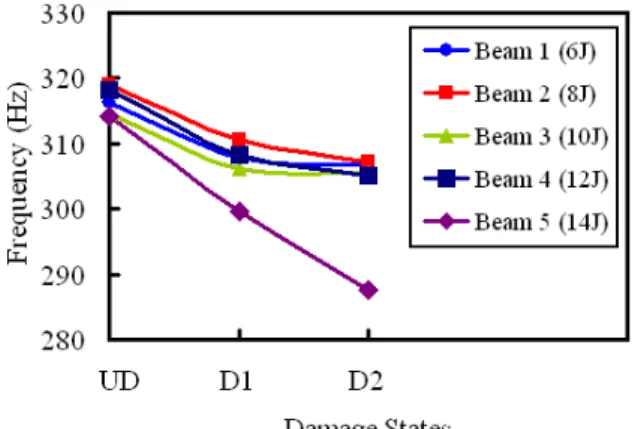
variation of natural frequency as a function of the undamaged (UD) and the two damage states (D1 and D2) is presented in Fig. 7.
Figure 7 Variation of damped natural frequencies with damage states for 2nd bending mode: UD is the undamaged state, D1 is the damaged state at four impact points and D2 is the damaged state at eight impact points
Fig. 7 shows that the decrease in natural frequencies with the increase in damage is more significant for higher impact energies (greater damage). In case of Beams 1-4, the trend of decrease in frequency with damage is relatively small, but the trend increases consistently with the damage level. It can be concluded that the four beams (Beams 1-4) remain relatively intact and do not possess a large amount of damage. However, Beam 5 damaged at impact energy of 14 J, which induced damage well above the BVID limit, has a more significant
change in natural frequencies as compared to the other beams. Similar results are obtained for the 3rd and 4th bending modes. Fig 7 shows a slight discrepancy between the modal parameters at the undamaged state. This anomaly outlines the inherent possibility of false negatives which can arise due to boundary conditions and gives no indication of damage when it is present as discussed in the reference [32].
Fig. 8 shows that the damping ratio increases with increase in damage in the five beams for Mode 1. Similar results are obtained for the other three modes. However unlike natural frequencies, the increase in damping ratio between the damaged and the undamaged states is not always consistent with the impact energy level (damage level), due to the complex nature of damping and the difficulties in its estimation. Results have also underlined damping as the modal parameter more sensitive to damage than the natural frequency [17, 18].
Figure 8 Variation of damping ratios (%) estimated by Polymax for the five composite beams for 1st bending mode where ‘UD’ is the undamaged state, ‘D1’ is the damaged state at four points and ‘D2’ is the damaged state at eight points
5.2. Damage localization by topology optimization
For the instance, the topology optimization algorithm is applied on the composite laminate beam 2 impacted at 8 J. If reliable results are obtained then this study shall be carried out on the other composite laminate beams as well in future. Constraints for the optimization problem are based on natural frequencies and FRFs that have been obtained by vibration tests. It has to be reminded, that as the ultrasound results are only available for half length of the beam so the topology optimization results are also shown for one half as well. As the beams are considered to be symmetrical, thus each side of the beam has undergone two and four impacts, respectively. The topology optimization results for the damage state D1 (2 exterior impacts on half beam length) in comparison with the ultrasound results are shown in Fig. 9.
Figure 9 Comparison between C-Scan results (top) and topology optimization (bottom) for the damage state D1 - The two middle impact points are blackened as they correspond to the damage state D2. Equivalent damage zone is identified using circle fitting matlab function and permits to estimate the radius of damage zone (yellow circles).
Fig. 9 shows that for the first two impacts, the right locations have been found effectively with relatively similar sizes. As the ultrasound images that have been produced after vibration testing, therefore the outer two impact damage points have been introduced first (D1) and the two inner impacts later (D2) as shown in Fig. 9. Ultrasonic tests are only performed after all other testing has been completed.
In case of the damaged state D2 with four impact sites for half-beam length, only an uncertain region of damage with lower densities is located, but not the discrete impact points as shown in the ultrasound result. The presented topology optimization approach is also limited to modal parameter shifts due to loss of stiffness and mass, and does not take into account damping which as proved by the experimental results is more sensitive to damage than stiffness changes. In the current formulation it is not possible to consider changes in damping as constraints in the optimization, since no response for damping is available so far in Nastran. In this work we propose only the feasibility on one beam experiment (damage state D1) of topology optimization method to localize damage. Next results (Quantification of damage) will be established using NDT data only.
5.3. Quantification of damage by updating
The updating procedure explained in Section 4.3 will now be applied to five composite beams in order to quantify damage with the help of a degradation factor. Average damaged area and the radius of the approximated circular zone based on the procedure explained previously, for the five composite laminate beams (Beams 1-5) is given in Table 4.
Table 4 FE parameters for the five composite laminate beams Beam No Impact Energy
J
Average Damaged Area mm2
Radius of the circular damage zone mm 1 6 545.0 13.17 ≈ 13 mm 2 8 567.5 13.44 ≈ 13 mm 3 10 900.1 16.93 ≈ 17 mm 4 12 976.3 17.63 ≈ 18 mm 5 14 1041.3 18.21 ≈ 18 mm
Modeling of the dynamic response and the updating procedure for Beams 4 and 5 (relatively highly damaged) shall be explained in detail whereas at the end, the results for Beams 1, 2 and 3 will be summarized by following the same procedure.
Beam 4 (12 J)
The damage zones for Beam 4 are modeled by approximating the shape of the real damaged surface to a circle of 18 mm radius. For the elements in the damage zone (shown in blue in Fig. 5 a and Fig. 5 c), their element stiffness matrices (Longitudinal Elastic Modulus EL) are adjusted to simulate damage by following the procedure explained in Section 4.3. For
the undamaged case, the modification coefficient UD is taken equal to 1. Modal analysis is
carried out and the statistical error Efreq,UD(UD) is calculated between the experimental and numerical natural frequencies. For the damaged cases, D1 D2 is calculated with the help of Equation (12). The experimental and numerical comparison of the natural frequencies for the three states (UD, D1 and D2) along with the modification coefficients and statistical errors is shown in Table 5.
.
Table 5 Comparison of experimental and numerical natural frequencies for Beam 4 impacted at 12 J for the undamaged state (UD) and the two damage states (D1 and D2) along with the statistical error and the modification coefficient
Natural Frequencies (Hz)
Undamaged (UD) Damaged (D1) Damaged (D2) Bending Modes No Exp Num (FE) Exp Num (FE) Exp Num (FE) 1 41.5 41.7 39.8 39.0 39.1 39.3 2 319.0 319.4 308.2 303.1 305.1 301.5 3 802.1 800.9 773.1 765.0 760.2 761.0 4 1543.7 1537.8 1477.7 1480.4 1465.9 1478.4 UD 1.00 D1 2.63 D2 2.63 ) ( ,UD UD freq E 11.24 Efreq,D1(D1) 9.32 Efreq,D2(D2) 12.53
In the next step, frequency response (harmonic) analysis is carried out to calculate the frequency response functions (FRFs). Comparison of the experimental and numerical (FE) FRFs for Beam 4 for the damage states D1 and D2 is shown in Fig. 10. It can be seen that a good correlation is obtained between the experimental and numerical FRFs in case of Beam 4.
Figure 10 Comparison of experimental/numerical FRFs for Beam 4 impacted by clamping all four ends for the damaged states D1 and D2 for the measurement points 4 and 32 respectively
Beam 5 (14 J)
Same procedure is followed in case of Beam 5 impacted at 14 J. The experimental and numerical comparison of the natural frequencies for the three states (UD, D1 and D2) along with the modification coefficients and statistical errors is shown in Table 6. Furthermore, comparison of the experimental and numerical (FE) FRFs for Beam 5 for the undamaged state UD and the two damage states D1 and D2 is shown in Fig. 11.
Table 6 Comparison of experimental and numerical natural frequencies for Beam 5 impacted at 14 J for the undamaged state (UD) and the two damage states (D1 and D2) along with the statistical error and the modification coefficient
Natural Frequencies (Hz)
Undamaged (UD) Damaged (D1) Damaged (D2) Bending Modes No Exp Num (FE) Exp Num (FE) Exp Num (FE) 1 41.2 41.5 40.5 38.2 38.5 37.7 2 318.1 318 301.2 295.1 287.8 293 3 799.5 797.5 707.1 748.4 698 734.8 4 1531.2 1531.2 1475.4 1452.7 1361.7 1394.2 UD 1.00 D1 3.72 D2 3.72 ) ( ,UD UD freq E 1.12 Efreq,D1(D1) 23.79 Efreq,D2(D2) 24.69
Figure 11 Comparison of experimental/numerical FRFs for Beam 5 impacted at 14 J for the undamaged state UD and damaged states D1 and D2 for the measurement points 8, 26 and 14
Beam 5 impacted at 14 J has a relatively high damage level as compared to the rest. Beam 5 had an initial indentation depth of 1.1 mm which is nearly twice of the BVID limit. The higher damage in this beam is also evident in the C-scan results in Fig. 12. Furthermore, as damage increases there is less possibility that it remains localized. The damage zones can get merged and there can be one big damage zone in place of several small ones.
Figure 12 Ultrasound (C-Scan) results showing the calculated damaged surface for the composite laminate beam 5 impacted at 14 J by clamping all four ends for half beam length
But the real picture of the implications of high damage which introduces significant structural non-linearities is provided by the vibration test results. In case of Beam 5, the frequency shift between the states UD and D1 for the third bending modes is 92 Hz, whereas the same for the fourth bending mode is 56 Hz. Logically the frequency shift for the higher modes is always greater as observed in case of all the other beams previously. This aberration can also be attributed to the greater damage zone in Beam 5. This effect can be observed in the FRFs in Fig. 12 b and c, which show that in the presence of relatively higher damping the resonance peaks become considerably rounded at higher frequencies (above 400 Hz). The high statistical errorsEfreq,D1(D1)and )Efreq,D2(D2 in Table 6 are also due to the extraordinary decrease of the bending mode 3 which due to some unknown non-linear phenomenon is hard to simulate numerically. It can be concluded that the damage modeling approach presented in this paper is limited to structures having small damage, where the behavior remains more or less linear. Once the level of damage goes well beyond that corresponding to the BVID limit, this approach starts showing deficiencies.
A comparison of the modification coefficients and statistical errors between experimental and numerical natural frequencies for the Beams 1-3 for the undamaged state (UD) and the two damage states (D1 and D2) are given in Table 7. The statistical errors are successfully minimized and a good correlation between experimental and numerical FRFs is obtained as well. Due to space limitations comparison of FRFs cannot be provided.
Table 7 Comparison of the modification coefficients and the statistical errors for composite laminate beams 1-3 for the undamaged state (UD) and the two damage states (D1 and D2)
Modification Coefficients and Statistical Errors
Undamaged (UD) Damaged (D1) Damaged (D2) Beam No. UD Efreq,UD(UD) (Hz) 1 D Efreq,D1(D1) (Hz) 2 D Efreq,D2(D2) (Hz) 1 1.03 8.76 3.22 6.25 3.22 4.43 2 1.00 11.07 3.30 10.17 3.30 10.29 3 1.08 11.24 2.43 9.32 2.43 12.53
Evaluation of the degradation factor for the quantification of damage
In order to have a better idea about the level of damage induced by impacting at different energies, it will be interesting to plot the variation of the modification coefficient with the impact energies. However, the modification coefficient cannot be plotted directly
with the impact energies because it does not take into account the damaged area, and also all the beams do not have the same damaged area. To remedy this, a degradation factor is introduced which is a multiple of the modification coefficient with the radius of the circular damage zone (R). The degradation factor is given in Table 8 for the five beams and gives us an idea regarding the quantification of damage in composite beams.
Table 8 Calculation of the degradation factor for the composite laminate beams (Beams 1-5)
Beam. No Impact Energy (J) Radius (R) of the circular damage zone (mm) Modification Coefficient 2 1 D D Degradation Coefficient (mm) R D1 1 6 13 3.22 41.8 2 8 13 3.30 42.9 3 10 17 2.43 41.3 4 12 18 2.63 47.3 5 14 18 3.72 66.9
The variation of the degradation coefficient D1R with the impact energy levels for the five composite beams is plotted in Fig. 14.
Figure 13 Variation of degradation factor (D1R) with impact energy for the composite
laminate beams (Beams 1-5)
Fig 13 shows that up to the BVID limit (Beams 1-3) for the impact energies 6, 8 and 10J, the degradation coefficient varies very little. In case of Beam 4 (12 J), which is impacted slightly above the BVID limit the degradation coefficient is slightly bigger. But Beam 5 which showed considerable non-linear behavior as discussed previously possesses a remarkably high degradation coefficient.
As discussed previously, unfortunately the C-Scan results due to low-velocity impacts did not give us the position of damage in the thickness. In future, the composite laminate
beams will be cut around the impacted zones and viewed under a high quality microscope to determine the location and shape of damage. Then the reduction of EI will be done only in the damaged plies and not in the whole thickness to improve the calculation of degradation factor and to have a better quantification of damage.
6.
Conclusion
Cost-effective and reliable damage detection is critical for the utilization of composite materials. Detection, localization and quantification of impact damage in composite beams is carried out by a high quality experimental technique and simplified FE based models (for diagnosis only). A more realistic damage model taking into account uncertainties should be developed in the future. The composite beams have been damaged by drop-weight tests around the BVID level. Detection of damage is carried out by shift in modal parameters. With the accumulation of damage in the specimens, there is a decrease in natural frequency accompanied by an increase in damping ratio. Localization of damage is carried out by topology optimization but any reliable damage localization algorithm can be used. Model update is done by using damaged zone extracted from NDT results for a more precise quantification of damage. Using only a reference baseline model and experimental modal data it gives us a degradation factor that can serve as a warning regarding structure safety. So the preliminary work of developing an All In One (AIO) package dedicated to BVID identification by modal analysis for beams is a success. Once the level of damage goes well beyond that corresponding to the BVID limit, this approach starts showing deficiencies because the structure becomes nonlinear, so another approach should be developed. Further works will focus on a plate validation in order to monitor the dynamic behavior of a composites airplane door panel for example.
Acknowledgments
The authors gratefully thank Associate Professors C. Bouvet and F. Lachaud from Université de Toulouse for their help during the numerical work.
Nomenclature
BR = Burst random testing SD = Sine-dwell testing UD = undamaged state
D1 = damaged state at 4 points D2 = damaged state at 8 points FRF = Frequency Response Function
H(ω) = Frequency Response Function matrix j = Imaginary axis in the complex plane * = Complex conjugate
ω(k) = Modal damped frequency for kth mode (rad/s) p(k) = Pole location for the kth mode
R(k) = Residue magnitude (FRF/s)
(k) = Modal damping for kth mode ωn = Undamped natural frequency (rad/s)
ωd = Damped natural frequency (rad/s)
C = Structural damping matrix (force/velocity) K = Stiffness matrix (force/displacement) M = Mass matrix
fk = Resonance frequency (Hz) for the kth mode
k = Damping ratio (%) for the kth mode = Modification coefficient
) (
freq
References
[1] Farrar CR, Worden K. An introduction to structural health monitoring. Philosophical Transactions of the Royal Society A 2007;365:303-315.
[2] Van der Auweraer H. International research projects on structural damage detection. Key Engineering Materials 2001;204(2):97–112.
[3] Farrar CR, Lieven AJ. Damage prognosis: the future of structural health monitoring. Philosophical Transactions of the Royal Society A 2007;365:623-632.
Schubel PM, Luo JJ, Daniel IM. Impact and post impact behaviour of composite sandwich panels. Composites Part A 2007;38:1051–1057.
[4] Abrate S. Impact on composite structures. Cambridge University Press 1988.
[5] Gay D, Hua SV. Composite Materials: Designs and Applications (2nd edition). CRC Press (2007).
[6] Petit S, Bouvet C, Bergerot A, Barrau JJ. Impact and compression after impact experimental study of a composite laminate with a cork thermal shield. Composites Science and Technology 2007;67:3286-3299.
[7] Zou Y, Tong L, Steven GB. Vibration-based model-dependent damage (delamination) identification and health monitoring for composite structures. A review. Journal of Sound and Vibration 2000;230:357-378.
[8] Yan YJ, Cheng L, Wu ZY, Yam LH. Development in vibration-based structural damage detection technique. Mechanical Systems and Signal Processing 2007;21:2198-2211. [9] Doebling SW, Farrar CR, Prime MB, Shevitz DW. Damage identification and health monitoring of structural and mechanical systems from changes in their vibration characteristics: a literature review. Research Report LA-13070-MS ESA-EA Los Alamos National Laboratory (1996).
[10] Sohn H, Farrar CR, Hemez FM, Shunk D, Stinemates DW, Nadler BR. A review of structural health monitoring literature: 1996-2001. Los Alamos National Laboratory Report LA-13976-MS
[11] Carden EP, Fanning P. Vibration based condition monitoring: A review, Structural Health Monitoring 2004;3(4):355–377.
[12] Salawu OS. Detection of structural damage through changes in frequency: a review. Engineering Structures 1996;19(9):718–23.
[13] Khoo LM, Mantena PR, Jadhav P. Structural damage assessment using vibration modal analysis. Structural Health Monitoring 2004;3(2):177-194.
[14] Gadelrab RM. The effect of delamination on the natural frequencies of a laminated composite beam. Journal of Sound and Vibration 1996;197(3):283-292.
[15] Yam LH, Cheng L. Damage detection of composite structures using dynamic analysis. Key Engineering Materials 2005;295-296:33-39.
[16] Kim HY, Hwang W. Effect of debonding on natural frequencies and frequency response functions of honeycomb sandwich beams. Composite Structures 2002;55:51-62. [17] Shahdin A, Morlier J, Gourinat Y. Correlating low energy impact damage with changes in modal parameters: A preliminary study on composite beams. Structural Health Monitoring.2009; 8: 523-536.
[18] Shahdin A, Morlier J, Gourinat Y. Damage monitoring in sandwich beams by modal parameter shifts: a comparative study of burst random and sine dwell vibration testing. Journal of Sound and Vibration, Volume 329, Issue 5, 1 March 2010, Pages 566-584
[19] Shahdin A, Mezeix L., Bouvet C., Morlier J, Gourinat Y. Monitoring the effects of impact damages on modal parameters in carbon fiber entangled sandwich beams,Engineering Structures, Volume 31, Issue 12, December 2009, Pages 2833-2841
[20] Zhang Z, Hartwig G. Relation of damping and fatigue damage of unidirectional fibre composites. International Journal of Fatigue 2004;24:713-738.
[21] Gibson RF. Modal vibration response measurements for characterization of composite materials and structures, Composites Science and Technology 2000;60:2769-2780.
[22] Saravanos DA, Hopkins DA. Effects of delaminations on the damped dynamic characteristics of composites. Journal of Sound and Vibration 1995;192:977-993.
[23] Fugate ML, Sohn H, Farrar CR. Vibration-based damage detection using statistical process control. Mechanical Systems and Signal Processing 2001;15(4):707-721.
[24] Waldron K, Ghoshal A, Schulz MJ, Sundaresan MJ, Ferguson F, Pai PF. Chung JH. Damage detection using finite elements and laser operational deflection shapes. Journal of Finite Elements in Analysis and Design 2002;38:193-226.
[25] M.J. Sundaresan MJ, P.F, Pai PF, A. Ghoshal A, M.J Schulz MJ, F. Ferguson F, J. Chung J. Methods of distributed sensing for health monitoring of composite material structures. Composites A Journal 2001;32:1357-1374.
[26] LeClerc JR, Worden K, Staszewski WJ, Haywood J. Impact detection in an aircraft composite panel – a neural network approach. Journal of Sound and Vibration 2007;299(3): 672-682.
[27] Banks HT, Inman DJ, Leo DJ, Wang Y. An experimentally validated damage detection theory in smart structures. Journal of Sound and Vibration 1996;191:859–880.
[28] Yan YJ, Yam LH. Online detection of crack damage in composite plates using embedded piezoelectric actuators/sensors and wavelet analysis. Composite Structures 2002; 58(1):29–38.
[29] Kao CY, Hung SL. Detection of structural damage via free vibration responses generated by approximating artificial neural networks. Computers & Structures 2003;81(28– 29):2631–2644.
[30] Wojtowicki JL, Jaouen L. New approach for the measurements of damping properties of materials using oberst beam. Review of Scientific Instruments 2004;75(8):2569-2574. [31] Vanhoenacker K, Schoukens J, Guillaume P, Vanlanduit S. The use of multisine excitations to characterise damage in structures. Mechanical Systems and Signal Processing 2004;18:43-57.
[32] Mattson SG, Pandit SM. Damage detection and localization based on outlying residuals. Smart Materials and Strcutures 2006;15:1801-1810.
[33] Cook RD. Concepts and applications of finite element analysis, John Wiley and Sons, 2nd edition, 1981.
[34] Bathe KL. Finite element procedures in engineering analysis. Prentice- Hall, 1982. [35] Zienkiewicz OC, Taylor RL. The Finite Element Method. MacGraw-Hill 4th edition, 1986.
[36] Remouchamps A, Radovcic Y. Theoretical aspects about optimization methods and algorithms. Boss Quattro V5, SAMTECH. (2003).
[37] Montalvao D, Ribeiro AM, Duarte-Silva J. A method for the localization of damage in a CFRP plate using damping. Mechanical Systems and signal Processing (2008) doi:10.1016/j.ymssp.2008.08.011.
[38] Kessler SS, Spearing SM, J. Attala M, Cesnik CES, Soutis C. Damage detection in composite materials using frequency response. Composites Part B 2002;33:87-95.
[39] Yam LH, Wei Z, Cheng L. Non-destructive detection of internal delamination by vibration-based method for composite plates. Journal of Composite Materials 2004;38(24):2183-2198.
[40] Yang S, Gibson RF, Gu L, Chen WH. Modal parameter evaluation of degraded adhesively bonded composite beams Composite Structures 1998;43:79-91.
[41] Hou JP, Jeronimidis G. Vibration of delaminated thin plates. Composites Part A 1999;30:989-995.
[42] Zhang XY, Yang CH. Recent developments in finite element analysis for laminated composite plates. Composite Structures 2009;88:147-157.
[43] Yan YJ, Lam LH. FEM modeling method of damage structures for structural damage detection. Composite Structures 2004;72:193-199.
[44] Friswell MI, Mottershead JE. Finite element model updating in structural dynamics Springer 1995.
[45] Bendsoe MP, Kikuchi N. Generating optimal topologies in structural design using a homogenization method. Computer Methods in Applied Mechanics in Engineering 1992;35:1487–1502.
[46] Bendsoe MP. Optimal shape design as a material distribution problem. Structural Optimization 1989;1:193–202.
[47] Bendsoe MP, Sigmund O. Topology Optimization-Theory, Methods and Applications. Springer Verlag, 2003.
[48] Ma ZD, Kikuchi N, Hagiwara I. Structural topology and shape optimization for a frequency response problem. Computational Mechanics 1993;13:157–174.
[49] MSC. Software Corporation. Users Guide for Topology Optimization (2007).
[50] Lee JS, Kim JE, Kim YY. Damage detection by the topology design formulation using modal parameters. International Journal for Numerical Methods in Engineering 2007;69:1480–1498.
[51] H. Niemann, J. Morlier, Joseph, A. Shahdin, and Y. Gourinat, (In Press: 2010) Damage localization using experimental modal parameters and topology optimization. Mechanical systems and signal processing .
[52] HexPly 914. Data Sheet, Hexcel Composites, F.R
[53] B. Peeters, H. V. Auweraer, P. Guillaume, J. Leuridan. The PolyMAX frequency-domain method: a new standard for modal parameter estimation, Shock and Vibrations 11 (2004) 395-409.
[54] Schwarz BJ, Richardson MH. Experimental modal analysis. CSI Reliability week Orlando FL (1999).


![Figure 3 Principle of damage localization using topology optimization method. The only a priori information is a baseline model (FEA) and the experimental modal data of the specimen under test [51]](https://thumb-eu.123doks.com/thumbv2/123doknet/12295967.323658/13.892.118.795.249.656/principle-localization-topology-optimization-information-baseline-experimental-specimen.webp)