HAL Id: hal-01251051
https://hal-mines-paristech.archives-ouvertes.fr/hal-01251051
Submitted on 5 Jan 2016HAL is a multi-disciplinary open access archive for the deposit and dissemination of sci-entific research documents, whether they are pub-lished or not. The documents may come from teaching and research institutions in France or abroad, or from public or private research centers.
L’archive ouverte pluridisciplinaire HAL, est destinée au dépôt et à la diffusion de documents scientifiques de niveau recherche, publiés ou non, émanant des établissements d’enseignement et de recherche français ou étrangers, des laboratoires publics ou privés.
Solubilities of Carbon Dioxide and Oxygen in the Ionic
Liquids Methyl Trioctyl Ammonium Bis
(trifluoromethylsulfonyl) imide, 1-Butyl-3-Methyl
Imidazolium Bis (trifluoromethylsulfonyl) imide, and
1-Butyl-3-Methyl Imidazolium Methyl Sulphate
Indra Bahadur, Khalid Osman, Christophe Coquelet, Paramespri Naidoo,
Deresh Ramjugernath
To cite this version:
Indra Bahadur, Khalid Osman, Christophe Coquelet, Paramespri Naidoo, Deresh Ramjugernath. Sol-ubilities of Carbon Dioxide and Oxygen in the Ionic Liquids Methyl Trioctyl Ammonium Bis (tri-fluoromethylsulfonyl) imide, 1-Butyl-3-Methyl Imidazolium Bis (tri(tri-fluoromethylsulfonyl) imide, and 1-Butyl-3-Methyl Imidazolium Methyl Sulphate. Journal of Physical Chemistry B, American Chemical Society, 2015, 119 (4), pp.1503-1514. �10.1021/jp5061057�. �hal-01251051�
1
Solubilities of Carbon Dioxide and Oxygen in the Ionic Liquids Methyl
Trioctyl Ammonium Bis (trifluoromethylsulfonyl) imide, 1-Butyl-3-Methyl
Imidazolium Bis (trifluoromethylsulfonyl) imide, and 1-Butyl-3-Methyl
Imidazolium Methyl Sulphate
Indra Bahadur,† Khalid Osman,† Christophe Coquelet,‡, † Paramespri Naidoo,† Deresh Ramjugernath,*,†
†
Thermodynamics Research Unit, School of Engineering, University of KwaZulu-Natal, Howard College Campus, King George V Avenue, Durban, 4041, South Africa
‡
Mines-Paristech CEP/TEP, 35, rue Saint Honoré, 77305 Fontainebleau, France
2
ABSTRACT:
Ionic liquids (ILs) are being considered as solvents for gas absorption processes as they have the potential, in general, for improved efficiency of gas separations, as well as lower capital and operating costs compared to current commercial processes. In this study the solvent properties of ILs are investigated for use in the absorption of carbon dioxide (CO2) and
oxygen (O2). The absorption of these gases in ILs was measured in a temperature range of
303.15 to 333.15 K and at pressures up to 1.5 MPa by gravimetric analysis. The ILs used were: methyl trioctyl ammonium bis (trifluoromethylsulfonyl) amide [MOA][Tf2N],
1-butyl-3-methyl imidazolium bis (trifluoromethylsulfonyl) amide [BMIM][Tf2N] and
1-butyl-3-methyl imidazolium 1-butyl-3-methyl sulphate [BMIM][MeSO4]. The measurement technique
employed in this study is fast, accurate, and requires small quantities of solvent. The results indicated that absorption of both gases increased with a decrease in operating temperature and an increase in pressure. [MOA][Tf2N] had the highest CO2 and O2 solubility.
[BMIM][Tf2N] was determined to have the highest selectivity for CO2 absorption.
[BMIM][MeSO4] achieved the lowest CO2 absorption with a moderate O2 absorption,
revealing this IL to be the least desirable for CO2 and O2 absorption. Calculation of Henry’s
law constants for both gases in all ILs at all isotherms confirmed the deductions made from absorption data analysis. The absorption data was modelled using the generic Redlich-Kwong cubic equation of state (RK-EOS) coupled with a group contribution method.
3
1. INTRODUCTION
Recent research has shown that the main contributor to an increased rate and extent of global climate change, are CO2 emissions from various fossil fuel industries including fossil
fuel-fired power plants, coal-to-liquids (CTL) and gas-to-liquids (GTL) industries, steel and cement industries.3 Thus, numerous studies have been undertaken to investigate different techniques for capturing CO2 from flue gas emitted by these industries, and thereafter storing
the CO2 underground or by other means, thereby preventing its emission into the atmosphere.
Despite significant research however, a technique with low energy penalty to feasibly capture CO2 still remains to be found.
A common CO2 capture technique closest to commercialisation is the use of solvents to
selectively absorb CO2 from flue gas emitted by fossil fuel industries. Current and
conventional solvents include alkanolamines and carbonate-based solvents. These solvents however possess numerous disadvantages, including high corrosiveness, low absorption capacity and high energy requirements for desorption and recycling. Moreover, these solvents have proven to be volatile under industrial flue gas conditions, which has serious repercussions with regard to human health and the environment.1,2 In some cases, the adverse effects of these solvents on human health, safety, and the environment, combined with their volatility and flammability, has led to legislation to minimize their use.4
A relatively new type of solvent known as ionic liquids, has received much attention in recent years. Ionic liquids are molten salts that typically have melting points below 373.15 K.8 The specific advantages of ionic liquids is that many can be tuned to have negligible vapour pressure,9 good dissolution characteristics,10 and are non-flammable11 and non-toxic12, depending on the cation and anion used. It is for these reasons, that many ionic liquids have
4
been regarded as ―green‖ solvents, which can possibly replace more hazardous conventional solvents in many chemical processes, including CO2 capture5-7. There are literally thousands
of ionic liquids which can be synthesized, tested, and optimized for thermal, mechanical and chemical stability, and suitable density for various applications.14
Gas absorption measurements in ionic liquids can provide information about the interaction such as dipole-dipole interactions that exist between these gases and ionic liquids.22 These studies can also provide important information about the original solvent behaviour of ionic liquids.22 Absorption data for many gas-ionic liquid systems are scarce compared to systems utilising conventional physical and chemical solvents. Research has however been conducted at an accelerated pace as the potential of ionic liquids becomes known.23-32
Numerous sources in literature have investigated ionic liquids for their absorption capacity of CO2. CO2 mole fractions were measured by gravimetric analysis in a variety of fluorinated
and non-fluorinated ionic liquids at temperatures of 283.15-333.15 K and pressures up to 90 bar by Anderson et al.50 and Muldoon et al.34. Significant focus was made on CO2 mole
fraction measurement in non-fluorinated ionic liquids by Palgunadi et al.35 and Zhang et al.37, at atmospheric pressure and temperatures of 298.15-334.15 K. Shiflett and Yokozeki49, Arshad38, and Hasib-ur-Rahman et al.39 considered fluorinated imidazolium-based ionic liquids in their studies, at temperatures of 298.15-348.15 K and 0.1-800 bar. Anderson et al.50 utilised a Rubotherm for high pressure VLE measurement.
5
The aim of this study was to measure CO2 and O2 absorption in Methyl trioctyl ammonium
bis (trifluoromethylsulfonyl) imide ([MOA][Tf2N]), 1-butyl-3-methyl imidazolium bis
(trifluoromethylsulfonyl) imide ([BMIM][Tf2N]) and 1-butyl-3-methyl imidazolium methyl
sulphate ([BMIM][MeSO4]). While CO2 absorption in [BMIM][Tf2N] is well measured34, O2
absorption has not. The measurement of O2 absorption is important since flue gas from coal
power plants may contain up to 5% unreacted O2 (by volume), and solvents need to be highly
CO2 selective to enable the efficient recovering of pure CO2 for disposal. Moreover, CO2 and
O2 absorption in the relatively new ionic liquids had not been measured previously.
Absorption measurements were performed by gravimetric analysis using an Intelligent Gravimetric Analyser (IGA-001) to determine the absorption isotherm of CO2 and O2 in the
above three ionic liquids .at temperatures of 303.15, 313.15, 323.15 and 333.15 K and pressures up to 1.5 MPa. The Henry’s law constant for both gases in all ionic liquids at all isotherms were calculated. The absorption data was modelled using a generic RK-EOS with the aid of a group contribution method. The 3D structure of the ionic liquids is given in Figure 1. The effect of cation, anion and the operating conditions on absorption of CO2 and
O2 in fluorinated and non-fluorinated ionic liquids were analysed, together with the CO2
selectivity of each ionic liquid over O2.
2. EXPERIMENTAL PROCEDURE 2.1 Materials
Carbon dioxide (CO2) and oxygen (O2) were obtained from Afrox Ltd (South Africa) with a
6
[BMIM][Tf2N] and [BMIM][MeSO4] were obtained from Sigma-Aldrich, with a minimum
purity of 98.0 %. Characterization of the chemicals is provided in Table 1.
2.2 Experimental Procedure
2.2.1 Density and Refractive Index Measurements
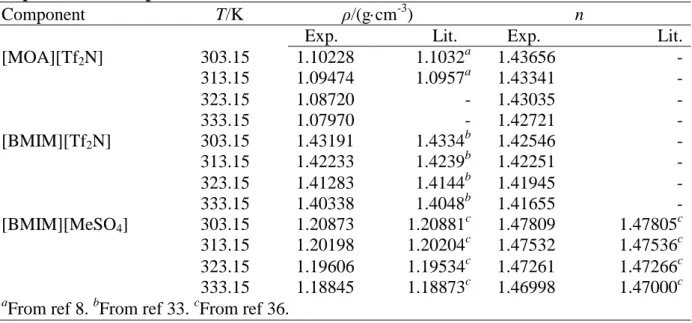
The measurements of density (ρ) and refractive index (n) of the pure ionic liquids were undertaken using a digital vibrating-tube densimeter (Anton Paar DMA 5000) and refractometer (ATAGO, model RX-7000a, Japan), respectively with an accuracy of ± 0.03 K in temperature. The estimated accuracy in density and refractive index was ± 0.00003 g∙cm-3 and ± 0.00005, respectively. The experimental density (ρ) and refractive index (n) of pure ionic liquids together with literature8,33,36 densities (ρ) and refractive index (n) are given in Table 1. Moreover, the water content was determined using a Metrohm 702 SM Titrino Meter and was found to be 400 ppm in [MOA][Tf2N], 600 ppm in [BMIM][Tf2N] and 500ppm in
[BMIM][MeSO4]. Samples were degassed before measurement as explained below.
2.2.2 Gas Absorption and Desorption Measurements
Gas absorption and desorption measurements of various gases in ionic liquids were conducted by gravimetric analysis using an Intelligent Gravimetric Analyser (IGA-001) built by Hiden Analytical Ltd. A quantity of approximately 70 to 100 mg of solvent was typically loaded onto a stainless steel sample holder which was then loaded into a stainless steel reactor. The sample holder was attached to tungsten and gold wire leading up to a microbalance which has a resolution of ±0.001 mg. The weight of the sample holder is countered using a counterweight so that only the sample weight may be tracked.
Each sample was degassed in the apparatus to ensure the removal of all volatile impurities using a Vacuubrand GMH-MD1 vacuum pump and an Edwards WRGS-NW35
7
turbomolecular pump to achieve ultra-high vacuum of 1x10⁻⁴ Pa. The apparatus can operate in the pressure range of (0.05 to 1.50) MPa using two pre-calibrated pressure controllers and in the temperature range from (293.15 to 773.15) K using a Polyscience SD07R-20 refrigerated recirculating water bath and a Severn TF50/3/12/F furnace. A Pt100 probe with a resolution of ±0.01 K is located inside the reactor next to where the sample holder is suspended. Pressure was measured using a pressure transmitter with a resolution of ±1x10⁻⁶ MPa. Once loaded, the sample was degassed. Thereafter, the gas was introduced and controlled at the desired pressure and temperature. The low quantity of sample required and the programmable nature of the apparatus through the use of IGA software provided by Hiden Isochema Ltd., made absorption measurements efficient and less time consuming. Each data point took 1 to 4 hours to ensure equilibrium. Figure S-1 in supporting information illustrates the sample weight change with time for CO2 in [MOA][Tf2N] at 303.15 K and at
0.05MPa, with that particular point taking approximately 1 hour for equilbirum due to small sample size and efficient temperature and pressure control. The absorption and desorption isotherms at 303.15, 313.15, 323.15 and 333.15 K were measured. Pressures of 0.050 – 1.500 MPa were considered in the case of CO2, whilst in the case of O2 it is 0.050 – 0.700 MPa due
to limitations of gas regulation.
Due to the sample being of liquid form, there was a significant change in the sample density due to the absorption of the injected gas, thus making the sample more buoyant and altering the actual weight reading of the sample. The weight reading was hence not a true reflection of the actual mass of gas absorbed. To correct this, the buoyancy force was taken into account by first noting the weight reading of the sample at different gas pressures using a non-absorbent gas such as nitrogen or helium. The method of buoyancy correction is supplied as supporting information. Buoyancy correction is also explained in Macedonia et al.48.
8
Absorption measurements were conducted and analysed with the data discussed in this study. Desorption measurements were also conducted however, to confirm the potential recyclability of the ionic liquids as solvents.
3. RESULTS AND DISCUSSION
The absorption and desorption of CO2 and O2 in [MOA][Tf2N], [BMIM][Tf2N] and
[BMIM][MeSO4] were determined by gravimetric analysis using an Intelligent Gravimetric
Analyser (IGA). Systems with a fixed overall equilibrium composition of CO2 and O2 in
[MOA][Tf2N], [BMIM][Tf2N] and [BMIM][MeSO4] were measured as a function of
temperature and pressure are given in Tables 2-7. Figures 3-8 graphically show CO2 and O2
absorption and desorption in [MOA][Tf2N], [BMIM][Tf2N] and [BMIM][MeSO4] at
different temperatures as a function of pressure. Desorption measurements showed no consistent pattern of being higher than absorption measurements. Hysterisis is minimal, indicating that CO2 can be fully desorbed and recovered using these ionic liquids. From
Figures 3-8, it can be seen that the absorption of both gases at all partial pressures was the highest at a lower temperature T = 303.15 K, and lowest at a higher temperature T = 333.15 K for each ionic liquid. This behaviour has also been observed in literature for other solvents including ionic liquids, confirming that absorption is an exothermic process. 49 Another observation of the absorption results, which is also consistent with literature5,7,22 is that an increase with gas partial pressure results in higher gas absorption for each ionic liquid. Additionally, the effect of cation and anion on absorption of gases in ionic liquids was studied and summarized in Figures 9 and 10, respectively.
Regarding the three ionic liquids studied in this work, two contain the same fluorinated anions [Tf2N] but different class of cation such as [MOA], [BMIM] and two ionic liquids
9
have same cation [BMIM] but different anions of [Tf2N] and [MeSO4]. The molar masses are
648.85, 419.36 and 250.32 g∙mol-1 for [MOA][Tf2N], [BMIM][Tf2N] and [BMIM][MeSO4],
respectively. By using the density data, we calculated the molar volumes of these ionic liquids at T = 303.15 K and it was found that the molar volume decreases in the following order: [MOA][Tf2N] (588.64 cm3∙mol-1) > [BMIM][Tf2N] (292.87 cm3∙mol-1) >
[BMIM][MeSO4] (207.09 cm3∙mol-1). It is known that the absorption of gases in ionic liquids
is mainly affected by two factors: (i) interaction between the gas and the anion of the ionic liquids and (ii) the molar volume of ionic liquids22,50.
Regarding CO2 absorption, Figures 3-5 show that [MOA][Tf2N] achieved the highest CO2
absorption at each temperature and partial pressures studied, followed by [BMIM][Tf2N],
with [BMIM][MeSO4] achieving the lowest CO2 absorption. This is because of the effect of
cation, anion and molar volume of ionic liquids.
Figure 9 provides a further comparison of CO2 absorption in the ionic liquids measured in
this study to that of those measured in literature. It was found that CO2 absorption in
[MOA][Tf2N] was higher than absorption in other ionic liquids such as [BMIM][PF6] and
also [HMIM][Tf2N]. The [Tf2N] anion is more highly fluorinated than the [PF6] anion, and
the [MOA] cation is larger than the [HMIM] cation. Further suggesting that CO2 absorption
is higher with increasing fluorination and cation chain length. It was also observed that [MOA][Tf2N] achieved higher CO2 absorption than [HMPY][Tf2N] even when the CO2
absorption in [HMPY][Tf2N] was measured at lower temperature. This may either illustrate
the effect of increasing cation chain length, or prove that ammonium based cations achieve superior CO2 absorption over the imidazolium or pyridinium-based cations. CO2 absorption
10
Figure 10 illustrates that [BMIM][Tf2N] achieves higher CO2 absorption than
[HMPY][Tf2N]. This is evident in that [BMIM][Tf2N] achieves equal CO2 absorption to that
of [HMPY][Tf2N] even though absorption in [BMIM][Tf2N] was measured at a higher
temperature. This suggests that imidazolium cations achieve higher CO2 absorption than
pyridinium cations. However, this is inconclusive since measurements at 333.15 K find similar CO2 absorption achieved between [BMIM][Tf2N] and [BMPY][Tf2N]. Comparisons
between measured and literature values at 323.15 K show CO2 absorption to occur the
highest in [HMIM][Tf2N], followed by [BMIM][Tf2N] and thereafter [BMIM][PF6],
confirming with good certainty that increased fluorination of the cation achieves increased CO2 absorption and particular cation types, higher cation chain lengths increase CO2
absorption. This confirms findings from other literature as well23,51 that a larger chain length of the cation in an IL results in higher absorption being achieved.
The effect of the anion on CO2 absorption can be confirmed by also comparing the measured
results between [BMIM][Tf2N] and [BMIM][MeSO4] seen in Figures 4 and 5, where
[BMIM] [Tf2N] achieved higher CO2 absorption than [BMIM][ MeSO4]. This is because
[BMIM][Tf2N] has a higher molar volume and greater interaction between CO2 and [Tf2N]
than [MeSO4] anion, due to increased fluorination.
As far as molar volume was concerned, it is proposed that ionic liquids with higher molar volume would achieve greater absorption of a gas solute.22,50,52-54 This may be because increasing the molar volume of ionic liquids increases the void space (free volume), 55,45 and gasesappear to be dissolvedby occupying these free spaces available in ionic liquids.55,46,56
11
It is clear from the result that the absorption of CO2 in the tested ionic liquids decrease in
order: [MOA][Tf2N] > [BMIM][Tf2N] > [BMIM][MeSO4] being possible to achieve
maximum mole fractions of absorbed CO2 corresponding to 0.343, 0.283, and 0.138,
respectively at T = 303.15 K and 1.5 MPa. The superior CO2 absorption achieved by
[MOA][Tf2N]and [BMIM][Tf2N] confirms that ionic liquids with fluorinated anions achieve
higher CO2 absorption than ionic liquids with non-fluorinated anions. The study also found
that [MOA][Tf2N] achieved higher CO2 absorption at T = 323.15 K than more conventional
ionic liquids such as [BMIM][BF4] and [BMIM][PF6] as measured by (Shiflett and
Yokozeki)49 and [HMIM][Tf2N] by Anderson et al.,50
Regarding O2 absorption, Figure 7 shows a favourable comparison of measurements done in
this work, with measurements conducted by Anthony et al (2005)22 at 323.15K. Data was especially comparable at low pressure while some deviation occurred at higher pressure of 0.7 MPa. This suggests that the technique of gravimetric analysis using N2 for buoyancy
correction may be accurate for systems O2 especially at pressure below 0.4 MPa.
Figures 6-8, show that [MOA][Tf2N] achieved the highest O2 absorption at each temperature
and partial pressure studied, followed by [BMIM][MeSO4] with [BMIM][Tf2N] achieving the
lowest O2 absorption. Figure 9 shows the effect of cation on O2 absorption. From Figure 9 it
can be seen that [MOA][Tf2N] achieved the higher O2 absorption than [BMIM][Tf2N] due to
the same effects that occurred for CO2 absorption.
A short comparison with literature is illustrated in Figure 11. It can be observed that [MOA][Tf2N] not only achieved the highest O2 absorption of all ionic liquids in this work,
12
suggests that ammonium cations may be less CO2 selective than imidazolium and pyridinium
cations.
An observation of Figures 6 to 8 shows that [BMIM][ MeSO4] achieved higher O2
absorption than [BMIM][Tf2N]. These results show that the anions have a much larger effect
on the O2 absorption. The absorption of O2 in ionic liquids decrease in order: [MOA][Tf2N]>
[BMIM][MeSO4] > [BMIM][Tf2N] being possible to achieve maximum mole fractions of
absorbed/desorbed O2 corresponding to 0.023, 0.013, and 0.006, respectively at T = 303.15 K
and 0.7 MPa.
Furthermore, the ionic liquid [MOA][Tf2N] achieved the highest CO2 and O2 absorption,
indicating that this ionic liquid may not necessarily be favourable for gas separation processes appreciable amounts of both CO2 and O2, due to its low selectivity. By contrast,
[BMIM][Tf2N] achieved the 2nd highest CO2 absorption capacity and the lowest O2
absorption capacity, indicating that this ionic liquid is more selective towards CO2 absorption
and is hence more applicable in CO2 capture processes.
An effective way of comparing ionic liquids and solvents for gas absorption is to calculate the Henry’s law constant, KH, of the absorbed gas in the binary system at each temperature.
gas gas T t, gas,solven H x P K (5)
13
Table 8 contains Henry’s law constant values measured in MPa for CO2 and O2 in all three
ionic liquids and at each isotherm. A high deviation of 0.4 MPa is noted, due to higher Henry’s law constants calculated at pressures of 1.3 and 1.5 MPa. . Nevertheless, a comparison of Henry’s law constants confirms the conclusions drawn from the absorption measurements. The high selectivity of [BMIM][Tf2N] for CO2 absorption is ascertained by
comparing the Henry’s constants of CO2 and O2 for all isotherms.
Table 9 contains Enthalpy and Entropy of absorption for CO2 and O2 in all ionic liquids.
Results for [BMIM][Tf2N] compare favourably with Arshad (2009)38. Enthalpy and Entropy
of absorption values show that CO2 absorption in [MOA][Tf2N] is the least sensitive to
temperature, while absorption in [BMIM][MeSO4] is the most sensitive. The opposite is true
in the case of O2 absorption, although comparatively the high enthalpies and entropies of
absorption for O2 indicate low O2 solubility in relation to CO2 in these ionic liquids.
4. CORRELATION OF ABSORPTION DATA
The modelling of gas absorption in ionic liquids has been reported in numerous literature sources. More complex models take into account the asymmetry or cations and anions, as well as dipole and quadrupolar interactions.
Due to the relative simplicity of the ionic liquid species in this study in terms of asymmetry, absorption data of CO2 and O2 in all ionic liquids was successfully correlated using a much
14
applied successfully for ionic liquids containing fluorinated anions and imidazolium cations23: ) ( ) ( b V V T a b V RT P (6)
where a(T) in eq 6, is a function of temperature and species mole fraction. For the components in this work, the Van der Waals-Berthelot mixing formula was used as successfully applied for similar systems.23,57
j
i j 1 , j j i 1 1 ) ( k x x T a a T a i N j i i
where
j ij i ji j i ji j ij x l x l x x l l k i (7) T P T R a i ci 2 ci 2 i 0.427480 where
3 0 k C C k i k T T T T T (8) and
N j i i k x x m b b b 1 , j i ij j j i 1 1 2 1 where ci ci i 0.08664 P RT b (9)lij, lji, kij, and mij are binary interaction parameters with mij = mji and mii = 0. Coefficients βk
are treated as adjustable fitting parameters. As with many other ionic liquids, critical temperature and pressure could not be found in literature for the ionic liquids in this study. This is due to ionic liquids decomposing before reaching their critical point.
Critical temperature and pressure were thus computed using a modified Lydersen-Joback-Reid group contribution method: 58,59
2 M M M M b C T n T n B A T T where Tb 198 .2
nTbM (10)
2 M M C
P n C M P (11)15
where AM = 0.5703, BM = 1.0121, CM = 0.2573, EM = 6.75. n is the number of occurrences of
any particular functional group in the molecule. Group contributions of ∆TbM are provided in
the work of Alvarez and Valderrama.58
In this study, we modelled the absorption of CO2 and O2 in all three ionic liquids. Model
parameters are provided as supporting information in Table S1 while estimated critical properties are shown in Table S2.
Figures 3 - 8, illustrate the model-calculated CO2 and O2 partial pressure using parameters
obtained by data regression, in comparison to the measured data. It is evident that model estimates compare quite favourably with measured data. The root-mean-square error for each system is provided in Table 9, showing very good accuracy of model estimates, which is consistent with the work of Shiflett and Yokozeki49 for CO2 absorption in [BMIM][PF6] and
[BMIM][BF4].
It is observed from Figures 6 - 8 that O2 absorption decreases significantly with increasing
temperature. The temperature effect is far more pronounced than with CO2 absorption. As a
result modelling of the data became more difficult, and while Table 9 contains regressed parameters for CO2 absorption in all ionic liquids, common for all temperatures, parameters
16
5. CONCLUSIONS
Absorption measurements of CO2 and O2 in the ionic liquids [MOA][Tf2N], [BMIM][Tf2N]
and [BMIM][MeSO4] have been reported. The data of each isotherm was confirmed to incur
low hysterisis. The ionic liquid [MOA][Tf2N] achieved the highest CO2 and O2 absorption
from all the ionic liquids studied and some other ionic liquids compared in the literature, which indicates good CO2 solubility but undesirably low CO2 selectivity The ionic liquid
[BMIM][Tf2N],although having not achieved the highest CO2 absorption of the three ionic
liquids studied, was found the most suitable for CO2 absorption from flue gas due to its
higher selectivity of CO2 over O2.. The calculation of Henry’s law constants for CO2 and O2
in all ionic liquids at all isotherms confirmed the findings made by analysis of the absorption data, and provide an effective numerical comparison of ionic liquids performance as gas absorbents. A further analysis of enthalpy and entropy of absorption revealed solubility in [BMIM][MeSO4] to be highly temperature sensitive. The generic RK-EOS model achieved
accurate estimates for all systems studied, with a root mean square error of no higher than 1.98 kPa. The model was found to be more robust for systems containing CO2, while
parameter regression became more temperature sensitive with systems containing O2.
AUTHOR INFORMATION
Corresponding Author
*E-mail: ramjuger@ukzn.ac.za (D. Ramjugernath). Tel.: +27 (31) 2603128. Fax: +27 (31) 2601118.
17
Notes
The authors declare no competing financial interest.
ACKNOWLEDGMENTS
The authors acknowledge University of KwaZulu-Natal for a doctoral scholarship for Mr K. Osman and postdoctoral scholarship for Dr I. Bahadur. This work is based upon research supported by the South African Research Chairs Initiative of the Department of Science and Technology and the National Research Foundation.
REFERENCES
(1) Bretherick, L. ed. Hazards in the Chemical Laboratory, 6th edition. Royal Society of
18
(2) Valavavanidis, A.; Basic Principles of Health and Safety in Chemical and Biochemical Laboratories. Information for toxic substances. Department of Chemistry, University of Athens, Athens, 2006 (www.chem.uoa.gr).
(3) IPCC. In Climate Change 2007: The Physical Science Basis. Contribution of Working
Group I to the Fourth Assessment Report of the Intergovernmental Panel on Climate Change;
Cambridge University Press: Cambridge, U.K., and New York, 2007.
(4) Govinda, V.; Reddy, P. M.; Bahadur, I.; Attri, P.; Venkatesu, P.; Venkateswarlu, P. Effect of anion variation on the thermophysical properties of triethylammonium based protic ionic liquids with polar solvent. Thermochim. Acta 2013, 556, 75–88.
(5) Tang, S.; Baker, G. A.; Zhao, H. Ether- and alcohol-functionalized task-specific ionic liquids: attractive properties and applications. Chem. Soc. Rev. 2012, 41, 4030–4066.
(6) Davis, J. H. Task-specific ionic liquids, Chem. Lett. 2004, 33, 1072–1077.
(7) Rodríguez, H.; Brennecke, J. F. Temperature and composition dependence of the density and viscosity of binary mixtures of water + ionic liquid. J. Chem. Eng. Data 2006,
51, 2145–2155.
(8) Deenadayalu, N.; Bahadur, I.; Hofman, T. Ternary excess molar volumes of {methyltrioctylammonium bis(trifluoromethylsulfonyl)imide + ethanol + methyl acetate, or ethyl acetate} systems at T = (298.15, 303.15, and 313.15) K. J. Chem. Thermodyn. 2010,
42, 726–733.
(9) Bahadur, I.; Deenadayalu, N. Apparent Molar Volume and Isentropic Compressibility for the Binary Systems {Methyltrioctylammonium Bis(trifluoromethylsulfonyl)imide + Methyl Acetate or Methanol} and (Methanol + Methyl Acetate) at T = 298.15, 303.15, 308.15 and 313.15 K and Atmospheric Pressure. J Solution Chem. 2011, 40, 1528–1543.
19
(10) Bahadur, I.; Deenadayalu, N. Apparent Molar Volume and Apparent Molar Isentropic Compressibility for the Binary Systems {Methyltrioctylammonium bis(trifluoromethylsulfonyl)imide + Ethyl Acetate or Ethanol} at Different Temperatures under Atmospheric Pressure. Thermochim. Acta 2013, 566, 77–83.
(11) Deenadayalu, N.; Bahadur, I.; Hofman, T. Ternary Excess Molar Volumes of {Methyltrioctylammonium Bis[(trifluoromethyl)sulfonyl]imide + Methanol + Methyl Acetate or Ethyl Acetate} Systems at (298.15, 303.15, and 313.15) K. J. Chem. Eng. Data 2010, 55, 2636–2642.
(12) Wood, N.; Stephens, G. Accelerating the discovery of biocompatible ionic liquids.
Phys. Chem. Chem. Phys. 2010, 12, 1670–1674.
(13) Bahadur, I.; Deenadayalu, N.; Tywabi, Z.; Sen, S.; Hofman, T. Volumetric properties of ternary (IL + 2-propanol or 1-butanol or 2-butanol + ethyl acetate) systems and binary (IL + 2-propanol or 1-butanol or 2-butanol) and (1-butanol or 2-butanol + ethyl acetate) systems.
J. Chem. Thermodyn. 2012, 49, 24–38.
(14) Dreisbach, F.; Meister, D.; Lösch, H. W.; Weißert, T.; Petermann, M. Ionic liquids for gas separation: Measurement of selective gas solubilities of the gas-mixture CH4/CO2.
http://www.merrowscientific.com/Portals/55675/docs/Ionic_Liquids.pdf 2013.
(15) Wasserscheid, P.; Welton, T. Ionic Liquids in Synthesis. Wiley-VCH: Weinheim, Germany, 2003.
(16) Plechkova, N. V.; Seddon, K. R. Applications of Ionic Liquids in the Chemical Industry. Chem. Soc. Rev. 2008, 37, 123–150.
(17) Palomar, J.; Torrecilla, J. S.; Ferro, V.; Rodriguez, F. Development of an a Priori Ionic Liquid Design Tool. 1. Integration of a Novel COSMO-RS Molecular Descriptor on Neural Networks. Ind. Eng. Chem. Res. 2008, 47, 4523–4532.
20
(18) Palomar, J.; Torrecilla, J. S.; Ferro, V.; Rodriguez, F. Development of an a Priori Ionic Liquid Design Tool. 2. Ionic Liquid Selection through the Prediction of COSMO-RS Molecular Descriptor by Inverse Neural Network. Ind. Eng. Chem. Res. 2009, 48, 2257– 2265.
(19) Holbrey, J. D.; Seddon, K. R. Ionic Liquids. Clean Products Processes 1999, 1, 223– 236.
(20) Welton, T. Room-Temperature Ionic Liquids. Solvents for Synthesis and Catalysis.
Chem. Rev. 1999, 99, 2071–2083.
(21) Wasserscheid, P.; Keim, W. Ionic liquid-new ―solution‖ for transition metal catalysis.
Angew. Chem., Int. Ed. Engl. 2000, 39, 3773–3789.
(22) Anthony, J. L.; Anderson, J. L.; Maginn, E. J.; Brennecke, J. F. Anion Effects on Gas Solubility in Ionic Liquids. J. Phys. Chem. B 2005, 109, 6366–6374.
(23) Shiflett, M. B.; Yokozeki, A. Solubility of CO2 in Room Temperature Ionic Liquid
[hmim][Tf2N]. J. Phys. Chem. B 2007, 111, 2070–2074.
(24) Almantariotis, D.; Stevanovic, S.; Fandiño, O.; Pensado, A. S.; Padua, A. A. H.; Coxam, J.-Y.; Gomes, M. F. C. Absorption of Carbon Dioxide, Nitrous Oxide, Ethane and Nitrogen by 1-Alkyl-3-methylimidazolium (Cnmim, n = 2, 4, 6) Tris (pentafluoroethyl)
trifluorophosphate Ionic Liquids (eFAP). J. Phys. Chem. B 2012, 116, 7728−7738.
(25) Gonzalez-Miquel, M.; Bedia, J.; Abrusci, C.; Palomar, J.; Rodríguez, F. Anion Effects on Kinetics and Thermodynamics of CO2 Absorption in Ionic Liquids. J. Phys. Chem. B
2013, 117, 3398−3406.
(26) Kumełan, J.; Kamps, Ä. P.-S.; Tuma, D.; Yokozeki, A.; Shiflett, M. B.; Maurer, G. Solubility of Tetrafluoromethane in the Ionic Liquid [hmim][Tf2N]. J. Phys. Chem. B 2008,
21
(27) Zhou, L.; Fan, J.; Shang, X.; Wang, J. Solubilities of CO2, H2, N2 and O2 in ionic
liquid 1-n-butyl-3-methylimidazolium Heptafluorobutyrate. J. Chem. Thermodyn. 2013, 59, 28–34.
(28) Afzal, W.; Liu, X.; Prausnitz, J. M. Solubilities of some gases in four immidazolium-based ionic liquids. J. Chem. Thermodyn. 2013, 63, 88–94.
(29) Oh, D.-J.; Lee, B.-C. High-pressure phase behavior of carbon dioxide in ionic liquid 1-butyl-3-methylimidazolium bis(trifluoromethylsulfonyl)imide. Korean J. Chem. Eng. 2006,
23, 800–805.
(30) Sa´nchez, L. M. G.; Meindersma, G. W.; De Haan, A. B. Solvent properties of functionalized ionic liquids for CO2 absorption. Chem. Eng. Res. Des. 2007, 85, 31–39.
(31) Raeissi, S.; Florusse, L. J.; Peters, C. J. Hydrogen Solubilities in the IUPAC Ionic Liquid 1-Hexyl-3-methylimidazolium Bis(Trifluoromethylsulfonyl)Imide. J. Chem. Eng.
Data 2011, 56, 1105–1107.
(32) Ren, S.; Hou, Y.; Tian, S.; Chen, X.; Wu, W. What Are Functional Ionic Liquids for the Absorption of Acidic Gases?. J. Phys. Chem. B 2013, 117, 2482−2486.
(33) 33Jacquemin, J.; Husson, P.; Padua, A. A. H.; Majer, V. Density and viscosity of several pure and water-saturated ionic liquids. Green Chem. 2006, 8, 172–180.
(34) Muldoon M.J., Aki S.N.V.K., Anderson J.L., Dixon J.K., and Brennecke J.F., Improving Carbon Dioxide Solubility in Ionic Liquids, J. Phys. Chem. B 2007, 111, 9001-9009
(35) Palgunadi J., Kang J.E., Cheong M., Kim H., Lee H., and Kim H.S., Fluorine-free imidazolium-based ionic liquids with a phosphorous-containing anion as potential CO2
22
(36) Pereiro, A. B.; Verdı´a, P.; Tojo, E.; Rodrı´guez, A. Physical Properties of 1-Butyl-3-methylimidazolium Methyl Sulfate as a Function of Temperature. J. Chem. Eng. Data 2007,
52, 377–380.
(37) Zhang Y., Zhang S., Lu X., Zhou Q., Fan W., and Zhang X., Dual
amino-functionalised phosphonium ionic liquids for CO2 capture‖, Chem. Eur. J., Vol. 15 2009,
pg. 3003-3011.
(38) Arshad M.W., CO2 capture using Ionic Liquids, Department of Chemical and
Biochemical Engineering, Technical University of Denmark, 2009. Accessed 28/3/2011. (39) Hasib-ur-Rahman M., Siaj M., Larachi F., Ionic liquids for CO2 capture—
Development and progress, Chem. Eng. Proc. Vol. 49 2010, Pg. 313–322.
(40) SuoJiang Z., XiangPing Z., YanSong Z., GuoYing Z., XiaoQian Y., and HongWei Y., A novel ionic liquids-based scrubbing process for efficient CO2 capture‖, Science China
Chemistry Vol.53, 2010, Pg. 1549-1553.
(41) Cadena C., Anthony J.L., Shah J.K., Morrow T.I., Brennecke J.F., and Maginn E.J., Why Is CO2 So Soluble in Imidazolium-Based Ionic Liquids?‖, J. Am. Chem. Soc., vol.
126 2004, pg. 5300-5308
(42) Huang J. and Rüther T., Why are ionic liquids attractive for CO2 absorption? An
overview, Aust. J. Chem., vol. 62 2009, pg. 298-308.
(43) Baltus R.E., Culbertson B.H., Dai S., Luo H., and DePaoli D.W., Low-pressure solubility of carbon dioxide in room-temperature ionic liquids measured with a quartz crystal microbalance, J.
Phys. Chem. B, Vol. 108, 2004, pg. 721-727.
(44) Brennecke J.F. and Gurkan B.E., Ionic liquids for CO2 capture and emission reduction, J.
23
(45) Shannon, M. S.; Tedstone, J. M.; Danielsen, S. P. O.; Hindman, M.S.; Irvin, A. C.; Bara, J. E. Fractional Free Volume as the Basis of Gas Solubility & Selectivity in Imidazolium-based Ionic Liquids. Ind. Eng. Chem. Res. 2012, 51, 5565–5576.
(46) Scovazzo, P.; Camper, D.; Kieft, J.; Poshusta, J.; Koval, C.; Noble, R. D. Regular solution theory and CO2 gas solubility in room temperature ionic liquids. Ind. Eng. Chem.
Res. 2004, 43, 6855–6860.
(47) Kumelan J., Tuma D., Kamps A.P.S., and Maurer G., Solubility of the Single Gases Carbon Dioxide and Hydrogen in the Ionic Liquid [bmpy][Tf2N], J. Chem. Eng. Data 2010, 55, 165–172
(48) Macedonia, M. D.; Moore, D. D.; Maginn, E. J. Adsorption Studies of Methane, Ethane, and Argon in the Zeolite Mordenite: Molecular Simulations and Experiments.
Langmuir 2000, 16, 3823–3834.
(49) Shiflett, M. B.; Yokozeki, A. Solubilities and diffusivities of carbon dioxide in ionic liquids: [bmim][PF6] and [bmim][BF4]. Ind. Eng. Chem. Res. 2005, 44, 4453–4464.
(50) Zhou, L.; Fan, J.; Shang, X.; Wang, J. Solubilities of CO2, H2, N2 and O2 in ionic
liquid 1-n-butyl-3-methylimidazolium heptafluorobutyrate. J. Chem. Thermodyn. 2013, 59, 28–34.
(51) Anderson, J. L.; Dixon, J. K.; Brennecke, J. F. Solubility of CO2, CH4, C2H6, C2H4,
O2, and N2 in 1-hexyl-3-methylpyridinium bis(trifluoromethylsulfonyl)imide: Comparison to
other ionic liquids. Acc. Chem. Res. 2007, 40, 1208–1216.
(52) Seki, T.; Grunwaldt, J.-D.; Baiker, A. In Situ Attenuated Total Reflection Infrared Spectroscopy of Imidazolium-Based Room-Temperature Ionic Liquids under ―Supercritical‖ CO2. J. Phys. Chem. B 2009, 113, 114–122.
24
(53) Kazarian, S. G.; Briscoe, B. J.; Welton, T. Combining ionic liquids and supercritical fluids: in situ ATR-IR study of CO2 dissolved in two ionic liquids at high pressures.
Chem. Commun. 2000, 2047–2048.
(54) Camper, D.; Bara, J. E.; Koval, C.; Noble, R. D. Gas solubilities in room-temperature ionic liquids. Ind. Eng. Chem. Res. 2006, 45, 6279–6283.
(55) Finotello, A.; Bara, J. E.; Narayan, S.; Camper, D.; Noble, R. D. Ideal Gas Solubilities and Solubility Selectivities in a Binary Mixture of Room-Temperature Ionic Liquids. J. Phys.
Chem. B 2008, 112, 2335–2339.
(56) Huang, X.; Margulis, C. J.; Li, Y.; Berne, B. J. Why is the Partial Molar Volume of CO2 So Small When Dissolved in a Room Temperature Ionic Liquid? Structure and
Dynamics of CO2 Dissolved in [Bmim]+[PF6]-. J. Am. Chem. Soc. 2005, 127, 17842–17851.
(57) Yokozeki, A. Solubility of refrigerants in various lubricants. Int. J. Thermophys. 2001, 22, 1057–1071.
(58) Alvarez, V. H.; Valderrama, J. O. A modified Lydersen-Joback-Reid method to estimate the critical properties of biomolecules. Alimentaria 2004, 254, 55–66.
(59) Valderrama, J. O.; Robles, P. A. Critical properties, normal boiling temperatures, and acentric factors of fifty ionic liquids. Ind. Eng. Chem. Res. 2007, 46, 1338–1344.
25
Table 1: Densities, ρ, and Refractive Index, n, of Pure ILs together with Literatures at Experimental Temperature
Component T/K ρ/(gcm-3) n
Exp. Lit. Exp. Lit. [MOA][Tf2N] 303.15 1.10228 1.1032a 1.43656 - 313.15 1.09474 1.0957a 1.43341 - 323.15 1.08720 - 1.43035 - 333.15 1.07970 - 1.42721 - [BMIM][Tf2N] 303.15 1.43191 1.4334b 1.42546 - 313.15 1.42233 1.4239b 1.42251 - 323.15 1.41283 1.4144b 1.41945 - 333.15 1.40338 1.4048b 1.41655 - [BMIM][MeSO4] 303.15 1.20873 1.20881c 1.47809 1.47805c 313.15 1.20198 1.20204c 1.47532 1.47536c 323.15 1.19606 1.19534c 1.47261 1.47266c 333.15 1.18845 1.18873c 1.46998 1.47000c a
26
Table 2: Experimental Results for Absorption and Desorption of CO2 in [MOA][Tf2N]
Pmeas/MPa T/K xCO2 Pmeas/MPa T/K xCO2 P
calc/MPa absorption desorption 0.0499 303.18 0.017 0.0499 303.17 0.017 0.0500 0.1000 303.21 0.031 0.0998 303.15 0.035 0.1000 0.3998 303.18 0.122 0.3998 303.21 0.138 0.4003 0.7000 303.18 0.198 0.7000 303.15 0.197 0.7005 1.0000 303.18 0.263 0.9998 303.05 0.280 1.0000 1.2999 303.17 0.319 1.2997 303.17 0.323 1.3000 1.4999 303.23 0.343 1.4999 303.23 0.344 1.5011 0.0499 313.25 0.019 0.0500 313.14 0.013 0.0500 0.1000 313.09 0.027 0.0998 313.13 0.030 0.0999 0.4000 313.13 0.104 0.3998 313.07 0.110 0.3999 0.6999 313.15 0.173 0.7000 313.10 0.187 0.6999 0.9997 313.13 0.235 0.9999 313.12 0.235 0.9993 1.2999 313.16 0.287 1.2998 313.07 0.293 1.2989 1.4996 313.17 0.313 1.4996 313.17 0.314 1.4992 0.0500 323.26 0.0143 0.0499 323.16 0.010 0.0500 0.1000 323.18 0.0215 0.0998 323.10 0.022 0.0999 0.4001 323.14 0.0886 0.3998 323.22 0.094 0.3997 0.7000 323.20 0.1511 0.6999 323.07 0.154 0.6999 0.9999 323.19 0.1981 1.0000 323.19 0.212 0.9999 1.3000 323.17 0.2493 1.3000 323.05 0.260 1.2993 1.5000 323.15 0.2820 1.5000 323.15 0.282 1.4992 0.0500 333.24 0.0112 0.0499 333.14 0.006 0.0500 0.0999 333.14 0.0178 0.0999 333.24 0.017 0.0999 0.3999 333.12 0.0773 0.3998 333.18 0.086 0.3996 0.6998 333.11 0.1330 0.6999 333.04 0.141 0.6999 1.0000 333.24 0.1802 0.9999 333.07 0.191 1.0006 1.2998 333.16 0.2281 1.2998 333.12 0.234 1.3005 1.4999 333.13 0.2595 1.4999 333.13 0.258 1.5006 Uncertainty: T = ±0.01 K; P = 1x10⁻⁶ MPa; x = ±0.00005
27
Table 3: Experimental Results for Absorption and Desorption of CO2 in BMIM][Tf2N]
Pmeas/MPa T/K xCO2 Pmeas/MPa T/K xCO2 P
calc/MPa absorption desorption 0.0499 303.22 0.016 0.0499 303.17 0.014 0.0504 0.1000 303.16 0.027 0.0999 303.13 0.028 0.0996 0.4000 303.18 0.096 0.3998 303.14 0.104 0.3996 0.7000 303.18 0.158 0.6994 303.06 0.165 0.7000 0.9998 303.25 0.202 0.9996 303.06 0.219 1.0009 1.3001 303.20 0.260 1.2996 303.10 0.263 1.3013 1.4999 303.22 0.283 1.4999 303.22 0.282 1.5021 0.0499 313.28 0.015 0.0499 313.17 0.008 0.0503 0.1000 313.19 0.020 0.0998 313.15 0.024 0.0984 0.4001 313.13 0.077 0.3998 313.10 0.083 0.3993 0.7001 313.18 0.131 0.6997 313.05 0.135 0.6996 1.0001 313.14 0.178 0.9995 313.07 0.182 0.9996 1.2998 313.14 0.216 1.2999 313.12 0.223 1.299 1.5000 313.11 0.245 1.5000 313.11 0.245 1.4977 0.0500 323.27 0.011 0.0499 323.15 0.005 0.0501 0.1000 323.22 0.016 0.0998 323.15 0.013 0.1019 0.3999 323.20 0.064 0.3997 323.09 0.051 0.3992 0.7000 323.14 0.108 0.6998 323.12 0.098 0.6994 1.0000 323.24 0.147 0.9997 323.17 0.140 1.0000 1.3000 323.09 0.186 1.2999 323.10 0.179 1.2985 1.5000 323.17 0.210 1.5000 323.17 0.210 1.4974 0.0498 333.18 0.004 0.0499 333.07 0.005 0.0501 0.0999 333.15 0.010 0.1000 333.06 0.010 0.1005 0.4020 333.21 0.042 0.3999 333.22 0.052 0.3982 0.7001 333.21 0.094 0.6999 333.14 0.091 0.6995 0.9998 333.17 0.119 0.9998 333.17 0.124 1.0003 1.3000 333.19 0.145 1.2999 333.12 0.141 1.3015 1.5000 333.17 0.155 1.5001 333.14 0.149 1.5028 Uncertainty: T = ±0.01 K; P = 1x10⁻⁶ MPa; x = ±0.00005
28
Table 4: Experimental Results for Absorption and Desorption of CO2 in [BMIM][MeSO4]
Pmeas/MPa T/K xCO2 Pmeas/MPa T/K xCO2 P
calc/MPa absorption desorption 0.0499 303.18 0.005 0.0505 303.18 0.008 0.0500 0.1000 303.20 0.010 0.1001 303.19 0.015 0.1000 0.3997 303.16 0.045 0.4011 303.16 0.048 0.4000 0.7001 303.09 0.084 0.7003 303.09 0.085 0.6998 1.0001 303.20 0.104 0.9996 303.10 0.106 1.0006 1.3001 303.17 0.130 1.3001 303.09 0.132 1.3003 1.5000 303.17 0.138 1.5000 303.17 0.140 1.5012 0.0506 313.25 0.008 0.0509 313.15 0.007 0.0500 0.0998 313.20 0.010 0.1005 313.14 0.013 0.1000 0.4005 313.13 0.038 0.4000 313.06 0.040 0.3998 0.6998 313.11 0.074 0.6999 313.17 0.071 0.6994 1.0000 313.14 0.096 0.9995 313.05 0.097 0.9994 1.3000 313.16 0.118 1.2999 313.11 0.117 1.2989 1.5000 313.16 0.129 1.5000 313.16 0.129 1.4988 0.0507 323.23 0.007 0.0502 323.14 0.003 0.0500 0.1003 323.11 0.007 0.1004 323.11 0.007 0.1000 0.4000 323.15 0.035 0.4004 323.19 0.035 0.3997 0.7001 323.19 0.058 0.7001 323.08 0.058 0.6998 1.0001 323.24 0.078 1.0001 323.15 0.077 1.0001 1.2999 323.23 0.097 1.3000 323.21 0.099 1.3004 1.4999 323.13 0.112 1.4999 323.13 0.109 1.4991 0.0504 333.23 0.003 0.0506 333.04 -0.001 0.0500 0.1011 333.10 0.004 0.1004 333.10 0.003 0.1000 0.3998 333.22 0.028 0.4000 333.20 0.030 0.3998 0.6999 333.25 0.047 0.7000 333.17 0.050 0.6999 0.9998 333.09 0.065 0.9998 333.07 0.069 0.9998 1.2998 333.13 0.083 1.3000 333.08 0.085 1.3004 1.5000 333.05 0.092 1.5000 333.05 0.092 1.5009 Uncertainty: T = ±0.01 K; P = 1x10⁻⁶ MPa; x = ±0.00005
29
Table 5: Experimental Results for Absorption and Desorption of O2 in [MOA][Tf2N]
Pmeas/MPa T/K xO2 Pmeas/MPa T/K xO2 P
calc/MPa absorption desorption 0.0499 303.11 0.004 0.0498 303.17 0.003 0.0499 0.0999 303.19 0.008 0.0999 303.11 0.008 0.0999 0.3997 303.15 0.016 0.3997 303.11 0.016 0.3997 0.6998 303.15 0.023 0.6998 303.15 0.024 0.6998 0.0498 313.31 0.002 0.0498 313.14 0.001 0.0511 0.0999 313.11 0.004 0.0999 313.10 0.002 0.1012 0.3997 313.21 0.013 0.3998 313.07 0.012 0.3996 0.7000 313.17 0.020 0.7000 313.17 0.021 0.7000 0.0498 323.25 0.000 0.0498 323.13 0.000 0.0499 0.0999 323.18 0.001 0.0999 323.23 0.002 0.0999 0.3999 323.24 0.008 0.3998 323.16 0.007 0.3999 0.6999 323.15 0.013 0.6999 323.15 0.013 0.6999 0.0498 333.28 0.000 0.0498 333.15 0.0002 0.0497 0.0999 333.18 0.001 0.0999 333.11 0.0003 0.0994 0.3996 333.23 0.003 0.3997 333.25 0.003 0.3996 0.7000 333.05 0.004 0.7000 333.05 0.003 0.7000 Uncertainty: T = ±0.01 K; P = 1x10⁻⁶ MPa; x = ±0.00005
30
Table 6: Experimental Results for Absorption and Desorption of O2 in [BMIM][Tf2N]
Pmeas/MPa T/K xO2 Pmeas/MPa T/K xO2 P
calc/MPa absorption desorption 0.0498 303.19 0.001 0.050 303.162 0.001 0.0500 0.0999 303.17 0.002 0.100 303.071 0.002 0.0999 0.3999 303.22 0.006 0.400 303.109 0.005 0.3999 0.7000 303.25 0.006 0.700 303.248 0.005 0.7000 0.0498 313.29 0.001 0.050 313.154 0.001 0.0500 0.0999 313.12 0.002 0.100 313.059 0.001 0.0999 0.3999 313.12 0.004 0.400 313.054 0.004 0.3999 0.7001 313.20 0.005 0.700 313.197 0.005 0.7001 0.0499 323.27 0.000 0.050 323.143 0.001 0.0500 0.0998 323.09 0.001 0.100 323.220 0.001 0.0999 0.3998 323.24 0.003 0.400 323.138 0.003 0.3998 0.6999 323.23 0.005 0.700 323.234 0.004 0.6999 0.0500 333.29 0.0003 0.050 333.138 0.0003 0.0500 0.0999 333.19 0.0003 0.100 333.114 0.0002 0.0999 0.3999 333.15 0.0004 0.400 333.066 0.0003 0.3999 0.7000 333.19 0.0005 0.700 333.186 0.0005 0.6999 Uncertainty: T = ±0.01 K; P = 1x10⁻⁶ MPa; x = ±0.00005
31
Table 7: Experimental Results for Absorption and Desorption of O2 in
[BMIM][MeSO4]
Pmeas/MPa T/K xO2 Pmeas/MPa T/K xO2 P
calc/MPa absorption desorption 0.0495 303.18 0.007 0.0495 303.19 0.007 0.0500 0.0994 303.15 0.008 0.0996 303.06 0.008 0.0999 0.3994 303.22 0.012 0.3994 303.11 0.012 0.3989 0.6995 303.06 0.013 0.6995 303.06 0.013 0.6997 0.0496 313.30 0.007 0.0495 313.14 0.007 0.0486 0.0994 313.15 0.007 0.0996 313.06 0.007 0.0973 0.3995 313.08 0.011 0.3995 313.04 0.011 0.3942 0.6995 313.15 0.012 0.6995 313.15 0.012 0.7000 0.0495 323.33 0.006 0.0496 323.14 0.005 0.0496 0.0993 323.11 0.007 0.0996 323.16 0.007 0.0999 0.3993 323.20 0.009 0.3996 323.17 0.009 0.3992 0.6995 323.23 0.010 0.6995 323.23 0.010 0.6995 0.0495 333.35 0.003 0.0497 333.13 0.003 0.0501 0.0998 333.10 0.003 0.0995 333.13 0.003 0.0999 0.3993 333.10 0.005 0.3996 333.24 0.005 0.3993 0.6996 333.15 0.007 0.6996 333.15 0.007 0.6996 Uncertainty: T = ±0.01 K; P = 1x10⁻⁶ MPa; x = ±0.00005
32
Table 8: Henry ́s Law C onstants of CO2 and O2 (KHCO2 and KHO2) in
[MOA][Tf2N], [BMIM][Tf2N] and [BMIM][MeSO4] Estimated from
Absorption Data T/K [MOA][Tf2N] [BMIM][Tf2N] [BMIM][MeSO4] KHCO2 /MPa 303.15 3.7 4.6 9.6 313.15 4.2 5.6 10.5 323.15 4.9 6.7 12.9 333.15 5.5 9.0 15.3 KHO2 /MPa 303.15 19.6 65.6 26.6 313.15 30.9 82.9 28.9 323.15 59.1 128.6 36.1 333.15 138.1 223.7 58.9
Table 9: Enthalpy and Entropy of Absorption for CO2 and O2
in the Ionic Liquids Studied in this Work
[BMIM][Tf2N] [MOA][Tf2N] [BMIM][MeSO4]
∆H/kJ∙mol-1 CO2 -13.46 ± 1.8 -10.46 ± 1.8 -18.15 ± 4.46 O2 -26.80 ± 2.32 -25.53 ± 3.45 -9.25 ± 3.29 ∆S/J∙mol-1∙K-1 CO2 -45.30 ± 5.74 -34.27 ± 4.96 -47.52 ± 5.47 O2 -79.12 ± 19.07 -81.80 ± 11.02 -35.62 ± 2.61
34
Figure Captions
Figure 1. 3D structure of ionic liquids: (a) [MOA][Tf2N], (b) [BMIM][Tf2N] and (c)
[BMIM][MeSO4]used in this work.
Figure 2. Experimental Set-up of IGA-001 used for the measurements of Gas
absorption/desorption.
Figure 3. Isothermal absorption and desorption of CO2 in [MOA][Tf2N]: (◊) absorption, (□)
desorption at 303.15 K; (∆) absorption, (x) desorption at 313.15 K; (●) absorption, (○) desorption at 323.15 K; and (+) absorption, (- -) desorption at 333.15 K. The points joined by the (…..) lines are points obtained by model estimates using parameters regressed from measured data.
Figure 4. Isothermal absorption and desorption of CO2 in [BMIM][Tf2N]: (◊) absorption, (□)
desorption at 303.15 K; (∆) absorption, (x) desorption at 313.15 K; (●) absorption, (○) desorption at 323.15 K; and (+) absorption, (- -) desorption at 333.15 K. The points joined by the (…..) lines are points obtained by model estimates using parameters regressed from measured data.
Figure 5. Isothermal absorption and desorption of CO2 in [BMIM][MeSO4]: (◊) absorption,
(□) desorption at 303.15 K; (∆) absorption, (x) desorption at 313.15 K; (●) absorption, (○) desorption at 323.15 K; and (+) absorption, (- -) desorption at 333.15 K. The points joined by the (…..) lines are points obtained by model estimates using parameters regressed from measured data.
35
Figure 6. Isothermal absorption and desorption of O2 in [MOA][Tf2N]: (◊) absorption, (□)
desorption at 303.15 K; (∆) absorption, (x) desorption at 313.15 K; (●) absorption, (○) desorption at 323.15 K; and (+) absorption, (- -) desorption at 333.15 K. The points joined by the (…..) lines are points obtained by model estimates using parameters regressed from measured data.
Figure 7. Isothermal absorption and desorption of O2 in [BMIM][Tf2N]: (◊) absorption, (□)
desorption at 303.15 K; (∆) absorption, (x) desorption at 313.15 K; (●) absorption, (○) desorption at 323.15 K; and (+) absorption, (- -) desorption at 333.15 K. (■) Anthony et al. (2005)22. The points joined by the (…..) lines are points obtained by model estimates using parameters regressed from measured data.
Figure 8. Isothermal absorption and desorption of O2 in [BMIM][MeSO4]: (◊) absorption,
(□) desorption at 303.15 K; (∆) absorption, (x) desorption at 313.15 K; (●) absorption, (○) desorption at 323.15 K; and (+) absorption, (- -) desorption at 333.15 K. The points joined by the (…..) lines are points obtained by model estimates using parameters regressed from measured data.
Figure 9. Figure: Isothermal absorption of CO2 in [MOA][Tf2N]in comparison to other ionic
liquids measured in literature: (●) absorption at 313.15 K; : (▲) absorption, at 323.15 K; (■) absorption at 333.15 K; (x) Absorption in [HMPY][Tf2N] at 298.15 K 34; (o) [Grey]
Absorption in [BMIM][PF6] at 323.15 K49; (o) Absorption in [HMIM][Tf2N] at 323.15 K
(Anderson et al.50); (□) Absorption in [BMPY][Tf2N] at 333.15 K47
Figure 10. Isothermal absorption of CO2 in [BMIM][Tf2N] in comparison to other ionic
liquids measured in literature: (■) Absorption at 303.15 K; (▲) Absorption at 313.15 K; : (●) Absorption at 323.15 K; (♦) Absorption at 333.15 K; (x) Absorption in [HMPY][Tf2N] at
36
et al. 2005); (o) Absorption in [HMIM][Tf2N] at 323.15 K (Anderson et al. 2007); (◊)
Absorption in [BMPY][Tf2N] at 333.15 K (Kumelan et al. 2010)
Figure 11. Isothermal absorption of O2 in [BMIM][Tf2N]and [MOA][Tf2N] in comparison to
[BMPY][Tf2N] measured in literature: (♦) Absorption in [BMIM][Tf2N] at 303.15 K (▲)
Absorption in [BMIM][Tf2N] at 313.15 K; (■) Absorption in [MOA][Tf2N] at 303.15 K(●)
Absorption in [MOA][Tf2N] at 313.15 K; (x) Absorption in [BMPY][Tf2N] at 298.15 K
37 Figure 1. (a) (b) (c) Figure 2.
38
39
40
41
42
43
44
45
46
48
Supporting information: Buoyancy Correction
The weight change of the sample as gas absorption/desorption occurs is calculated by taking into account all contributing forces including the mass of the counterweight and its associated attachments (hook and chain), the sample container and its associated attachments (hook and chains), the density of the sample and that of the absorbing gas. The following equation applies:
W = g[ms + ma - mc + mI - mII -ρf(Vas + VI - VII - Vc)] (1)
where W is the weight reading, g is acceleration due to gravity in m.s-2, ms is the dry sample
mass, ma is the mass absorbed which needs to be determined, mc is the mass of
counterweight, mI and mII are the mass of the balance components on the sample side and
counterweight side respectively, and ρf is the density of the absorbing gas. All masses and the
49
components on the sample side, the volume of balance components on the counterweight side, and the volume of the counterweight respectively. Vas is the volume of the sample and
the absorbed gas. All volumes are measured in cm3.
W = g[ms + ma,N2 - mc + mI - mII –ρN2(VN2 + VI - VII - Vc)] (2)
where ma,N2 is the mass of sample and absorbed nitrogen and VN2 is the volume of sample and
absorbed nitrogen.
The method of buoyancy correction is explained in detail by Macedonia et al.,48 In this study, the buoyancy of the sample was corrected using N2 gas, which is negligibly soluble in the
samples in question and possesses a molecular mass more comparable to CO2 than the use of
helium gas, thus providing good accuracy is asserting the assumption of Vas=VN2.
The error in weight measurement can be expressed as:
u(w) = u(w)1 + u(w)2 (3) where u(w)1 and u(w) 2 is the sum of error in mass reading of each component in eqs 1 and 2, respectively.
Due to each mass of each balance component in eq 1 being accurate to ±0.001 mg, and with the need of buoyancy correction eq 2, u(w) may be expressed as:
50
Table S1: Binary Interactions and Fitting Parameters by using RK-EOS model
51 CO2 (1) + [MOA][Tf2N] (2) 303.15 1.5x10⁻¹ -2.3x10⁻² 0.0 0.0 1.5x10⁻¹ 1.0x10¹⁴ -2.3x10⁻² 9.1x10⁻¹ 7.1x10⁻⁶ 313.15 1.5x10⁻¹ -2.3x10⁻² 0.0 0.0 1.5x10⁻¹ 1.0x10¹⁴ -2.3x10⁻² 9.1x10⁻¹ 7.1x10⁻⁶ 323.15 1.5x10⁻¹ -2.3x10⁻² 0.0 0.0 1.5x10⁻¹ 1.0x10¹⁴ -2.3x10⁻² 9.1x10⁻¹ 7.1x10⁻⁶ 333.15 1.5x10⁻¹ -2.3x10⁻² 0.0 0.0 1.5x10⁻¹ 1.0x10¹⁴ -2.3x10⁻² 9.1x10⁻¹ 7.1x10⁻⁶ CO2 (1) + [BMIM][Tf2N] (2) 303.15 6.4x10⁻² 8.4x10⁻⁴ 0.0 0.0 -2.2x10⁻¹ 1.2x101 -8.8x10² 0.3x101 1.4x10⁻⁴ 313.15 6.4x10⁻² 8.4x10⁻⁴ 0.0 0.0 -2.2x10⁻¹ 1.2x101 -8.8x10² 0.3x101 1.4x10⁻⁴ 323.15 6.4x10⁻² 8.4x10⁻⁴ 0.0 0.0 -2.2x10⁻¹ 1.2x101 -8.8x10² 0.3x101 1.4x10⁻⁴ 333.15 6.4x10⁻² 8.4x10⁻⁴ 0.0 0.0 -2.2x10⁻¹ 1.2x101 -8.8x10² 0.3x101 1.4x10⁻⁴ CO2 (1) + [BMIM][MeSO4] (2) 303.15 1.7x10⁻¹ -1.7x10⁻² 0.0 0.0 9.9x10⁻¹ 9.9x10⁻¹ 7.25x10⁵ 7.18x10³ 1.5x10⁻⁴ 313.15 1.7x10⁻¹ -1.7x10⁻² 0.0 0.0 9.9x10⁻¹ 9.9x10⁻¹ 7.25x10⁵ 7.18x10³ 1.5x10⁻⁴ 323.15 1.7x10⁻¹ -1.7x10⁻² 0.0 0.0 9.9x10⁻¹ 9.9x10⁻¹ 7.25x10⁵ 7.18x10³ 1.5x10⁻⁴ 333.15 1.7x10⁻¹ -1.7x10⁻² 0.0 0.0 9.9x10⁻¹ 9.9x10⁻¹ 7.25x10⁵ 7.18x10³ 1.5x10⁻⁴ O2 (1) + [MOA][Tf2N] (2) 303.15 -1.7x10⁻¹ 4.3x10⁻² 0.0 0.0 -6.4 -8.7x101 -1.1x10⁻⁵ 2.1 0.0 313.15 1.2 -2.3x10⁻¹ 0.0 0.0 7.2x10⁻⁸ -3.5x10⁻⁶ 6.8x101 9.7x10⁻¹ 6.3x10⁻⁴ 323.15 3.3 -4.9x10⁻¹ 0.7 -0.2 0.0 0.0 -3.7x10⁵ 5.6x101 2.5x10⁻⁵ 333.15 1.7 1.4x10⁻¹ 1.2 -0.3 -8.0x10⁻³ 1.8 -3.0x10² 9.9x10⁻¹ 1.5x10⁻⁴ O2 (1) + [BMIM][Tf2N] (2) 303.15 5.5 -1.4 0.0 0.0 6.3x10⁻¹⁰ -9.9x10⁻⁸ -5.4x10² 1.2 5.0x10⁻⁵ 313.15 1.2 -3.0x10⁻¹ 0.0 0.0 -6.2x10⁻³ 1.2 -1.0x10² 9.9x10⁻¹ 5.0x10⁻⁵ 323.15 1.2x10² -4.9x101 1.0 1.0 -4.2x10⁻⁷ -6.1 -2.5x10⁴ 3.9x101 5.0x10⁻⁵ 333.15 1.1x10² -4.8x101 1.0 1.0 7.8x10⁻⁴ 2.8x10³ 8.6x10⁶ 8.0x10² 2.5x10⁻⁵ O2 (1) + [BMIM][MeSO4] (2) 303.15 9.9 -3.1 0.0 0.0 -1.2 -3.5 -1.1 1.0x10⁻¹ 1.7x10⁻⁴ 313.15 3.4 -1.1 0.0 0.0 -5.0x10⁻² 4.1 -2.0x10⁻¹ 1.0 2.0x10⁻³ 323.15 1.0 -1.2x101 1.0 1.0 -5.2 x10⁻² -3.1x10⁵ -3.2x10² 1.0 1.5x10⁻⁴ 333.15 2.9 -1.3 x101 1.0 1.0 -3.9x10⁻⁹ 5.7x10⁻⁷ -6.5x101 -2.5 1.8x10⁻⁴
52
Table S2: Critical Properties of ILs used in this study
ionic liquid molar mass/(g.mol-1) Tb/K TC/K PC/bar VC/(cm3.mol-1) ω
[MOA][Tf2N] 648.85 1190.0 1447.35 10.31 2002.30 1.0096
[BMIM][Tf2N] 419.37 784.6 1133.41 25.69 956.02 0.3526
[BMIM][MeSO4] 250.32 595.0 877.42 35.51 663.94 0.3913
Figure S-1: Kinetic data of sample weight for CO2 solubility in [MOA][Tf2N] at 303.15 K and at 0.05
![Table 2: Experimental Results for Absorption and Desorption of CO 2 in [MOA][Tf 2 N]](https://thumb-eu.123doks.com/thumbv2/123doknet/11659139.309573/27.892.105.809.135.855/table-experimental-results-absorption-desorption-moa-tf-n.webp)
![Table 3: Experimental Results for Absorption and Desorption of CO 2 in BMIM][Tf 2 N]](https://thumb-eu.123doks.com/thumbv2/123doknet/11659139.309573/28.892.108.802.140.849/table-experimental-results-absorption-desorption-bmim-tf-n.webp)
![Table 4: Experimental Results for Absorption and Desorption of CO 2 in [BMIM][MeSO 4 ]](https://thumb-eu.123doks.com/thumbv2/123doknet/11659139.309573/29.892.108.803.135.836/table-experimental-results-absorption-desorption-bmim-meso.webp)
![Table 5: Experimental Results for Absorption and Desorption of O 2 in [MOA][Tf 2 N]](https://thumb-eu.123doks.com/thumbv2/123doknet/11659139.309573/30.892.66.811.136.589/table-experimental-results-absorption-desorption-o-moa-tf.webp)
![Table 6: Experimental Results for Absorption and Desorption of O 2 in [BMIM][Tf 2 N]](https://thumb-eu.123doks.com/thumbv2/123doknet/11659139.309573/31.892.109.833.142.580/table-experimental-results-absorption-desorption-o-bmim-tf.webp)
![Table 7: Experimental Results for Absorption and Desorption of O 2 in [BMIM][MeSO 4 ]](https://thumb-eu.123doks.com/thumbv2/123doknet/11659139.309573/32.892.105.810.153.577/table-experimental-results-absorption-desorption-o-bmim-meso.webp)
![Table 8: Henry ́s Law C onstants of CO 2 and O 2 (K HCO2 and K HO2 ) in [MOA][Tf 2 N], [BMIM][Tf 2 N] and [BMIM][MeSO 4 ] Estimated from Absorption Data T/K [MOA][Tf 2 N] [BMIM][Tf 2 N]](https://thumb-eu.123doks.com/thumbv2/123doknet/11659139.309573/33.892.145.741.194.470/table-henry-onstants-bmim-bmim-meso-estimated-absorption.webp)
![Figure S-1: Kinetic data of sample weight for CO 2 solubility in [MOA][Tf 2 N] at 303.15 K and at 0.05 MPa](https://thumb-eu.123doks.com/thumbv2/123doknet/11659139.309573/53.892.172.723.325.654/figure-kinetic-data-sample-weight-solubility-moa-mpa.webp)
