HAL Id: hal-02569564
https://hal.archives-ouvertes.fr/hal-02569564
Submitted on 19 May 2020HAL is a multi-disciplinary open access archive for the deposit and dissemination of sci-entific research documents, whether they are pub-lished or not. The documents may come from teaching and research institutions in France or abroad, or from public or private research centers.
L’archive ouverte pluridisciplinaire HAL, est destinée au dépôt et à la diffusion de documents scientifiques de niveau recherche, publiés ou non, émanant des établissements d’enseignement et de recherche français ou étrangers, des laboratoires publics ou privés.
Primary production and depth drive different trophic
structure and functioning of fish assemblages in French
marine ecosystems
Pierre Cresson, Tiphaine Chouvelon, Paco Bustamante, Daniela Bănaru,
Jérome Baudrier, François Le Loc’h, Aourell Mauffret, Benoit Mialet, Jérôme
Spitz, Nathalie Wessel, et al.
To cite this version:
Pierre Cresson, Tiphaine Chouvelon, Paco Bustamante, Daniela Bănaru, Jérome Baudrier, et al.. Primary production and depth drive different trophic structure and functioning of fish assem-blages in French marine ecosystems. Progress in Oceanography, Elsevier, 2020, 186C, pp.102343. �10.1016/j.pocean.2020.102343�. �hal-02569564�
Journal Pre-proofs
Primary production and depth drive different trophic structure and functioning of fish assemblages in French marine ecosystems
Pierre Cresson, Tiphaine Chouvelon, Paco Bustamante, Daniela Bănaru, Jérome Baudrier, François Le Loc'h, Aourell Mauffret, Benoit Mialet, Jérome Spitz, Nathalie Wessel, Marine J. Briand, Margaux Denamiel, Matthieu Doray, Gaël Guillou, Angélique Jadaud, Coline Lazard, Camille Noûs, Solène Prieur, Manuel Rouquette, Claire Saraux, Sandrine Serre, Charles-André Timmerman, Yves Verin, Mireille Harmelin-Vivien
PII: S0079-6611(20)30082-3
DOI: https://doi.org/10.1016/j.pocean.2020.102343
Reference: PROOCE 102343
To appear in: Progress in Oceanography
Received Date: 6 November 2019 Revised Date: 29 April 2020 Accepted Date: 4 May 2020
Please cite this article as: Cresson, P., Chouvelon, T., Bustamante, P., Bănaru, D., Baudrier, J., Le Loc'h, F., Mauffret, A., Mialet, B., Spitz, J., Wessel, N., Briand, M.J., Denamiel, M., Doray, M., Guillou, G., Jadaud, A., Lazard, C., Noûs, C., Prieur, S., Rouquette, M., Saraux, C., Serre, S., Timmerman, C-A., Verin, Y., Harmelin-Vivien, M., Primary production and depth drive different trophic structure and functioning of fish assemblages in French marine ecosystems, Progress in Oceanography (2020), doi: https://doi.org/10.1016/j.pocean.2020.102343
This is a PDF file of an article that has undergone enhancements after acceptance, such as the addition of a cover page and metadata, and formatting for readability, but it is not yet the definitive version of record. This version will undergo additional copyediting, typesetting and review before it is published in its final form, but we are providing this version to give early visibility of the article. Please note that, during the production process, errors may be discovered which could affect the content, and all legal disclaimers that apply to the journal pertain.
Primary production and depth drive different trophic structure and functioning of fish assemblages in French marine ecosystems.
Pierre Cresson a*, Tiphaine Chouvelon b,c, Paco Bustamante d,e, Daniela Bănaru f, Jérome Baudrier g,
François Le Loc'h h, Aourell Mauffret b, Benoit Mialet d, Jérome Spitz c,i, Nathalie Wessel g, Marine J.
Briand f,j, Margaux Denamiela, Matthieu Doray k, Gaël Guillou d, Angélique Jadaud l, Coline Lazard a,
Camille Noûsm, Solène Prieur d, Manuel Rouquette a,p, Claire Saraux l,n, Sandrine Serre o, Charles-André
Timmerman a, Yves Verin a, Mireille Harmelin-Vivien f
a: Ifremer, HMMN, Centre Manche Mer du Nord, 150 Quai Gambetta BP 699 62321 Boulogne sur Mer b: Ifremer, BE/LBCM, Centre Atlantique, Rue de l'île d'Yeu, BP 21105, 44311 Nantes Cedex 03
c: Observatoire Pelagis, UMS 3462 La Rochelle Université/CNRS, 5 allée de l'Océan, 17000 La Rochelle, France
d: Littoral Environnement et Sociétés (LIENSs), UMR 7266 CNRS-La Rochelle Université, 2 rue Olympe de Gouges 17000 La Rochelle
e: Institut Universitaire de France (IUF), 1 rue Descartes 75005 Paris, France
f: MIO, UM 110, Aix-Marseille Université, CNRS/INSU, Université de Toulon, IRD, Campus de Luminy, 13288 Marseille
g: Ifremer, ODE/VIGIES, Rue de l'Ile d'Yeu, BP 21105, 44311 Nantes Cedex 03, France h: IRD, Univ. Brest, CNRS, Ifremer, LEMAR, IUEM, F-29280 Plouzané- France
i: Centre d’Etudes Biologiques de Chizé (CEBC), UMR 7372 La Rochelle Université-CNRS, 79360 Villiers-en-Bois, France
j: Ifremer, ODE/LER-PAC, Centre Méditerranée, Zone portuaire de Brégaillon, CS 20 330, 83507 La Seyne-sur-Mer Cedex.
k: Ifremer, EMH, Centre Atlantique, Rue de l'île d'Yeu, BP 21105, 44311 Nantes Cedex 03 l: MARBEC, Université de Montpellier, Ifremer, CNRS, IRD, Sète, France.
m: Laboratoire Cogitamus
n :IPHC UMR 7178, CNRS-Université de Strasbourg, 23 rue Becquerel, 67037 Strasbourg, France o: Institut Méditerranéen de Biologie et d'Ecologie Marine, Aix-Marseille Université, CNRS, IRD, Université d'Avignon, Station marine d'Endoume, chemin de la Batterie des Lions, 13001 Marseille p, present address: Ifremer, LERBN Centre Bretagne, 38 rue du Port Blanc - 35800 Dinard
*corresponding author; pierre.cresson@ifremer.fr Abstract
Investigating the drivers of fish assemblage trophic structure is a critical question, in order to better understand ecosystem functioning, predict the effects of perturbations and implement integrated management of exploited marine ecosystems. Ecosystemic surveys enabled the determination of the trophic structure of the fish assemblages in three French marine ecosystems, namely the Eastern English
Channel, the Bay of Biscay and the Gulf of Lions, through the simultaneous collection of qualitative (stable isotopes and energy content) and quantitative (biomass) data. In the Bay of Biscay and in the Gulf of Lions, pelagic primary production supported at least 80% of the fish biomass production, and explained the dominance of pelagic species, but with differences resulting from the different productivity. The lower productivity in the oligotrophic Gulf of Lions led to a lower total biomass, energy density as well as the predominance of zooplankton feeders. In contrast, fluxes in the Bay of Biscay were sufficient to support a higher biomass of pelagic piscivores, and of species with higher energy content. In the shallow Eastern English Channel, the respective contributions of pelagic and benthic sources were similar. Bentho-demersal species of higher trophic level dominated this assemblage, because of their ability to exploit both pathways. Results of the present study confirmed that fisheries-focused surveys can be used as efficient platforms to address questions about ecosystem functioning. Here it confirmed the expected differences between ecosystems and the importance of primary production and environment as drivers of fish assemblage structure and functioning. Future studies should nevertheless develop new methods to better assess the paramount role of low trophic level consumers.
Keywords: fish community; trophodynamics; food webs; benthic-pelagic coupling; Highlights
Fish assemblage trophic structure was compared between French marine ecosystems 2 pelagic dominated ecosystems 1 with similar benthic/pelagic contributions
Bentho-demersal species’ biomass was higher when both sources contribute
Graphical abstract
1. Introduction
Trophic interactions were identified early as major drivers of community structure and functioning, and thus have been the focus of numerous works in ecology going back decades (Layman et al., 2015). Understanding food web topology, i.e. the number of species and their interactions, is crucial to describe community functioning and to understand energy and matter transfers. The food web is also a pertinent framework to address questions at all levels of ecological organization, and thus to estimate the potential effects of human and natural perturbations, and predict future changes, from individuals to ecosystems (Libralato et al., 2014; Seibold et al., 2018; Thompson et al., 2012; Trebilco et al., 2013). Understanding the role of trophic interactions in ecosystem functioning is essential to predict the functional effects of biodiversity loss, since anthropic pressures can affect food webs, via bottom-up climatic effects on primary production (Griffiths et al., 2017; Hayden et al., 2019; Lynam et al., 2017) or top-down cascades, after removal of high trophic level species (Estes et al., 2011; Pauly et al., 1998). Several trophic-based indicators have thus been developed to monitor functional alterations of marine systems (Coll et al., 2016; Shannon et al., 2014). Consequently, the current agenda of most management agencies fosters the implementation of ecosystemic management policies, such as the Ecosystemic Approach to Fisheries globally or the Marine Strategy Framework Directive (MSFD) in Europe (de Boois, 2019). In a global context of complex and cumulative human pressures on marine ecosystems (Halpern et al., 2019), an integrated assessment of trophic interactions over several trophic levels is still a central point of fundamental research on current functioning and also an urgent need as a basis for forecasting future alterations and implementing sustainable management practices.
Inflow of energy at the base of food webs drives marine system functioning (Chassot et al. 2010), but the connection between basal energy and fish biomass or fisheries yield is not straightforward (Petrik et al., 2019; Ware and Thomson, 2005). Trophodynamics, i.e. how energy and nutrients flow between different levels of the food web, largely shapes the organization of marine communities and associated ecosystem services (Petrik et al., 2019; Trebilco et al., 2013; Udy et al., 2019; van Denderen et al., 2018). Distribution of biomass along trophic levels is a classical representation of biological communities. The shape of this representation carries much information about the trophic functioning of a system, the underlying energy fluxes (Trebilco et al., 2013) and anthropogenic pressures (Gascuel et al., 2005). Whether considering trophic descriptors as discrete (trophic pyramid) or continuous variables (trophic spectrum), communities are usually depicted with a bottom-heavy base, reflecting the dissipation of energy along trophic levels from one major basal source, mostly pelagic primary production in marine systems (Uitz et al., 2010), resulting in low biomass levels at higher trophic levels (Trebilco et al., 2013; van Denderen et al., 2018). Nevertheless, human or natural factors can alter organization and fluxes, leading to odd-shaped representations. By targeting predator species, fisheries remove biomass at the top of the community, sharpening the upper part of the spectrum, but also decrease the top-down predation effect on mid- and low trophic level species, leading to higher biomass at low trophic levels and more bottom heavy spectra (Gascuel et al. 2005).
Couplings (i.e. the exchange of matter or energy between remote systems) are key features of marine systems and major drivers of their trophic functioning. Such mechanisms connect systems and profoundly alter their functioning, as fluxes of nutrients and organic matter or animal migrations influence ecosystem structure and productivity, with a potential impact on ecosystem services, such as carbon storage or fisheries (Croll et al., 2005; Darnaude et al., 2004; Furey et al., 2018; Graham et al., 2018). As organic matter subsidies or the arrival of migrant species increase the amount of matter and energy available in the system, the biomass of high trophic level species are higher in coupled systems; the resulting representation being consequently more top-heavy (Mourier et al., 2016; Trebilco et al., 2016; Udy et al., 2019). This assumption reinforces the importance of considering coupling between ecosystems. The major importance of the coupling between pelagic and benthic systems has been extensively documented in marine systems. Downward coupling (i.e. benthic habitats being fueled by pelagic primary production) is prevalent in most marine ecosystems worldwide and has consequently received much attention (Baustian et al., 2014; Duffil Telsning et al. 2019; Griffiths et al., 2017; Lassalle et al., 2011; McMeans et al., 2015). Nevertheless, upwards fluxes (i.e. integration of benthic primary or secondary productions in pelagic systems) can play some role and merits investigation as well. In addition, comparison between systems with different environmental features is recognized as a convenient framework to identify key environmental and anthropic drivers of trophic functioning (e.g.
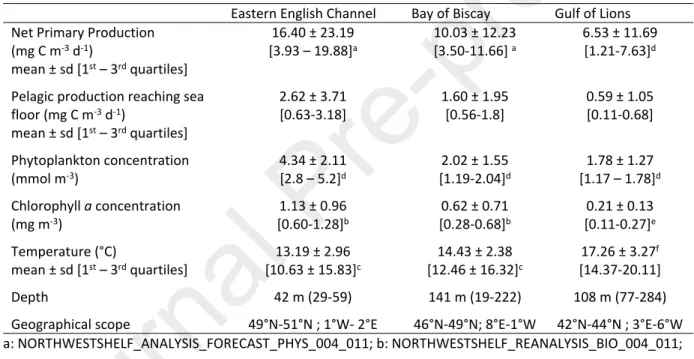
Graham et al., 2017; Silberberger et al., 2018; Udy et al., 2019; Vander Zanden et al., 2005; Ware and Thomson, 2005). The three French marine ecosystems (Eastern English Channel, Bay of Biscay and Gulf of Lions) are thus well-suited for undertaking such a comparison, since they differ in the environmental parameters, notably the intensity of primary production and average depth (Table 1). This study was thus aimed at using this comparison framework for the three main marine ecosystems in French waters. Table 1: Comparison of annual average environmental conditions in the three studied systems. Data were retrieved the EU Copernicus Marine Service Information for a temporal period encompassing surveys (Oct. 16 2014 – Dec. 16, 2015 in the Eastern English Channel and the Bay of Biscay, Oct. 1, 2014 – Dec. 1, 2015 in the Gulf of Lions), and for areas the limits of which are detailed in the final line. Superscript letters refers to the models used. Data were integrated over the 0-20 m depth layer in the Eastern English Channel and the Bay of Biscay, and over the 1.5-19.6 m depth layer in the Gulf of Lions. The amount of pelagic production reaching the seafloor was calculated, considering that 16% of the pelagic production reaches the seafloor in the Eastern English Channel and the Bay of Biscay, and 9 % in the Mediterranean Sea (van Denderen et al., 2018). Depth refers to the depth of the sampling stations (Fig. 1).
Eastern English Channel Bay of Biscay Gulf of Lions Net Primary Production
(mg C m-3 d-1) mean ± sd [1st – 3rd quartiles] 16.40 ± 23.19 [3.93 – 19.88]a 10.03 ± 12.23 [3.50-11.66] a 6.53 ± 11.69 [1.21-7.63]d
Pelagic production reaching sea floor (mg C m-3 d-1) mean ± sd [1st – 3rd quartiles] 2.62 ± 3.71 [0.63-3.18] 1.60 ± 1.95 [0.56-1.8] 0.59 ± 1.05 [0.11-0.68] Phytoplankton concentration (mmol m-3) 4.34 ± 2.11 [2.8 – 5.2]d 2.02 ± 1.55 [1.19-2.04]d 1.78 ± 1.27 [1.17 – 1.78]d Chlorophyll a concentration (mg m-3) 1.13 ± 0.96 [0.60-1.28]b 0.62 ± 0.71 [0.28-0.68]b 0.21 ± 0.13 [0.11-0.27]e Temperature (°C) mean ± sd [1st – 3rd quartiles] 13.19 ± 2.96 [10.63 ± 15.83]c 14.43 ± 2.38 [12.46 ± 16.32]c 17.26 ± 3.27f [14.37-20.11] Depth 42 m (29-59) 141 m (19-222) 108 m (77-284)
Geographical scope 49°N-51°N ; 1°W- 2°E 46°N-49°N; 8°E-1°W 42°N-44°N ; 3°E-6°W a: NORTHWESTSHELF_ANALYSIS_FORECAST_PHYS_004_011; b: NORTHWESTSHELF_REANALYSIS_BIO_004_011; c:NORTHWESTSHELF_REANALYSIS_PHY_004_009; d: GLOBAL_REANALYSIS_BIO_001_029;
e:MEDSEA_ANALYSIS_FORECAST_BIO_006_008; f: MEDSEA_REANALYSIS_PHYS_006_004
Average primary production is notably higher in the Eastern English Channel than in the Bay of Biscay and in the oligotrophic Gulf of Lions (Tab. 1), leading to higher vertical exports: 16 % of the pelagic production reaches the seabed in the Atlantic, compared to only 9% in the Mediterranean (van Denderen et al., 2018). The three environments also differ in their fish assemblage composition: benthic and bentho-demersal species dominate in the Eastern English Channel, pelagic piscivores play a major role in the Bay of Biscay, and zooplankton feeders are predominant in the Gulf of Lions (Bănaru et al., 2013; Girardin et al., 2018; Lassalle et al., 2011; Saraux et al., 2019). However, no study has so far
empirically compared these environments in order to understand trophic structures and pathways in their fish assemblages.
Stable isotopes are nowadays classical but powerful tracers of trophic functioning, notably in marine ecosystems (Boecklen et al., 2011). This technique is based on the different behavior of carbon and nitrogen isotopes in food webs. As the carbon isotopic ratio varies little along trophic levels, it is a good proxy of the major organic matter sources at the base of the food web. In contrast, nitrogen is enriched at each trophic level, allowing the use of this element as a trophic level proxy. Several studies have demonstrated the efficiency of stable isotopes for identifying trophic couplings, as terrestrial, benthic and pelagic primary productions differ in their isotopic ratios. While increasing nitrogen isotopic ratios in consumer tissues will place them along several trophic levels, variability in carbon will allow identification of the coexistence of several pathways and the relative importance of different organic matters as the base of an ecosystem food web (e. g. Croll et al., 2005; Darnaude et al., 2004; Duffill Telsnig et al., 2019; Graham et al., 2018; Kopp et al., 2015; Liénart et al., 2017). Nevertheless, stable isotopes provide only qualitative information, i.e. the existence of a relationship between species, and may partly attest to the intensity of the flux, by calculating the relative importance of each source, but cannot directly estimate energy flows in the absence of information about the actual importance of each species in the ecosystem. As simultaneous collection of trophic and biomass or abundance data involves a good deal of work, most studies investigating the trophic structure of a fish community with stable isotopes classically do not include biomass data (but see Cresson et al., 2019; Duffill Telsnig et al., 2019; Trueman et al., 2014; Udy et al., 2019). As a result, patterns driven by species of low or high importance may be missed. Similarly, studies including biomass data usually infer trophic structure from stomach content data or trophic attributes retrieved from previous studies or global data aggregators such as FishBase or DAPSTOM (Froese and Pauly, 2017; Pinnegar, 2014). However, gut content analyses are brief snapshots in time, whereas stable isotopes, by integrating a longer time period, should give complementary and more reliable information on the trophic structure.
The aim of the present study was thus to compare the trophic structure (i.e. biomass distribution within trophic functional groups) and functioning (i.e. relative importance of different kinds of primary production as sources of organic matter) of fish communities over the three French marine ecosystems (the Eastern English Channel, the Bay of Biscay and the Gulf of Lions), and to identify major underlying drivers, by using the ecosystemic approach implemented through the MSFD monitoring program in 2014 and 2015. Basically, three main questions were investigated in this study : (1) How do fish biomass and functional group composition vary between the regions, (2) How do fish assemblages differ in their pelagic/benthic contribution and trophic structure, and (3) How does the energetic density of dominant pelagic fish species vary among regions?
Previous studies demonstrated that these systems differed regarding the main component of organic matter pools at the base of their food webs (Liénart et al., 2017), and the portion of these pools actually used by filter feeders (Briant et al., 2018). Oligotrophy of the Mediterranean was previously identified as a major factor driving trophic features of some Mediterranean species (Chouvelon et al., 2018; Cossa et al., 2012). But none empirically compare the trophic structure of the fish communities. In addition, the vast majority of studies investigating the links between primary production and fish production and/or fisheries yields overlooked fish assemblage structure (e.g. Udy et al. 2019; Ware and Thomson, 2005), despite the recent demonstration that including functional attributes (e.g separating benthic or pelagic piscivores) can be a powerful method to understand the links between primary production and fish biomass (Cresson et al., 2019; Petrik et al., 2019; Stock et al., 2017; van Denderen et al., 2018). The simultaneous collection of quantitative (i.e. biomass) and qualitative functional data (isotopic-derived trophic descriptors and energy content) allowed assessment of major fluxes of organic matter, and how these fluxes drive different fish community structures.
2. Material and methods
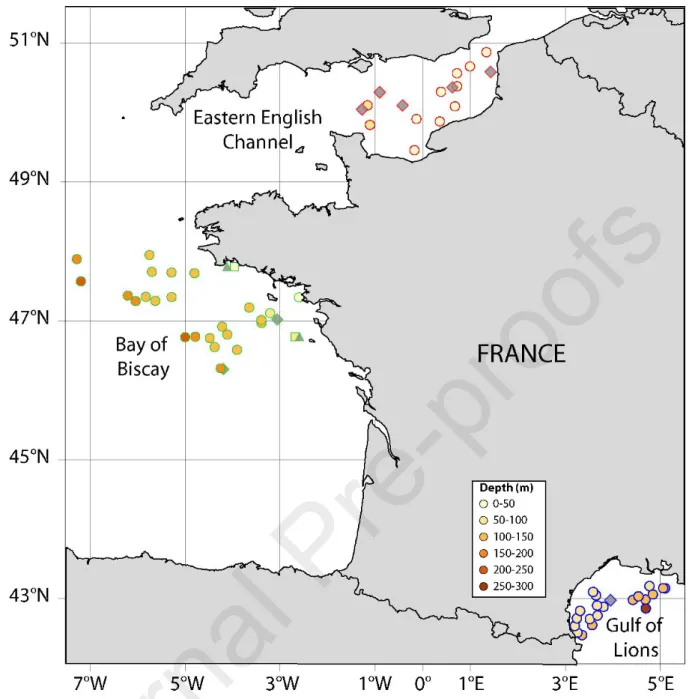
This study benefited from French ecosystemic surveys in the Eastern English Channel, the Bay of Biscay and the Gulf of Lions to collect biomass, stable isotope and energy content data for some selected fish species, within the framework of the implementation of the MSFD. The strategy adopted to inform trophic descriptors of the MSFD was to use as far as possible the currently available monitoring programs. These surveys have for decades been applying standardized protocols to produce fisheries indicators in the three French ecosystems of interest in this work (Fig. 1).
Fig. 1: Map of the sampled ecosystems. Colored circles stand for the stations where fish were sampled for stable isotope analyses, with color representing the sampling depth. Grey symbols represent sampling location of baseline data gathered from external sources; triangles: Pecten maximus from Chouvelon et al. (2012a); diamonds: zooplankton from Chouvelon et al. (2015) in the Bay of Biscay, from P. Cresson (unpubl. data) in the Eastern English Channel and from D. Bănaru (unpubl. data) in the Gulf of Lions.
The application of MSFD specific objectives during surveys not designed to implement it resulted in the need for adaptation, through the collection of additional data (Baudrier et al., 2018). This approach is consistent with the ecosystem monitoring implementation framework proposed by ICES (“Approach C: Add data collection to existing monitoring”; de Boois, 2019) but resulted in sampling differences between ecosystems (Table 2). Briefly, bentho-demersal surveys (IBTS in the Eastern English Channel, EVHOE in the Bay of Biscay, and MEDITS in the Gulf of Lions) use bottom trawling to estimate abundance
and biomass of bentho-demersal communities, and were used to collect samples dedicated to stable isotope analyses in the present study. Trawls vary slightly between surveys (IBTS and EVHOE: 36/47 Grande Ouverture Verticale (GOV) trawl with 20 mm stretched mesh size at the cod end; MEDITS: GOC-73 trawl with 20 mm mesh size at the cod end). Pelagic surveys (PELGAS in the Bay of Biscay, PELMED in the Gulf of Lions) perform fisheries acoustics surveys to estimate the biomass and distribution of pelagic species. Species identification is confirmed by midwater trawling. These surveys provided biomass data for pelagic species and samples dedicated to determination of energy content in the present study. As forage fish species are pivotal between primary production and high trophic level predators, changes in their energy density can be viewed as a good proxy of the energy available in an ecosystem. Changes in energy density of forage species can dramatically impact the population dynamics of marine top predators, and can be explained by a change in energy density of their preys (Österblom et al. 2008; Spitz et al., 2012; Trites & Donnelly, 2003). In addition with stable isotopes and species biomass, energy density is a pertinent indicator of fish condition, and of the quality of matter fluxes, particularly for lipid transfer from zooplankton to fish (Saraux et al., 2019; Spitz et al., 2010 and references therein; Van Beveren et al., 2014; Wuenschel et al. 2019).
As no pelagic survey is carried out in the English Channel, all analyses are based on biomass data and samples collected during IBTS (Verin, 2015). Estimation of pelagic species biomass by bottom trawling may appear biased but it may be assumed that the problem is limited by the shallowness of the Eastern English Channel, by the wide opening of the GOV trawl, and by correction factors based on species-specific catchability (Walker et al., 2017).
Table 2: Data sources and sampling design. Bivalves and zooplankton were used as proxies of benthic and pelagic organic matter sources, respectively. Fish biomass data was corrected for catchability in the IBTS (benthic, pelagic) and EVHOE (benthic) data. Such corrections were not available for MEDITS (benthic) and not needed for PELGAS and PELMED (both pelagic) data. IBTS: International Bottom Trawl Survey; EVHOE: EValuation Halieutique Ouest de l’Europe; PELGAS: PELagiques Golfe de GAScogne; MEDITS: International bottom trawl survey in the Mediterranean; PELMED: PELagiques MEDiterannée.
Analysis compartmentEcological Eastern English Channel Bay of Biscay Gulf of Lions
Biomass Fish IBTS (January 2015) EVHOE (November 2014)
for benthic species PELGAS (May 2015) for
pelagic species
MEDITS (May-June 2015) for benthic fish species PELMED (June-August 2015) for
pelagic species
Fish IBTS EVHOE MEDITS
Bivalves IBTS Literature data MEDITS
C and N stable isotope ratios
Zooplankton Literature data Literature data Literature data
In the Bay of Biscay, EVHOE and PELGAS surveys were carried out in November 2014 and May 2015 respectively (Doray et al., 2015; Duhamel et al., 2014), potentially resulting in a temporal mismatch between isotopic and biomass data for pelagic species. Seasonal variation of biomass may occur between spring and late autumn but the anchovy spends most of its annual life cycle within the Bay of Biscay. The pattern may be slightly different for the sardine but only for larger individuals migrating away from the Bay of Biscay. As smaller individuals stay inshore and represent the vast majority of sardine biomass, spring biomass is a pretty good estimator of year-round sardine biomass in the Bay of Biscay (Alheit et al., 2010). Finally, seasonal variation of isotopic ratios is low for sardine and lower than interindividual variation for anchovy (Chouvelon et al., 2015). In the Gulf of Lions, all data were collected from samplings performed consecutively from May to August 2015 during the MEDITS and PELMED surveys so that seasonal variation should be minimal (Bourdeix, 2015; Jadaud and Métral, 2015). Sampled stations (Fig. 1) were on average shallower in the Eastern English Channel (average depth of trawled stations: 42 m, [shallowest: 29 m depth, deepest: 59 m depth]) than in the Gulf of Lions (108 m depth [77-284 m]) and in the Bay of Biscay (141 m depth [19-222 m]). In all surveys, all fish were sorted, identified at the lowest possible taxonomic level, and weighed to determine actual estimated biomass of each species. Pelagic fish acoustic densities are associated with an identification of trawl catches, to estimate small pelagic fish biomass at the Bay of Biscay (PELGAS) and Gulf of Lions (PELMED) scale, according to the methodology described in Doray et al. (2010, 2018b) for PELGAS or Saraux et al (2014) for PELMED, and using the dedicated R package EchoR (Doray et al., 2016). Biomass of benthic species is reported for each trawling station (data available at http://www.ifremer.fr/SIH-indices-campagnes/) and was extrapolated at ecosystem level:
(1) 𝐵𝑀𝑖= ∑
𝐵𝑀𝑖,𝑗× 𝑆𝑗
𝑇𝑆𝑗
with BMi,j the sum of the biomass of species i at all stations of stratum j, Sj the surface of stratum j and
TSj the sum of the trawled areas in the stratum j.
Stratification scheme is based on depth for EVHOE and MEDITS or on ICES statistical squares for IBTS (http://www.ices.dk/marine-data/Documents/DATRAS/Survey_Maps_Datras.pdf;
http://www.sibm.it/SITO%20MEDITS/principaleprogramme.htm). The sum of the area of all stratums is considered to be the area of the whole ecosystem (15 823 km² for the Eastern English Channel, 86 460 km² for the Bay of Biscay, and 13 860 km² for the Gulf of Lions).
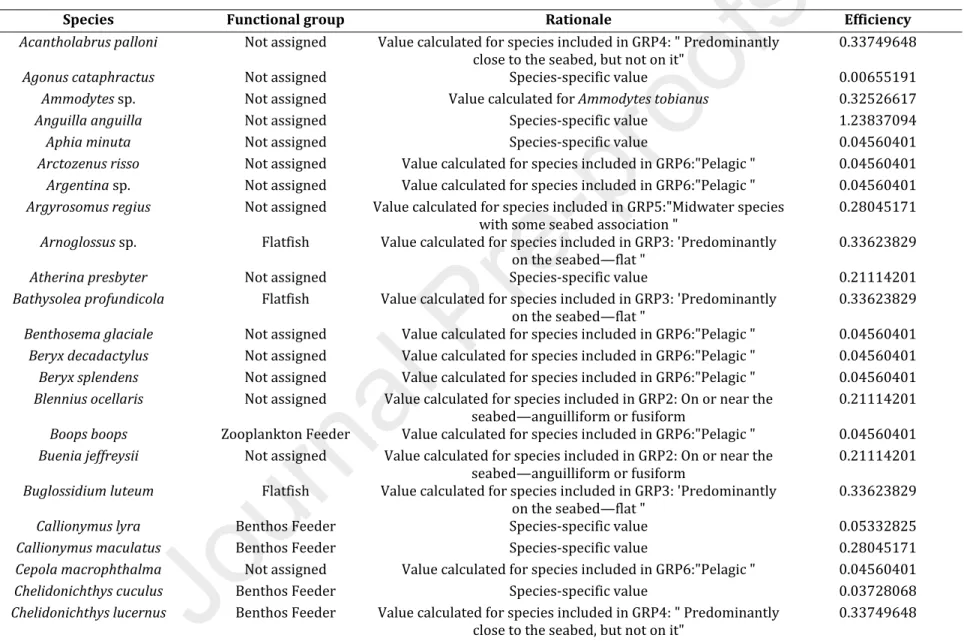
In addition, to offset the lack of acoustic-derived biomass data in the Eastern English Channel, and to correct species-specific catchability, the biomass of all species in the Eastern English Channel and of all trawled species in the Bay of Biscay was corrected using species-specific GOV efficiency, following authors’ conclusion that gear efficiency “provides the proportionality constant between survey cpua
[capture per unit area] and fish density” and as EVHOE and IBTS use the same gear (Walker et al., 2017).
In the absence of efficiency for a given species, the value from the group the species belongs to was used, as groups include species sharing similar life history and habitats (e.g. buried in sediment, close to the seabed or pelagic) and thus similar GOV catchability. Actual values and rationales are provided in Table S1. In the Gulf of Lions, as MEDITS use a different trawl, and as accurate catchability estimations are unavailable, biomass data were not corrected. Yet, benthic fish biomass is much lower in Gulf of Lions than in the Eastern English Channel and the Bay of Biscay when comparing the uncorrected data for all three regions (Fig. S1). For that reason, estimation of total fish biomass in the Gulf of Lions can be considered robust, even though there may be minor deviations from the results presented if corrected with accurate corrections factors. In each ecosystem, total biomass per unit area was calculated as the total biomass of all species sampled divided by the sum of the areas of all stratums. Finally, these data were used to calculate relative abundance of each species in each ecosystem.
An a priori list of species to be collected for stable isotope analysis was defined before the surveys (Table S2), notably considering species that represent more than 70% of the catch biomass in each ecosystem. This resulted in discrepancies in the number of species considered in each ecosystem (16 in the Eastern English Channel, 11 in the Bay of Biscay and 7 in the Gulf of Lions). Among these, four were shared between the three environments: two pelagic piscivores (Scomber scombrus and Trachurus
trachurus), one zooplankton feeder (Engraulis encrasicolus) and one benthos feeder (Scyliorhinus canicula). Individuals of species in this list and of the modal trawled size class were collected, and
stored frozen on board. Different individuals were collected for stable isotopes and energy content analyses. Species considered in this study represented 88%, 88% and 77% of the total raw fish biomass collected during surveys in the Eastern English Channel, the Bay of Biscay and the Gulf of Lions,
respectively (83%, 68% and 77% after applying correction factors for gear efficiency). They were included in five trophic functional groups defined by previous modeling and statistical works analyzing the fish community composition in each ecosystem and based on species diet and morphology (Bănaru et al., 2013; Giraldo et al., 2017; Lassalle et al., 2011). Species were then considered “benthic’
(flatfishes, benthos feeders and demersal piscivores) or “pelagic” (zooplankton feeders and pelagic piscivores). Trophic functional groups allowed a comparison between ecosystems even if species were not the same. Species were also separated based on their average trophic level, using a cut-off at TL 4. This threshold value is classically considered effective as a way to disentangle the complexity of the food web by separating apex predators from small and medium pelagic fish species (Shannon et al., 2014 and references therein).
Back in the laboratory, dorsal muscle samples of fish individuals were dissected, stored frozen, freeze-dried and ground to a fine powder. The powder was then analyzed using a Flash EA 2000 elemental
analyzer equipped with the Smart EA option (Thermo Scientific, Milan, Italy), coupled with a Delta V Plus isotope ratio mass spectrometer with a Conflo IV interface (Thermo Scientific, Bremen, Germany). Stable isotope ratios were expressed following the classical δ notation, as deviation from standards (Vienna Pee Dee Belemnite for δ13C and atmospheric N
2 forδ15N): 𝛿𝑋 =
(
where is 13C or𝑅𝑠𝑎𝑚𝑝𝑙𝑒
𝑅𝑠𝑡𝑎𝑛𝑑𝑎𝑟𝑑― 1
)
× 103 𝑋
15N and the isotopic ratios 13C/12C or 15N/14N, respectively. Accuracy of the measurement was checked
by repeated analyses of internal samples of acetanilide and peptone and was below 0.10 ‰ for both C and N. C/N ratios were determined with the elemental analyzer and used as a proxy of the lipid content of the samples. Since lipids were depleted in 13C relative to other tissue components (De Niro and
Epstein, 1978), lipids were removed from samples with C/N > 4 using cyclohexane following the method developed by Chouvelon et al. (2011).
The main organic matter sources and trophic levels were calculated simultaneously using the Bayesian routine developed within the tRophicPosition R package (Quezada-Romegialli et al., 2018). In contrast to previous isotopic mixing models, this approach does not require assuming one variable to calculate the other (e.g. assuming trophic level to infer trophic discrimination factor when estimating the contribution of a source in a mixing model, or assuming the importance of a source to use it as the baseline in trophic level calculation). The Bayesian framework also propagates uncertainties linked with isotopic variability in sources, consumers and trophic discrimination factors (the isotopic difference between two consecutive trophic levels, TDF hereafter). TDF was set to 1 ± 0.5 ‰ for C and for all consumers. For N, a TDF of 3.4 ± 0.5 ‰ was used for teleosts, and of 2.3 ± 0.5 ‰ for chondrichthyans, so as to cope with metabolic differences in N assimilation between these groups (Chouvelon et al., 2012b). Distribution of TDF values was calculated using the simulateTDF function of tRophicPosition package. Convergence of all models was confirmed with a visual examination of trace plots.
Models consider two baseline values, zooplankton as a proxy of pelagic production pathway and bivalve as proxy of benthic production pathway, with specific values for each ecosystem (Table 3). Following other papers on benthic pelagic coupling (e.g Hayden et al., 2019; Kopp et al., 2015), this approach is powerful as it allows identification of the relative importance of the two types of production in the food web fishes belong to, without any information regarding fish diet. Using consumers in the mixing model, rather than the multiplicity of potential sources, (1) allows the use of a proxy of the matter that actually enters the pelagic or benthic pathway, (2) eliminates the bias linked with the wide spatial and temporal variability of the sources (quite impossible to capture within a feasible sampling), (3) eliminates the bias associated with TDF determination (as there would be several trophic levels between source and fish, and that variability in TDF would accumulate at each trophic level), and (4) avoids the use of an undetermined mixing model, as the number of potential sources would be greater than the number of
isotopes. For example, a high contribution of pelagic production to a fish with benthic behavior would track an increased pelagic-benthic coupling even if fish diet remained the same (Hayden et al., 2019). In the Eastern English Channel, queen scallop Aequipecten opercularis individuals were collected simultaneously with fish, and analyzed following the previously described method. Values measured for
Calanus spp. collected in the same environment in 2016 were used as a proxy of pelagic production
(P. Cresson, unpubl. data). In the Bay of Biscay, isotopic ratios measured by Chouvelon et al. (2012b) for the great scallop Pecten maximus at stations close to the fish sampling stations were considered (Fig. 1). Values measured for small zooplanktonic groups (calanoids, Oithona, Oncaea and Temora) were used as proxies of pelagic production, as these groups dominate the pelagic environment and pelagic fish diet (Chouvelon et al., 2015; Dessier et al., 2018). In the Gulf of Lions, prickly cockle Acanthocardia echinata individuals were sampled during MEDITS and analyzed simultaneously with fish, whereas data for the 200-300 µm zooplankton size class was used as a proxy of pelagic production (D. Bănaru, unpubl. data). Source accuracy is a prerequisite of mixing models. Here, the use of bibliographical data, sometimes collected earlier than the collection of fish, may raise questions regarding the accuracy of models’ output. Nevertheless, the marked isotopic differences, notably for δ13C, between zooplankton and
bivalves are greater than the interannual variations. For example, considering the Eastern English Channel only, values measured for bivalves collected in 2015 are very similar to values measured in 2001 (Barnes et al., 2009), and values for zooplankton are similar to values collected in 2010 (Kopp et al., 2015). This pattern is also conserved between ecosystems. It may guarantee that general patterns observed remain consistent with actual patterns. The model was first applied on pooled species to estimate average trophic descriptors of each assemblage, and then applied on all species separately. Posterior distributions of pelagic contribution and trophic levels were then compared between species shared in the three ecosystems, using the pairwise comparison test implemented in tRophicPosition package. Outputs of pairwise comparison tests must be read as the probability that a species has a posterior distribution of trophic descriptor (trophic level or pelagic contribution) higher than the distribution of the species it is compared to. Significance threshold was set at 95% (C. Quezada-Romegialli, pers. comm.).
Violin plots were then produced to depict the community structure, by weighting trophic descriptors (e.g. pelagic contribution calculated by the mixing model or trophic level) by species relative biomass. Violin plots based on trophic level can be viewed as analogs of trophic spectra, and violin plots based on trophic contribution picture the relative reliance of fish biomass production on pelagic or benthic pathways.
The relative importance of the pelagic production and the average trophic level of the sampled assemblage were calculated with the following formula adapted from Duffill Telsnig et al. (2019).
(2) 𝑇𝐷𝑎𝑠𝑠𝑒𝑚𝑏𝑙𝑎𝑔𝑒=
∑ 𝑇𝐷𝑖× 𝐵𝑀𝑖
∑𝐵𝑀
where TDi isthe trophic descriptor (pelagic contribution or trophic level) calculated with the mixing
model for species i and ΣBMthe total biomass of the species sampled for isotopic analysis.
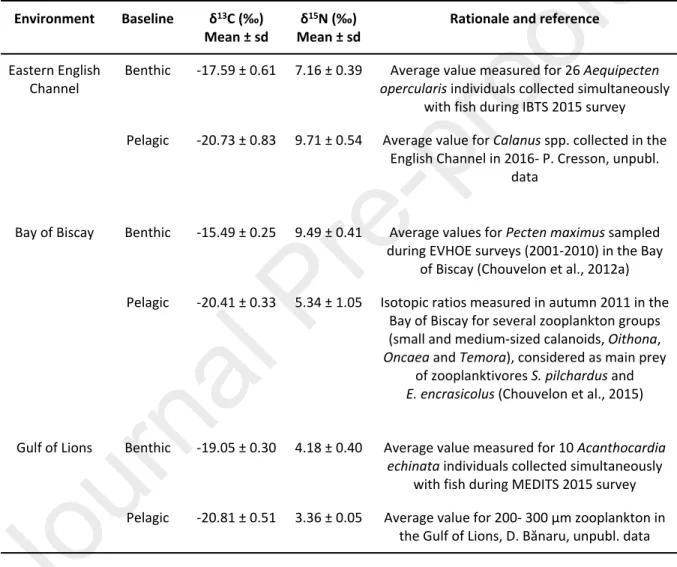
Table 3: Isotopic values used as baseline in mixing models and for trophic level calculation. Sampling locations are detailed in Fig. 1
Environment Baseline δ13C (‰)
Mean ± sd
δ15N (‰)
Mean ± sd
Rationale and reference
Benthic -17.59 ± 0.61 7.16 ± 0.39 Average value measured for 26 Aequipecten
opercularis individuals collected simultaneously
with fish during IBTS 2015 survey Eastern English
Channel
Pelagic -20.73 ± 0.83 9.71 ± 0.54 Average value for Calanus spp. collected in the English Channel in 2016- P. Cresson, unpubl.
data
Benthic -15.49 ± 0.25 9.49 ± 0.41 Average values for Pecten maximus sampled during EVHOE surveys (2001-2010) in the Bay
of Biscay (Chouvelon et al., 2012a) Bay of Biscay
Pelagic -20.41 ± 0.33 5.34 ± 1.05 Isotopic ratios measured in autumn 2011 in the Bay of Biscay for several zooplankton groups (small and medium-sized calanoids, Oithona,
Oncaea and Temora), considered as main prey
of zooplanktivores S. pilchardus and
E. encrasicolus (Chouvelon et al., 2015)
Benthic -19.05 ± 0.30 4.18 ± 0.40 Average value measured for 10 Acanthocardia
echinata individuals collected simultaneously
with fish during MEDITS 2015 survey Gulf of Lions
Pelagic -20.81 ± 0.51 3.36 ± 0.05 Average value for 200- 300 µm zooplankton in the Gulf of Lions, D. Bănaru, unpubl. data
Energy density of four pelagic species collected in the three ecosystems (E. encrasicolus, S. sprattus,
T. trachurus and S. scombrus) was measured following the protocol previously described in Spitz and
Jouma’a (2013). Briefly, whole untreated individuals specifically sampled on board (and not dissected for other analyses) were freeze-dried, ground and burnt in an adiabatic bomb-calorimetry. Energy density measured on dried samples was converted into gross energy content (i.e. expressed relatively to wet body mass), as individual water content was measured as the difference in sample weight before
and after freeze-drying so as to take into account inter-individual and interspecific variability (Cresson et al., 2017).
Comparison of stable isotope ratios and energy density in the three environments was performed with linear models considering environment, fish size and their interaction as covariates, as size may affect isotopic ratios and energy density. Size was considered as a pertinent covariable when a significant effect of size on δ13C, δ15N or energy content was detected and if no interaction between size and environment
was detected (i.e. if size effect was similar between environments). In this case, an ANCOVA and posthoc Tukey tests were rerun without the interaction term. When size effect was not significant, size was no longer considered and means were compared with a one-way ANOVA followed by Tukey posthoc test. When the interaction between environment and size was significant, no mean comparison was performed, as size effect differed between individuals of different size, precluding a robust comparison of means (Table S2). Assumptions of homoscedasticity and of normal distribution of residuals were confirmed with visual examination of residuals vs. fitted and QQ plots. All analyses were run using R software, and the packages car, mass and multcomp (Hothorn et al., 2008; R Core Team, 2018; Venables and Ripley, 2002). Plots were produced with ggplot2 package (Wickham, 2009).
3. Results
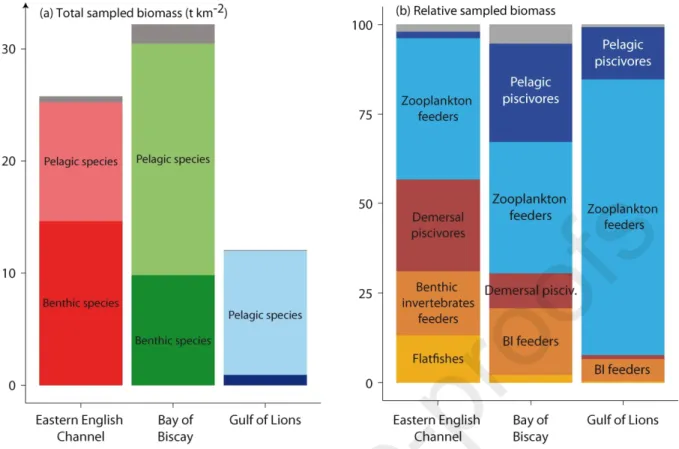
Fish assemblage biomass was higher in the Bay of Biscay (32.15 t km-2) than in the Eastern English
Channel (25.8 t km-2), and lower in the Gulf of Lions (12.1 t km-2; Fig. 3). When split into functional groups,
assemblages were dominated by zooplankton feeders and pelagic piscivores in the Gulf of Lions and in the Bay of Biscay (77% and 15% in the Gulf of Lions, 37% and 27% in the Bay of Biscay, 39% and 2% in the Eastern English Channel respectively) whereas groups of species with benthic affinity (flatfishes, benthic invertebrate feeders and demersal piscivores) represented 57% of the biomass in the Eastern English Channel.
Fig. 3: Composition of fish communities, considering all species, whether sampled for isotopic analyses or not: (a)
total biomass and (b) relative biomass by functional groups. Species were attributed to different trophic groups based on previous papers (Bănaru et al., 2013; Giraldo et al., 2017; Lassalle et al., 2011). In the left plot, light colored zones represent pelagic species; dark colored zones represent benthic species. In both plots, grey zones represent species not included in a group.
Average isotopic ratios measured for the sampled assemblages were significantly lower in the Gulf of Lions and higher in the Eastern English Channel for both δ13C and δ15N (Fig. 3; ANOVA F685,2 =246.6 for
δ13C, F685,2 = 1169.7 for δ15N, p-values <10-5). Average trophic level of the sampled assemblage was
markedly higher in the Eastern English Channel (3.87) than in the two other ecosystems (associated probabilities of 0.94 for EEC > BoB and of 0.98 for EEC > GoL), while trophic levels cannot be considered different between the Bay of Biscay and the Gulf of Lions (3.54 and 3.55 respectively), with an associated probability of 0.56 (Table S1).
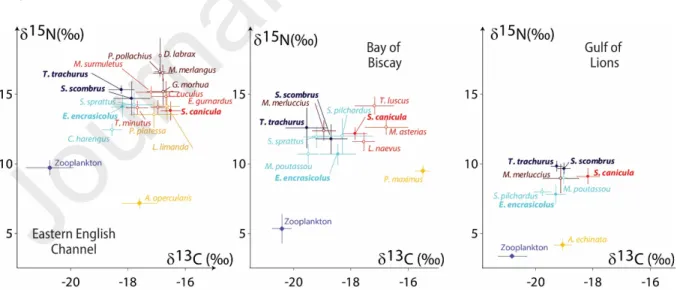
In the Eastern English Channel and the Bay of Biscay, benthic (e.g. Scyliorhinus canicula, Limanda
limanda, Mustelus asterias or Leucoraja naevus) and pelagic species (e.g. Sardina pilchardus, Engraulis encrasicolus, Scomber scombrus or Trachurus trachurus) differed in their average δ13C values by ~2‰,
the latter exhibiting lower values (Fig. 4). The difference was lower in the Gulf of Lions (~1‰). Regarding δ15N and trophic levels, as expected, lowest values were measured in the three ecosystems for
zooplankton feeding species (e.g. Clupea harengus, E encrasicolus or S. pilchardus). Seven species exhibited high (≥4) trophic levels in the Eastern English Channel (M. surmuletus, E. gurnardus,
L. naevus, M. asterias and S. canicula) and one only in the Gulf of Lions (S. canicula). Ranges between
maximum and minimum values for δ15N and trophic level were thus markedly different (5.3 ‰ and 1.6
TL in the Eastern English Channel, 3.5 ‰ and 2.5 TL in the Bay of Biscay, and 2.0 ‰ and 0.6 TL in the Gulf of Lions; Table S1).
Pelagic production was identified as the main source fueling food webs in the Gulf of Lions and Bay of Biscay, with a similar contribution of 85% for both ecosystems (p=0.35 for BoB < GoL). In contrast, the average pelagic contribution was markedly lower in the Eastern English Channel (46%) with high probabilities testifying significant differences (p=0.98 for EEC < BoB, p=0.95 for EEC < GoL).
These general patterns are consistently observed at species level: in the Gulf of Lions, for all species, average pelagic contribution was 90% or more and the upper limit of the confidence interval was 100% (Table S2). The apparent discrepancy in the Gulf of Lions (average contribution of 85% at assemblage level while all contributions are higher than 90% for all species) may result from the impossibility of applying different TDF for chondrichthyans and teleosts within the assemblage. High pelagic contributions were also observed in the Bay of Biscay for all species, even if higher benthic contributions were calculated for some species such as M. asterias or L. naevus. In the Eastern English Channel, modal pelagic contributions ranged between 27% for L. limanda and 79% for T. trachurus. A value of 100% for the higher limit of the 95% confidence interval was calculated for D. labrax and T. trachurus only. Interestingly, in the Eastern English Channel, pelagic and benthic contributions were pretty similar and close to 50% for most species with trophic levels higher than 4, and also for the pelagic species
S. sprattus.
Fig. 4: Stable isotopes biplots. Species shared between the three environments and used for comparative purposes are highlighted with full dots and boldface characters. Symbols are color-coded based on the functional group of the species (light blue: zooplankton feeders; dark blue: pelagic piscivores; red: benthos feeders; orange: flatfishes; brown: demersal piscivores). Isotopic baselines (zooplankton and bivalves) are represented by blue and orange diamonds respectively
As a result of the combination of biomass and trophic data, the shape of the trophic contribution and trophic level violin plots differed between ecosystems. In the Eastern English Channel, 52.1% of the biomass was fueled by pelagic production (Fig. 5), whereas plots for the Bay of Biscay and the Gulf of Lions lied in the upper part of the panel, as a result of the dominance of pelagic-fueled biomass (79.3 and 93.6% respectively). These values differed from mixing models outputs due to biomass weighting (Table S1). Similarly, violin plots based on trophic levels exhibited different shapes, with most of the biomass at low trophic levels in the Bay of Biscay and the Gulf of Lions, and a sharper plot in the Gulf of Lions, as a result of the quick decrease of biomass with increasing trophic levels. The violin was bimodal in the Eastern English Channel, with one peak for mid trophic level species (~3.6) and the other at TL > 4. Average biomass-weighted trophic level of the community was of 3.85 in the Eastern English Channel, 3.60 in the Bay of Biscay and 3.35 in the Gulf of Lions.
Fig. 5: Biomass-weighted violin plots of pelagic contribution (upper panel), and of trophic levels (lower panel) of the three fish assemblages. The wider zone of each plot showed what contribution of pelagic production supports the largest biomass of the community, or the trophic level where most of the biomass lies. Shared species are highlighted with boldfaced characters. Dotted black lines represent the equal contribution of the two sources, and the cut-off at a trophic level of 4. White horizontal lines represent the biomass-weighted average pelagic contribution and trophic level.
The pattern observed at assemblage level was similar for the four shared species. Isotopic ratios were significantly higher in the Eastern English Channel than in the two other ecosystems (Fig. 6). Trophic levels measured for these species did not vary much between all ecosystems (between 3.5 and 3.8 for
S. scombrus, 3.6 and 3.9 for T. trachurus, 3.1 and 3.5 for E. encrasicolus and of 4.4 for S. canicula),
presumably demonstrating a similar trophic role of these species in the food webs of the three ecosystems. The pelagic contribution did not differ between the Bay of Biscay and the Gulf of Lions (differences of about 1 to 9%, with associated probabilities ranging between 0.56 and 0.72). In contrast, the pelagic contribution was systematically lower in the Eastern English Channel, these differences being more or less pronounced between the four species: contributions were lower by ~10 to 20 % for
E. encrasicolus and T. trachurus, by ~30% for S. scombrus and by 45 to 50% for S. canicula. Probabilities
confirmed significant or markedly different contributions between the Eastern English Channel and the Bay of Biscay (p>0.95 for all species but E. encrasicolus) and between the Eastern English Channel and the Gulf of Lions (0.80<p<0.90), but similarities between the Bay of Biscay and the Gulf of Lions (0.52≤p≤0.72).
Fig. 6: Comparison of trophic levels and pelagic contributions, calculated as posterior distribution estimates by tRophicPosition package. Values represent the probability that the higher mode is significantly higher.
Despite different size effects on energy content between environments being precluded from robust statistical comparisons (Table S3), and although T. trachurus and S. sprattus individuals were larger in the Eastern English Channel, higher energy densities were observed in the Bay of Biscay for all species but S. scombrus. Energy densities were always lower in the Gulf of Lions, but as a potential result of markedly lower sizes for S. scombrus, T. trachurus and S. sprattus (Table 4). At species level, S. sprattus was the sole species exhibiting higher energy density than other species (whether significantly higher than two or all other species) in all environments.
Table 4: Energy density (mean ± sd) of shared species (kJ g-1 wet mass). Superscript letters represent significant differences between species within each environment
Eastern English Channel Bay of Biscay Gulf of Lions
n Size (mm) Energy density (kJ g-1 wet mass)
n Size (mm) Energy density (kJ g-1 wet mass)
n Size (mm) Energy density (kJ g-1 wet mass)
Scomber scombrus 5 208 ± 16 6.04 ± 1.60 a 35 209 ± 10 5.37 ± 0.69 b 14 149 ± 22 4.54 ± 0.68 b
Trachurus trachurus 15 130 ± 35 4.49 ± 0.51 b 28 108 ± 28 5.47 ± 1.05 b 9 91 ± 14 3.87 ± 0.32 b
Engraulis encrasicolus 5 96 ± 5 4.38 ± 0.36 b 37 107 ± 20 5.37 ± 0.72 b 7 102 ± 9 4.12 ± 0.34 b
4. Discussion
4.1.What production fuels each ecosystem?
Results of the present study demonstrated that fish assemblages in the Gulf of Lions and the Bay of Biscay are mainly fueled by pelagic primary production while benthic production dominates in the English Channel. The predominance of pelagic production as the main source of organic matter is consistent with previous empirical and modelling studies (Bănaru et al., 2013; Day et al., 2019; Lassalle et al., 2011). Pelagic production can notably enter food webs after sedimentation, through the use of detrital matter of pelagic origin. These results are also consistent with the general assumption that phytoplankton is the main primary producer in the global ocean (Uitz et al., 2010) and the main component of marine POM in French marine environments (Liénart et al., 2017). Isotopic ratios are also higher than the very negative values commonly measured for fish under the influence of rivers inputs (<-20‰, e.g. Darnaude et al., 2004). A direct notable integration of riverine organic matter can thus be excluded, despite the studied ecosystems being partly under the influence of the four largest French rivers (i.e. the Seine River in the Eastern English Channel, the Loire and Gironde Rivers in the Bay of Biscay, and the Rhône River in the Gulf of Lions). It may thus be reasonably assumed that the influence of rivers on fish assemblages on French marine continental shelves would be limited to an increase of phytoplankton productivity through nutrient inputs (Doray et al., 2018a), or to the direct integration of riverine OM in some specific systems such as estuaries and/or under specific oceanographic conditions (Darnaude et al., 2004; Le Pape et al., 2013).
Despite a similar trophic functioning between the Bay of Biscay and the Gulf of Lions, the isotopic pattern observed in the Gulf of Lions (lower δ15N values but rather similar trophic levels) confirms the importance of
oligotrophy as a major driver of this ecosystem (Chouvelon et al., 2018). Phytoplanktonic communities in oligotrophic ecosystems are largely dominated by nano- and picophytoplankton, including diazotrophs (Liénart et al., 2017). Lower N isotopic ratios measured for small-sized phytoplankton (Rau et al., 1990) are classically proposed to explain the low isotopic ratios measured for zooplankton (Espinasse et al., 2014), filter feeders (Cresson et al., 2016) and fish (Chouvelon et al., 2018; Cossa et al., 2012) in the Gulf of Lions. It could nonetheless be acknowledged that the high pelagic contribution in these two systems may result from the lack of benthic species in the isotopic dataset, and notably in the Bay of Biscay where sampled species represent a lower proportion of the biomass. Among the missed species, the one with the highest biomass is
Chelidonychtis cuculus (104 103 t, 4 % of the assemblage biomass), a benthic species with high (around -17‰)
δ13C values, consistent with a high reliance on benthic production (Chouvelon et al., 2012b). But equivalent
biomasses were also recorded for pelagic species (e. g. Boops boops or Capros aper), meaning that the effect of missed species on the general pattern may be limited. This bias would be even more limited in the Gulf of Lions even if species sampled represent a lower proportion of the assemblage biomass than in the two other systems. While Sprattus sprattus was the only important species not included in this system, and with a
relative biomass of ~10%, this species displayed trophic similarities with other zooplankton feeding species such as anchovy or sardine (Brosset et al., 2016; Le Bourg et al., 2015). In addition, benthic fish species displayed δ13C values close to those of the pelagic species, i.e. around -18‰ (e. g. Cresson et al., 2014a;
Polunin et al., 2001; Valls et al., 2014). These patterns further support the importance of pelagic production as the only source fueling the vast majority of fish assemblages in the Gulf of Lions, whether through the consumption of pelagic organisms or through the consumption of sedimented organic matter of pelagic origin, a pattern potentially amplified by recent changes in the pelagic community (Brosset et al., 2016; section 4.2 of the present paper).
The pattern observed in the Eastern English Channel highlights the trophic peculiarity of this ecosystem: higher δ13C values observed at both assemblage level and for shared species are consistent with a higher
trophic contribution of benthic production. The Eastern English Channel is markedly shallower than the two other French environments investigated here and previous studies evidenced the major effect of depth on benthic-pelagic coupling (i.e. upwards fluxes) in this environment (Giraldo et al., 2017; Kopp et al., 2015). Interestingly, in the neighboring but somehow deeper North Sea ecosystem (mean depth 155 m), benthic contribution to the fish assemblage ranged between 29 and 41% (Duffill Telsnig et al., 2019). Most marine systems are fueled by the sedimentation of pelagic primary production (i. e. pelagic-benthic coupling), even at shallow depth (e. g. Carlier et al., 2007; Cresson et al., 2014b in the Gulf of Lions; Le Loc’h et al., 2008 in the Bay of Biscay). A predominant contribution of benthic production is usually limited to very specific systems such as shallow marine coastal or estuarine systems (Christianen et al., 2017; Griffiths et al., 2017) and large freshwater lakes (Vander Zanden et al., 2005). To our knowledge, the Eastern English Channel is one of the few marine systems worldwide where benthic production plays a key trophic role. In the Seto Inland Sea, Japan, Takai et al. (2002) measured high δ13C values for most fish species, including anchovy and
mackerel, as a result of the consumption of benthic invertebrates. In the South Atlantic Bight, off Florida, microphytobenthos can contribute up to 40 % to the primary production even at 40 m depth (Jahnke et al., 2000). As microphytobenthos have high δ13C (Riera, 2007), a significant integration of this source in the food
web may explain the high isotopic ratios recorded in the Eastern English Channel, as exemplified for juveniles soles in different systems (Le Pape et al., 2013). Bacterial transformation of organic matter in sediment or an integration of filter-feeders' pseudofeces cannot be excluded without further analysis (Hayden et al., 2019). These hypotheses cannot be ruled out without further investigation of basal fluxes of OM, notably to ascertain the importance of filter-feeders (Garcia et al., 2011) or OM bacterial alteration in the sediment. Differences in basal food sources among the three ecosystems are also supported by the patterns observed for shared species and the increased differences in the pelagic contribution. The pelagic contribution was fairly similar between systems for the zooplanktivorous species (E. encrasicolus), slightly different for pelagic piscivores (mostly T. trachurus) and markedly high for the benthic species (S. canicula). Due to their larger
trophic plasticity, and their potential detritivory, benthic species are considered as actual opportunists while pelagic species may be more specialists and thus constrained in their feeding choices (van Denderen et al., 2018). A recent study demonstrated that benthic and generalist species responded to a eutrophication-driven increase in pelagic primary production by integrating higher amounts of pelagic derived material, while pelagic species remained pelagic (Hayden et al., 2019). A similar pattern was observed between the ecosystems investigated here. The pelagic contribution was markedly lower for S. canicula in the benthic-based ecosystem while discrepancies remained limited for the three pelagic species, confirming the overwhelming importance of benthic production to fuel the food web in the Eastern English Channel. Nonetheless, comparing the patterns observed for pelagic species may limit the generalization of this hypothesis. The greater difference of the pelagic contribution for S. scombrus compared to the two other species may reflect the ability of this species to supplement its diet with benthic prey, when others are restricted to pelagic subsidies. It may also explain why S. scombrus is the only species displaying higher energy content in the Eastern English Channel.
4.2.Productivity and community structure
Representation of ecological assemblages along discrete or continuous trophic axes -i.e. as trophic pyramids or spectrum - are classical ways to picture communities, understand fluxes and detect anthropic effects as their shape is driven by underlying ecological processes (Bourdaud et al., 2016; Trebilco et al., 2013). The results observed here support the idea that the basal inflow of energy is a major determinant of fish assemblage structure (Udy et al., 2019; van Denderen et al., 2018; Ware and Thomson, 2005). In the Bay of Biscay and the Gulf of Lions, pelagic primary production is predominant, and drives the predominance of pelagic fish species, i.e. specialists sensu van Denderen et al. (2018). In the Gulf of Lions oligotrophic context, low downwards fluxes of pelagic matter do not support a high production of benthic fish species, explaining the low contribution of these groups (Tecchio et al., 2013; Table S4). In contrast, the structure of the fish assemblage in the Eastern English Channel clearly supports the idea that benthic and/or demersal species are more plastic in their ability to use subsidies from both pathways, when conditions (e.g. depth or intensity of pelagic and benthic productions) allow their use, resulting in their dominance over pelagic species. Interestingly, empirical results observed here showed similar patterns to outputs of a model forced by mechanistic energy transfer rules and applied to two case studies, i.e. a shelf system in the Bering Sea with high benthic and pelagic productions and an oligotrophic gyre in Hawaii (Petrik et al., 2019). This consistency is another argument in favor of a strong driving effect of flux intensity on the fish assemblage structure. Shapes of the trophic spectrum observed in the Bay of Biscay and in the Gulf of Lions are consistent with the theoretical expectations. Nonetheless, the spectrum is more bottom-heavy in the Gulf of Lions, as most of the biomass occurs at low trophic levels, even if the biomass of benthic high trophic level species may have been underestimated, due to the impossibility of correcting the biomass for trawl efficiency. Pelagic
production is not sufficient to support a high secondary production, explaining the lowest biomass recorded for the assemblage. The truncation of the food web and the predominance of small pelagic species is consistent with theoretical expectations in oligotrophic ecosystems (Petrik et al., 2019). The predominance of zooplankton feeding species is also classical in the Gulf of Lions. Low energy densities recorded for zooplankton, notably when compared with counterparts in the Bay of Biscay (Chen et al., 2019; Dessier et al., 2018), also confirms that the basal energy is too low to support losses linked with energy dissipation at several trophic levels (Bănaru et al., 2013, 2019).
Lower energy densities recorded for fishes in the Gulf of Lions are consistent with previous values (Albo-Puigserver et al., 2017) and may result from recent changes observed in the pelagic ecosystem (Van Beveren et al., 2014). The body condition of pelagic species, such as sardines and anchovies, declined due to dietary switch and changes in zooplankton abundance and quality (Saraux et al., 2019). Interestingly, the sprat’s trophic niche was demonstrated to be larger than the niches of sardine and anchovy (Brosset et al., 2016). The trophic plasticity of sprat was proposed as an explanation for its higher energy content, as observed in the present and previous works (Le Bourg et al., 2015; Spitz and Jouma’a, 2013). It may also explain why the benthic contribution was higher for sprat than for herring and anchovy in the Eastern English Channel, and also why sprat populations are strongly increasing in many European ecosystems (ICES, 2018; Saraux et al., 2019). In contrast, higher pelagic primary production in the Bay of Biscay may result in increased fluxes in the food web, sufficient to support a higher biomass of pelagic piscivores, consistently with higher fluxes calculated by Ecopath models in the Bay of Biscay than in the Gulf of Lions (Lassalle et al., 2011; Bănaru et al., 2013; Tab. S4). It may also explain the higher values recorded for energy density. The consistency with previous values recorded over the 2002-2010 period seem to demonstrate some stability of ecosystem functioning over the last two decades (Dubreuil and Petitgas, 2009; Gatti et al., 2018; Spitz et al., 2013; Spitz and Jouma’a, 2013). As a result, and even if the minimum trophic level is lower in the Bay of Biscay than in the Gulf of Lions, the biomass maximum occurs at an upper trophic level in the Bay of Biscay. Lower depth may notably allow increased downward fluxes of pelagic production, sufficient to support some benthic production, already observed in model outputs (Lassalle et al., 2011). A previous study calculated that 16 % of the pelagic production reaches the seabed in the Atlantic, compared to only 9% in the Mediterranean (van Denderen et al., 2018). As a result, benthic species make a greater contribution in the Bay of Biscay assemblage than in that of the Gulf of Lions.
As a result of the importance of the benthic pathway in the Eastern English Channel food web, the assemblage also differs, notably regarding the total biomass, the predominance of benthic species and the higher average trophic level resulting in the unexpected shape of the trophic spectrum. Trebilco et al. (2013) identified two factors that may be at the origin of the odd biomass distribution pattern along trophic levels. First, bias in biomass estimation may contribute to an overestimation of the relative importance of some groups. This
hypothesis cannot be completely excluded here. Accurate estimation of fish biomass is a complex task, usually based on several methods that all suffer from their own specific biases. Consequently, it should be kept in mind that biomass values are dependent on the methodology or gear used. When biomass results from trawling, gear catchability limits the robustness of biomass estimation, since species or size classes can escape the trawl. The use of correction factors (e.g. Walker et al., 2017) can be convenient to increase accuracy, but these factors have to be calculated for all gears, species and environments. Stock assessment data is also classically used as a source of biomass, notably in ecosystem models (Bănaru et al., 2013; Girardin et al., 2018; Lassalle et al., 2011; Travers-Trolet et al., 2019). Using such data is nonetheless questionable when addressing questions at assemblage level, as assessment data would be available for harvested species only. Similarly, estimating pelagic species biomass is rendered complex by the aggregative behavior of these species and by the random catches (or acoustic detection) of schools, and by potential questions regarding the accuracy of correction factors. The high importance of zooplankton feeders in the English Channel in winter may for example appear consistent with expectations regarding the functioning of the ecosystem, and with spawning aggregations of Downs herring (Denis et al., 2016), but a careful examination of biomass data show that sprat represented most of the biomass in this group.
Nonetheless, odd-shaped biomass pyramids may also occur in subsidized systems as recently exemplified in temperate and tropical ecosystems (Graham et al., 2017; Mourier et al., 2016; Trebilco et al., 2016) and in biogeochemical model outputs (Petrik et al., 2019), assuming that benthic-pelagic coupling can be viewed as a form of subsidization (McMeans et al., 2015; Polis et al., 2004). The equivalent contribution of pelagic and benthic pathways in the Eastern English Channel may thus explain the shape of the spectrum. Food webs fueled by two trophic sources support higher biomass in the community and at higher trophic levels (Petrik et al., 2019; Udy et al., 2019; Vander Zanden et al., 2005). This hypothesis is further supported by the predominance of the biomass at higher (>4) trophic levels, consistently with the idea that species at higher trophic positions are able to benefit from several trophic subsidies and thus act as couplers of both benthic and pelagic pathways (Rooney et al., 2006; Udy et al., 2019). Bentho-demersal predators, such as whiting or cod, thus play a crucial role in the functioning in the Eastern English Channel ecosystem (Girardin et al., 2018).
4.3.Importance of an accurate understanding of trophic structure and functioning to monitor marine fish assemblages
The current alteration of marine ecosystems worldwide largely supports the need for an integrated vision of their functioning, both to understand the underlying processes and also to manage the sustainability of exploited systems (Halpern et al., 2019). Such an approach requires numerous data to provide quantitative indicators of ecosystem functioning. In most previous studies, qualitative and quantitative data were not collected simultaneously; model outputs were used to fill the data gaps, and then to identify drivers of ecosystem functioning (e. g. Lassalle et al., 2011; Bănaru et al., 2013, 2019; Girardin et al., 2018,