Development of a 3 x 3 Micromachined 190 GHz SIS
Imaging Array
by
Konstantinos Konistis
Submitted to the Department of Electrical Engineering and Computer
Science
in partial fulfillment of the requirements for the degree of
Master of Science in Electrical Engineering and Computer Science
at the
MASSACHUSETTS INSTITUTE OF TECHNOLOGY
May 1998
©
Massachusetts Institute of Technology 1998. All rights reserved.
Author ...
Department of Electrical Engineering and Computer Science
May 11, 1998
Certified by ...
Qing Hu
Associate Professor of Electrical Engineering and Computer Science
Thesis Supervisor
Accepted by ...
. ..-.
...
,,
...Arthur C. Smith
Chairman, Departmental Committee on Graduate Students
//
Development of a 3 x 3 Micromachined 190 GHz SIS Imaging Array
by
Konstantinos Konistis
Submitted to the Department of Electrical Engineering and Computer Science on May 11, 1998, in partial fulfillment of the
requirements for the degree of
Master of Science in Electrical Engineering and Computer Science
Abstract
This thesis studies the design, fabrication, and characterization of a 3x3 micromachined SIS imaging array. The 3x3 array consists of 0.37-A dipole antennas made of Nb whose mixing
elements are Nb/Al-Al203/Nb SIS (superconductor-insulator-superconductor) devices of
3pmx3ipm size and 5kA/cm2 critical current density. The result of the heterodyne mixing
of the local oscillator and the black body signal is a 1.5 GHz signal which is extracted and amplified. The design is such that the sensors operate in the vicinity of 190 GHz. The dipole antennas are fabricated on a 1-pm thick silicon nitride membrane embedded in a micromachined cavity. The pyramidal cavity is formed by anisotropic etching of silicon wafers. A machined section is placed next to the micromachined one to improve the coupling efficiency of the detector. I-V, noise, FTS (Fourier Transform Spectroscopy), beam pattern measurements are conducted to unveil various features of the imaging array. Finally, an initial stage which explores experimentally the integration of local oscillators based on the Josephson effect is presented.
Light weight, compactness, and ease of fabrication are some of the important features of this array of receivers. The lowest noise temperature range across the array elements was
measured to be 62 K - 102 K and the bandwdth 40 GHz for 2.7 K bath temperature. The
uniformity and satisfactory operation of the receivers make the idea of the array attractive for imaging applications.
Thesis Supervisor: Qing Hu
Acknowledgments
I would like to thank my Professor Qing Hu for giving me the opportunity to cross the Atlantic and explore the New World of MIT and for guiding me through this ambitious project. Group 86 of MIT Lincoln Laboratories and Hypres Inc are acknowledged for their
contribution in the fabrication process.
I consider myself lucky to work with other collegues who became my tutors and friends during the past two years, Arifur Rahman, Ben Williams, Bin Xu, Brian Riely, Erik Duerr, Farhan Rana, Ilya Lyubomirsky and Noah Zamdmer. I would like to thank our postdoc Gert de Lange who was the soul of this research project and my patient teacher. My close friends and my family back home were my true inspiration and support, reminding me of little things in life that make it so great.
This work was supported by the National Science Foundation under grant No. 9423608-AST, and by NASA under grant No. NAGW-4691.
Contents
1 Introduction 11
1.1 M otivation . . . .. .. . 11
1.2 Approach . . . .. . . . .. . 13
1.3 Thesis Overview ... ... .... ... .... 15
2 Theory and Design 17 2.1 Theory of SIS Junctions ... 17
2.1.1 General Characteristics ... 17
2.1.2 Types of Detection ... ... 19
2.1.3 Local Oscillator Based on the Josephson Effect . ... 23
2.2 Design Issues . .. .. . . .. .. .. .. ... . . .. . . . 24
2.2.1 Geometry of Horn and Antenna ... . ... 24
2.2.2 Tuning Elements and Impedance Transformation Issues ... 26
2.2.3 RF capacitor/ DC-IF board/ Magnet . ... 28
2.2.4 LO Design Issues ... 30
2.2.5 O ptics . . . .. . 33
3 Fabrication Steps and Preparation of the Experimental Set-Up 35 3.1 Fabrication Steps ... 35
3.1.1 Device Wafer Fabrication ... 36
3.1.2 Micromachining Process ... ... 39
3.1.3 Gold Deposition ... 41
3.2 Preparation of the Experimental Set-Up ... ... 42
3.2.1 3.2.2
3.2.3 3.2.4
Mounting Process of the Wafers . . . . Preparation of the Experimental Set-Up on the Cold Plate of the D ew ar . . . . Description of the Cryogenic Unit . ...
Biasing Circuitry . . . .
4 Measurements
4.1 Array Unpumped I-V Characteristics . ... . .
4.2 Noise Measurements ... ..
4.2.1 Experimental Set-Up and Measurements . . . . .
4.3 Beam Pattern Measurements . ...
4.3.1 Experimental Set-Up and Measurements . . . . .
4.4 Fourier Transform Spectroscopy (FTS) Measurements . .
4.4.1 Experimental Set-Up and Measurements . . . . .
4.5 Josephson Junction Local Oscillator (JJLO) Measurement
5 Conclusions -Future Work
5.1 C onclusions . . . . 5.2 Future Work . . . . . ... A Biasing Circuitry 51 . . . . . 5 1 ... . 52 . . . . . 54 . . . . . 59 . . . . . 59 . . . . . 61 . . . . . 62 . . . . . 63
List of Figures
1-1 Cross section of the detector ... 13
2-1 SISjunction energy diagram. ... 18
2-2 Typical I-V characteristic of SIS junction. . ... 19
2-3 Block diagram of a heterodyne mixer. . ... 20
2-4 Simplified circuit description of heterodyne mixing. . ... 21
2-5 PIF at the first photon step ... 23
2-6 Geometry of the machined/micromachined section. . ... 25
2-7 Integrated tuning structure: (a) planar geometry, (b) equivalent circuit... 27
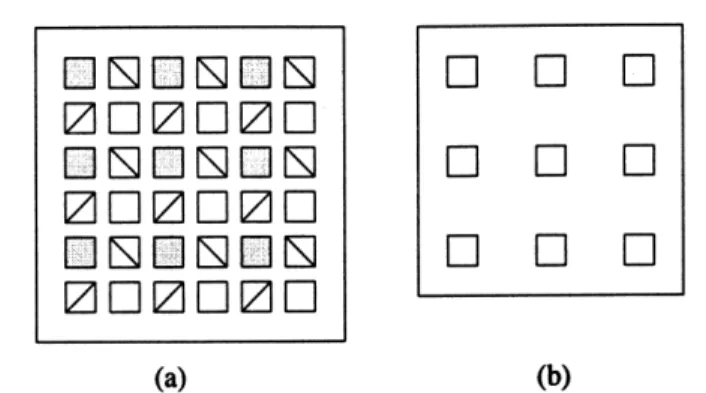
2-8 Selection of a particular design: (a) device wafer with four different designs, (b) top wafer... 28
2-9 RF choke capacitor: (a) planar geometry, (b) equivalent circuit. .... . 29
2-10 A unit of the DC-IF board: (a) planar geometry, (b) equivalent circuit. .. 29
2-11 Expanded view of the array receiver. ... 31
2-12 Planar picture of the receiver with the LO ... 32
2-13 Detail of tuning and coupling structures. . ... 32
2-14 Circuit equivalent of the antenna with LO line and current control line. .. 32
2-15 Optical scheme of the imaging array. . ... 34
3-1 Cross section of a typical Hypres wafer. . ... . 37
3-2 Junction definition: (a) Trilayer deposition and base electrode definition; (b) junction definition; (c) SiO2 deposition and patterning; (d) wiring deposition and patterning. . ... ... 39
3-3 Micromachining steps ... 40
3-4 Top schematic of the cold plate. ... 46
3-5 Cryogenic Unit. ... ... . 47
3-6 Block diagram of a biasing unit. . ... ... 48
4-1 Unpumped I-V characteristics across the imaging array. . ... 52
4-2 (a) Definition of noise temperature, (b) noise temperature chain rule. .... 53
4-3 Experimental set-up for heterodyne measurements. . ... 54
4-4 I-V pumped characteristics and PIF-V for hot-cold load across the array. . 57
4-5 Noise temperature vs frequency across the array. . ... 58
4-6 Experimental set-up for beam pattern measurements. . ... 59
4-7 Beam pattern measurements of elements #5 (center) and #4 (off-axis). . 60 4-8 Experimental set-up for FTS measurements. . ... 62
4-9 FTS measurement of the 140 pm - 190 ,m design . ... 63
4-10 Detail of the stick used for dip-stick measurements. . ... 64
Chapter 1
Introduction
1.1 Motivation
The millimeter wave frequency range (30-300 GHz) has been extensively investigated by many researchers in the last two decades for a variety of applications. An attractive feature of this region when compared with the microwave one is that higher resolution can be achieved because of the shorter wavelength. This also results in more compact and lighter devices. The microwave region has been widely used in the past and the demand for alternative frequency windows has boosted the interest for higher frequencies and larger bandwidths. The optical and infrared region seems to be a better choice but the major drawback is its poor transmission in situations of fog, dust, and inclement weather ([1],[2]). Under these conditions the millimeter waves have unparalleled superiority. From this perspective, there are several millitary applications taking advantage of these features (weapon detection, aircraft landing systems) ([3],[4]). Furthermore, a rise of commercial applications in the millimeter wave region is notable, mainly in the area of communications and radars (PCN, collision avoidance radars) ([5],[6]).
The atmosphere is characterized by many frequency windows in the millimeter wave region. Millimeter and submillimeter spectral lines observed in galaxies have their origin
in rotational transitions of molecules (SO, CO) residing in interstellar or circumstellar
gas clouds ([7]). Thus, the millimeter wave region is attractive for radioastronomical applications. Moreover, remote sensing to monitor air pollutants can be facilitated as well
as remote sensing of the ozone cycle and other atmospheric chemistry ([8]).
Another area of interest is plasma diagnostics. A detailed knowledge of collective behavior of plasmas is important for successful fusion power. Sensitive millimeter wave detectors are useful for this purpose ([9], [10]).
SIS devices as sensors in the millimeter wave range serve satisfactorily most of the above applications. The most attractive feature of SIS is that according to the quantum mechanical mixing theory in quasiparticle tunnel junctions the mixer noise temperature can approach the quantum limit ([ 11]). Thus, the sensor is very sensitive to low-power signals of the millimeter wave range. Furthermore, SIS mixers are not limited by conversion loss which characterizes classical resistive mixers. In fact, they achieve large conversion gain and thus decrease the IF ampifier's contribution to the total system noise ([12]).
Fabrication of small-dimension millimeter wave structures using the standard microwave technology can be costly. The idea of micromachining solves this problem since the well known technology of silicon can be applied ([13]). Moreover, the mature hybrid and monolithic technology can be used for the fabrication of dipole antennas and SIS sensors, promoting the idea of compactness in this frequency regime. Anisotropic etching of silicon is applied to form a pyramidal cavity made of a stack of wafers. The dipole antenna is fabricated on a silicon nitride membrane which practically does not cause any attenuation ([14]). Because of the wide flare angle of 70.60, the gain achieved is low. One solution for optimizing the coupling of incoming waves to the detector is the use of a machined pyramidal cavity on top of the micromachined antenna.
Since the fabrication process can be applied with nearly the same cost on a large area, the idea of an array of detectors can be easily materialized. Applications include imaging and significant reduction of observation time for radioastronomy by a factor of N, where N is the number of sensors ([15],[16]). The mechanical scan of the sensors is significantly reduced. In addition, the imaging achieved is passive which is attractive in terms of power consumption.
The array of sensors has plenty of space for extra integrated circuitry including local oscillators and IF amplifiers. Hence, all the basic units of the mixer could be fabricated monolithically, minimizing the cost for extra devices inside and outside the cryogenic unit.
U
II
Detector Si3 N4 Au Si
Figure 1-1: Cross section of the detector.
1.2 Approach
This research project focuses on a 3x3 array of 0.37-A dipole antennas that use SIS devices as mixing elements. The frequency of interest is in the region of 190 GHz. The antennas are fabricated on a silicon nitride membrane deposited on a silicon wafer. The device wafer is stacked with two backing wafers and one aperture wafer (Figure 1-1). The number of wafers used is such that the desired geometrical characteristics of the cavity are implemented given the thickness of silicon wafers available in the market. The optimum dimensions of the antenna and the cavity have been discussed in [17]. The choice of the center frequency was fixed by the experimental set-up. A Gunn oscillator operating in the region of 95 GHz is connected to a doubler to provide maximum power in the region of 190 GHz. Members of my research group have been working with microbolometers and SIS devices in the region of 95 GHz so the next step for higher frequencies was the second harmonic. It is unfortunate that water vapor has a strong absorption line at 183.3 GHz ([18]). Frequency windows that don't suffer significant attenuation by water vapor or C02 open up at 35 GHz, 94 GHz, 140 GHz, 220 GHz, 340 GHz, 410 GHz. Currently, the 200 GHz band is being used for radio astronomy and for monitoring concentrations of atmospheric constituents
such as CO1 which plays a significant role in the depletion of ozone layer ([8]).
The SIS devices used are made of Nb whose fabrication technology is mature and reliable. In order to achieve better coupling of the radiation received by the antenna to the mixer, an integrated tuning structure has been used ([19], [20]). In that way, proper
impedance transformations ensure maximum transfer of 190 GHz radiation to the SIS device.
Local oscillators using the Josephson effect have been a research issue for many years ([21]). Their integration on the device wafer where the SIS mixers are fabricated promotes compactness, thus making unnecessary the use of an external Gunn oscillator. Furthermore, the difficult problem of directing the power of the Gunn oscillator to the devices with the use of a beamsplitter can be avoided. In addition, the noise performance is optimized since the contribution of the beamsplitter as a 300 K black body is not involved in the chain of devices. HYPRES Inc has been analysing a series of resistively shunted Josephson junctions to achieve a satisfactory power level in the frequency region of 190 GHz. This design has been combined with a simple coupling scheme to provide LO power to the SIS mixer.
This main aim of this project is to verify low noise receiver temperature which is comparable with receiver temperature of other research groups employing other or similar approaches ([22],[23],[24]). The best reported result of SIS devices until now in this
frequency region is 45 K ([22]). In addition, uniformity of characteristics among the
elements of the array is another important issue since it will make the idea of an array more attractive. Finally, a satisfactory operation of integrated local oscillators combined with the current design is another issue of interest.
The fabrication of the device wafer is conducted at HYPRES Inc. In addition, the micromachining of the device wafer is performed there. At MIT Lincoln Laboratories we micromachined the backing wafers and the aperture wafers, aligned and stacked the wafers. For testing purposes, designs of different center frequencies have been implemented so many stacks of wafers have been prepared.
Measurements will focus on I-V characteristics with (pumped) and without (unpumped) external radiation, IF (Intermediate Frequency) power vs V, FTS (Fourier Transform Spec-troscopy) and beam patterns. I-V characteristics show the quality of the SIS junctions and the degree of external radiation coupling. IF power peak at the first photon step is used to find the noise performance of the receiver when hot (300 K) and cold (77 K) loads are placed in front of the window of the cryogenic unit. Furthermore, a good characteristic of a receiver
is the broad bandwidth around the designed frequency. Hence, different frequencies can be tested for their noise performance. In terms of coupling, FTS measurements provide information in the frequency regime. Finally, beam pattern measurements can show the gaussian properties of the detectors across the array.
1.3 Thesis Overview
The theory of SIS mixers and the design issues involved will be presented in chapter 2. The fabrication process along with the preparation of the experimental set-up will be discussed in chapter 3. The measurements will be presented and analysed in chapter 4. Finally,
Chapter
2
Theory and Design
An efficient receiver must be equipped with a sensitive solid-state device that is placed in a well-designed electromagnetic environment. The designer must understand the operation of the device and choose the optimum coupling scheme that fits its requirements. The following discussion will present some theoretical issues of the SIS device and the microwave design of the receiver.
2.1 Theory of SIS Junctions
The theory of superconductivity is elegant as well as complicated since it lies heavily on many-body theory. The monumental work of J. Bardeen, L. N. Cooper and J. R. Schrieffer on the interpretation of superconductivity resulted in the nobel-prized BCS theory ([25]). I would not try to get into the essence of this approach. I will briefly mention some basic results of the operation of SIS devices which are mainly presented in [7], [26]. The interested reader is urged to read the above for more details in a less formal approach than
BCS theory.
2.1.1
General Characteristics
In metals above a temperature, known as critical temperature Tc, the electrons move ran-domly because of thermal agitation. Below Tc, the metal no longer behaves as normal.
I
D (E) D2(E)Figure 2-1: SIS junction energy diagram.
The superconductive state is characterized by the collective motion of electrons which form pairs, the so-called Cooper pairs. These pairs are formed by electron-phonon interaction which results in a weak attraction between the electrons. The minimum energy to break the Cooper pair into two so-called quasiparticles is 2A, where A is the energy for one quasipar-ticle excitation. The superconductive state of all the Cooper pairs can be represented by a single wavefunction T.
The SIS device consists of two superconductors separated by a thin insulating layer which allows quantum mechanical tunneling of Cooper pairs and quasiparticles. When
the bias voltage is IVI < A~+ no current flows since there is not enough energy to
break Cooper pairs. When IVi > AA2 Cooper pairs break and the quasiparticles tunnel
through giving rise to current following an almost linear characteristic of a normal metal. A simple picture to describe the behavior of a superconductor, especially when it is part of a junction, is given by the 'semiconductor model'. The energy gap in this semiconductor approach is 2A, the valence band accounts for the 'quasiholes' and the conduction band accounts for the 'quasielectrons'. Each band is described by its respective density of states,
No Radiation
iation
Vg V
ho
e
Figure 2-2: Typical I-V characteristic of SIS junction.
D(E) OC E
An important feature of the SIS device appears when external radiation is applied, leading to a step structure of the I-V characteristic. The absorption of n quanta inside the
barrier is sufficient to cause quasiparticle tunneling when
leVI
+ rdiw >A, + A
2 (Figure2-1). In the same fashion, emission is possible and for this case n is a negative integer. We will see shortly that our interest is on the first photon step where absorption of a photon takes place. This has to do with the fact that it is close to the I-V nonlinearity at the gap voltage (Figure 2-2).
Apart from the single-particle current, Cooper pair tunneling is also possible giving rise to the so-called supercurrent. BCS theory has derived the maximum value of this DC
current for zero applied voltage to be Ic = .-V-, where I is the normal state resistance. The
suppression of the supercurrent can be achieved with the application of external magnetic field.
2.1.2 Types of Detection
The SIS devices can operate in two different modes, direct (or video) detection and hetero-dyne detection.
When direct detection is considered, incoming photons are converted into DC current. SIS devices can reach the quantum limit where every photon causes tunneling of an electron. Information of phase is lost, only the power level and the frequency of the incident radiation can be extracted from the I-V curve. The leakage current of the juction determines the noise
LO
Signal
Processing Figure 2-3: Block diagram of a heterodyne mixer
(here, shot noise) of the detector.
Most of the applications of SIS junctions stem from the heterodyne detection (Figure 2-3). Incoming radiation of frequency f, is combined with a local oscillator signal of frequency fLo. The SIS device acts as a mixer, producing a signal of the intermediate frequency (IF) IfLo - fsl. In this mode of operation, the information of power level, phase and frequency of the signal can be extracted from the IF signal. Furthermore, no extra noise is added, only the zero point noise of the incoming radiation is amplified by the mixer gain.
Direct Detection
If we represent the external radiation by an additive sinusoidal term to the DC bias point, the quasiparticle energy level of interest is split into discrete energy levels ofhw separation. The external radiation leads to a different DC I-V characteristic as well as to the creation of a current component of the same frequency. Both are contributing to the current rensponsivity which is defined as :
Ald
Ri A .d (2.1)
Following the derivation of [26], we can prove quantum mechanically that
e Idc(Vo +hw/e) - 2Idc(Vo) + Id(Vo -w/e).2)
hw Idc(Vo +hw/e) - Idc(Vo -hw/e)
GL
'L0
L
GO \ </ VDC
RF Circuit DC Circuit
Figure 2-4: Simplified circuit description of heterodyne mixing.
where V is the DC bias voltage. When we are dealing with low frequencies, the above expression leads to the classical result:
1d2 dcdV2
Ri dc/dVo hw < e IVo. (2.3)
2 dIdc/dVo
Thus, a classical mixer does not have an upper limit of responsivity. So, by increasing the curvature of the nonlinearity we could get a significant responsivity. This cannot be verified experimentally. The quantum mechanical limit of the current responsivity is
e
Ri -+ ', hw _ e IVol . (2.4)
This can happen when a single photon is sufficient to make a quasiparticle tunnel through the barrier. We could expect that if the nonlinearity starts at Vo and Idc(Vo +hw/e) is much higher than the rest of the terms, quantum limit is almost reached. Thus, the first photon step is the region of interest. The detailed description of the DC curve is sufficient to describe the interaction with external radiation.
Heterodyne Detection
The phenomenological theory of mixing described in [26] lies on the simplification that the IF signal is of low frequency that can be treated as DC signal. Consequently, the LO and the signal are considered to have the same frequency.
used is the conversion gain which is also called inverse conversion loss. It is defined as
L-' PIF (2.5)
The IF signal is derived as the differential signal of IDC and the RF signal as the differential of ILo, with Vdc held constant in both cases. If we define
OIi
G - (2.6)
where i, j - 0, w, the maximum conversion gain can be proven to be
L-1 v(Vdc, PLO, Gs) = L (1+g g -+ 1 g > (2.7)
00, 1 + g, < r7
where Lo Ga, - , o and g G- . The factor 77 is characteristic of the device
of interest and embodies its nonlinearity. For a classical mixer, where the current changes
instantaneously with voltage, it is found that L-' = L = 0.5 and this is achieved for
,q = 1. Thus, the mixer does not show actual gain.
The quasiparticle mixer behavior comes into play when we are dealing with high enough frequencies so that the assumption of instantaneous change of current with voltage fails. In
this case, Lo1 can be greater than unity leading to a net conversion gain
L-1' L 4e 4g, 1 (2.8) 0 + g, gL
where gL - G. Hence, the conversion gain becomes proportional to the applied load.
This behavior is typical of a current source. Furthermore, it is possible to get r > 1 which can happen when the pumped characteristic shows a negative impedance region. Working in the negative differential region can lead to instabilities as explained in [26]. In general, the SIS device is designed to operate in a positive differential impedance region with a sufficient conversion gain.
It is not straightforward to relate the conversion gain with the noise temperature perfor-mance of the receiver since it demands strict quantum mechanical formulation. A simplified
I
hco
e
Figure 2-5: PIF at the first photon step.
explanation is presented in [26]. For practical cases, whenever we have a satisfactory con-version gain, the shot noise of the receiver is low.
A typical I-V characteristic with PIF is shown in Figure 2-5
2.1.3 Local Oscillator Based on the Josephson Effect
A brief introduction of the Josephson effect for LO signal is attempted here. The simple picture given below, is mainly derived from Hypres Inc reports.
SIS junctions can be used as voltage-controlled oscillators. The basic equations gov-erning the Josephson effect are:
I = Ij sin(4) (2.9)
S= V
(2.10)
dt (Do
where 0o = 2.07pH-mA the flux quantum, I the Josephson current flowing the tunnel
junction, V the applied voltage and D the phase drop across the junction. These equations show that an oscillating current of voltage-controlled frequency will be generated.
An inherent disadvantage of this type of LO is the low power, low impedance and broad linewidth of a single junction. If an array of phased-locked LO is used, the generated power will be multiplied by the number of junctions. The available power from such an array to a matched load is proven to be
where Ic is the critical current and Rj the junction shunt resistance.
The linewidth of the radiation emitted by a single Josephson junction is proven to be 40 MHz/K-2. For an array, the linewidth is reduced by a factor of 1/N for N junctions.
2.2
Design Issues
The fundamental issues that concern the RF designer can be summarized to the following: geometry of the coupling structure, efficient operation of the solid-state device when placed in the coupling structure, separation of the various frequency channels (RF, IF, LO, DC), satisfactory optical scheme. The discussion that follows will address these questions and present the design solution.
2.2.1 Geometry of Horn and Antenna
In general, the device used for electromagnetic detection must be accompanied by a satis-factory coupling structure so that the potential of the detector is fully exploited. Figures of merit commonly used, ([27]) are:
* coupling efficiency * cross polarization levels * gain
* directivity.
Extensive research has been conducted in micromachined horn antennas by the Univer-sity of Michigan ([28], [29], [30], [31]).
An electromagnetic cavity is formed by a stack of micromachined wafers.
Microma-chining is performed by anisotropic etching of silicon wafers: KOH etches the < 100 >
face faster than < 111 > forming a pyramidal cavity of 700 flare angle.
The antenna is fabricated on a Si3N4 membrane which is embedded in the
n Q'q 1
15 mil 15 mil 15 mil 22 mil
Figure 2-6: Geometry of the machined/micromachined section.
dissipation and a notable mechanical strength. Thus, the antenna is standing practically in the free space. A simple 0.37-A dipole antenna is used.
The inherent disadvantage of this design is the wide flare angle leading to an antenna gain less than 13 db and the 10-db beamwidth larger than 900. A machined small flare-angle pyramidal section, placed next to the micromachined cavity proved to be a good coupling structure. This extra section acts as a mode converter. The main contribution comes from
TEIo, TE 12, TM 2, TE30 and their interference depends on the particular geometry. The
far-field patterns are circularly symmetric and the cross-polarization is sufficiently low. The design chosen for this project is theoretically proven to have the following features:
* 20 db antenna gain
* 340 10-db beamwidth
* -27 db sidelobe level (E-plane)
* -22.7 db cross polarization level.
The various parameters of the pyramidal cavity are shown in Figure 2-6 in units of the designed center wavelength of operation. For the 190 GHz design, the theoretical geometry
is approximated by a stack of two backing wafers, the device wafer and a top aperture wafer. An important design issue for coupling RF power to the SIS detector is the impedance seen from the antenna leads. Simulations in [17] show that the impedance is approximately 50 92. Having this in mind, we could substitute the antenna and the cavity with a resistor, right at the antenna leads. In that way, microwave coupling issues become less complicated. A word of caution though; this simplification is valid as long as the frequency of operation is close to the designed frequency. Otherwise, the impedance will be frequency-dependent and not purely resistive.
The machined horn is made with a milling machine using the split-block technique. High packing density is achieved, facilitating the purpose of imaging. The array is made of six gold-plated tellurium copper blocks and fabricated at Lincoln Lab.
2.2.2
Tuning Elements and Impedance Transformation Issues
For a maximum transfer of RF power to the SIS junction, the geometrical capacitance must be tuned out at the operation frequency. A technique that has been successfully used in [19], [20], [7], [32] is the integrated tuning structure. The antenna structure that we use has planar geometry. The dipole itself consists of two Nb strips of finite width. The feeding circuit is two coplanar Nb strips which are connected to the antenna pads. If we place dielectric and a thin metallic strip in the center and along the above wide microwave structures, the perturbation will be small and to a first degree, can be ignored. Thus, one of the coplanar Nb strips can be utilized as the ground plane of a microstrip structure. This ground plane is connected to the base electrode of the SIS (the first 'S'). Likewise for the top plane and the counterelectrode (the second 'S'). This microstrip starts from the antenna leads so that the antenna impedance can be conveniently placed there for the design calculations.
The choice of the SIS geometry was restricted by the design rules imposed by our wafer supplier, Hypres Inc. The minimum size of the junction is limited to 3umx3[tm,
the capacitance is 38 fF/pm2 for a dielectric with Er = 5.4 and thickness 0.2 Pm. The
critical current desity for this batch of devices was 5kA/cm2. Given the above, the normal
1 --Capacitance Tune-out mpedance Transformation (a) (b)
Figure 2-7: Integrated tuning structure: (a) planar geometry, (b) equivalent circuit.
0.342 pF. Since the antenna impedance is 50 Q, we can expect a significant impedance mismatch. Thus, two issues have to be resolved: first, the capacitance must be tuned out, and second, the SIS impedance must be transformed to the antenna impedance.
To tune out the capacitance, an open-ended tuning structure is used and the impedance transformation is achieved by a second microstrip (Figure 2-7). The impedance seen at the
end of the microstrip is oo and after ARF/ 4 it is transformed to short circuit. By choosing
a microstrip a bit longer than ARF/4, the microstrip seen by the SIS is inductive. Thus, the capacitance can be tuned out. The second microstrip is chosen to transform the low impedance to the required 50 Q.
The above calculation has to be made in the context of superconductive properties where skin effects are important. A detailed analysis on the calculation of parameters involved in determining the characteristic impedance of a superconductive microstrip can be found in
[7], [33].
We must take into consideration the following issues in the design: a) the external Gunn oscillator has a narrow bandwidth, b) the antenna impedance is frequency-dependent, c)
DEOINDE
El N Et:l N 0 IS]
WEIZOIDO
0
ZLZZD
000l00
0Z0Z0Z
0
O
0
0
O
0
DDLI]
(a) (b)Figure 2-8: Selection of a particular design: (a) device wafer with four different designs,
(b) top wafer.
the fabrication process has some error margins for the length of the microstrips, d) there may be a dispersion of fabricated SIS areas as well as current densities, e) the best noise performance does not coincide with the optimum gain performance. That's why for this batch different lengths of microstrips were tested. We named the devices according to the
length of the first and second microstrip in pm. The designs implemented are: 155 - 190
(165 GHz), 145 - 190 (174 GHz), 140 - 190 (178 GHz), 135 - 160 (188 GHz), 130 - 160
(193 GHz), 125 - 160 (198 GHz), 120 - 140 (208 GHz), 110 - 140 (222 GHz).
Gerhard de Lange came up with a very handy way to implement the following designs on chip. Every device wafer hosts 6x6 antennas of 4 different designs. The top wafer is the one that selects the devices of interest. Figure 2-8 illustrates the above.
2.2.3 RF capacitor/ DC-IF board/ Magnet
The generated IF signal from the SIS mixer must be directed to the external IF amplifier. It travels towards the antenna pads via the coplanar strips. The problem that we face is that the DC bias must follow the same path and the IF signal must not be lost at the DC bias connection. Furthermore, the RF power must be directed to the microstrip tuning structure and not the coplanar strips. The latter is solved with the fabrication of a RF choke capacitor and the former with a T-circuit which is implemented with a DC-IF board.
The RF choke is formed by a layer of metal below the coplanar feeding strips at a distance
ARF/4 from the dipole antenna (Figure 2-9). For the RF signal, the capacitor behaves like
ads C 1 C2 --XRF/4 3../4 (a) (b)
Figure 2-9: RF choke capacitor: (a) planar geometry, (b) equivalent circuit.
r -AnI nrF
R=10 k DC
c;=2zz pr Ground
IF
(a) (b)
Figure 2-10: A unit of the DC-IF board: (a) planar geometry, (b) equivalent circuit.
signal will be highly reflected in this path and guided to the integrated tuning structure. We should point out that there is some length ambiguity since it is hard to tell where we should measure the AR/4 distance due to the finite size of the capacitor plate. It turned out that this is not very critical for the measured noise performance. Even without the RF choke
capacitor (which occured as a fabrication error), good results were measured because of the
impedance mismatch between the planar structure of the pads and the coplanar strips. The DC-IF board is connected to the antenna pads. It was designed by Gerhard de Lange and fabricated at Lincoln Lab. It is made of Duroid 6010 material. One side (ground) is
coated with Au, while the microstrips are printed on the other side which is shown in
Figure 2-10. The chip capacitors C1, C2 are virtually shorted for the IF signal and open for
the DC signal. Thus, the path containing C, is permitted for the IF but blocked for the DC
signal. C2 is transformed into an open circuit at a distance AIF/
4, so the IF signal is blocked
while the DC signal can pass. The chip resistor R is used to avoid any charge built-up. m
The suppression of Josephson effects is achieved with a magnet placed between the DC-IF board and the backing wafer. A copper coil is used with approximatelly 2500 turns of Nb wire (Supercon T48B). The direction of the magnetic field (perpendicular to the junction) is not optimum. However, the field distribution is not uniform and a tangential component of the magnetic field can be produced. Hence, the Josephson current is satisfactorily suppressed.
Figure 2-11 illustrates the various parts of the receiver discussed so far.
2.2.4 LO Design Issues
Here, we will not try to get into the design of the local oscillator. It is a rather complicated research project of Hypres Inc. Let's take for granted that LO signal of the desired frequency is generated. We wish to couple this signal to the SIS junction. The coupling must be such that no significant RF signal is lost at the LO structure. The LO signal reaching the junction must not be weak, otherwise no photon steps will be observed. On the other hand, it should not saturate the device. Hypres Inc has reported output power in excess of 3.5 /W at 120 GHz using a 60 Q load.
Another degree of complication is added by the introduction of a control line for the suppression of Josephson effect. Replacing the magnet, a Nb strip supplied with DC current and passing over the SIS, creates the desired magnetic field. This extra line must not affect the integrated tuning structure or the LO line.
The actual receiver is illustrated in Figure 2-12 and the various microstrips involved in tuning and coupling are shown in Figure 2-13. A simplified schematic is shown in
Figure 2-14 with the various metallic layers (M2t stands for M2 layer used for impedance
transformation, M2c stands for M2 layer used for coplanar feeds). The lengths 11, 12 are
selected in the way we described earlier. The pieces of M2t of length 13 and 14 are not
connected with each other. If we assume that they are practically connected due to the
capacitive coupling, then if lengths ARF/ 4 are chosen, the integrated tuning structure will
not be affected. If one wants to be precise, the microstrip discontinuities must be carefully modelled with equivalent circuits. Given the limited time frame of this research, no actual
Machined Horn Array
Micromachined
Horn Array
Magnet
Figure 2-12: Planar picture of the receiver with the LO.
Figure 2-13: Detail of tuning and coupling structures.
calculation was made.
The LO signal is capacitively coupled to the M1 - M2t. The position where the
inter-connection is established is such that the resistance seen from that point is purely resistive. Again, detailed calculations taking into account T-microstrip structures and discontinuities were not done. So, it was assumed that the capacitors were shorted and the angles of the microstrips did not matter. For better coupling, other designs covered in most microwave textbooks can be tested in the future (e.g interdigitated coupler). The demand for resistive behavior was posed by Hypres Inc, because they had performed simulations with resistive
loads. Non-restistive loads turned out to cause instabilities to the LO circuit.
2.2.5
Optics
For an imaging system, it is crucial to have the right spacing between the detectors. The dimensions of the machined apertures limit our flexibility for optimum separation, a simple calculation of which is given below.
We use the Gaussian optics formulation which facilitates the computations ([34], [35]). The power density of a Gaussian beam is given by
P(r) = e-2(r/w(z))2
(2.12)
P(O)
and the propagation of the waist obeys the equation
w(z) = wo 1 + (2.13)
where z is the direction of propagation, r is perpendicular to z, wo is the minimum beam
waist and ZR = -x, A is the wavelength. The 01/e2 is derived by taking the limit of large z
and small angle approximation (tan(01/e2) - 01/e2), so 01/e2 e ~- for r(z) = w(z). The
7rWo
angle of half power 03db is found for r(z) = 0.59w(z) , so 0
3db , 0.5 901/e2.
When a thin lens is used and the incoming beam has its minimum beam waist wo located
at the focal distance of the lens f, the outgoing beam has minimum waist w = x locatedthe focal distance. Thus, woat we conclude from the above equations that
O -, x CA 0 , D 3 3 .7n
0 Distance from array (mm) 300
Figure 2-15: Optical scheme of the imaging array.
outgoing beam. For spatial separation d between two beams, the angular separation will be
08 O f. For imaging purposes, one of the requirements usually posed is 0, = 203db which
leads to the spacing rule d , 1.16wo0.
The size of the machined pyramidal horn is 3.56A which corresponds to 5.6 mm at 190 GHz. As a result of the split-block technique, the separation between the elements is 6.5
mm. The beam waist can be found to be wo ? 1.75 mm by noticing from simulated results
that 01/e2 = 160. Thus, d ~e 3.7w0o which implies an undersampling.
The optical system is a simple Gaussian telescope: it consists of two lenses separated by their respective focal distances. One of the features of this optical scheme is that the
ratio of input and output waist is independent of the frequency of operation: wol= - .
The lenses, made of Teflon, have focal distances 37 mm and 100 mm, located inside and outside the cryogenic unit respectively. The choice of these focal distances is dictated by the limited space and the small window of the cryogenic unit.
Chapter 3
Fabrication Steps and Preparation of the
Experimental Set-Up
The implementation of the design discussed in the previous chapter depends highly on the quality of the fabrication steps and the preparation of the experimental set-up. This chapter focuses on the fabrication conducted at Lincoln Lab and at Hypres Inc. It was fortunate that our wafer supplier prepared high quality devices without noticeable deviations from our design. For the experimental set-up, there are many problems involved that one cannot easily resolve by searching the bibliography. Numerous "tricky" issues were solved by the the expertise of Gerhard de Lange.
3.1 Fabrication Steps
The imaging array of this project consists of the device wafer, the backing wafer and the aperture wafers. All must be micromachined to form the pyramidal cavity. The critical and still techologically challenging issue of SIS fabrication was conducted by Hypres Inc using the industrial design rules that have proven to be reliable over the time. Since we are dealing with many detectors on the same chip, uniformity and repeatability are very important in order to reach reliable conclusions about the future applications of the imaging array of this project. The micromachining of the device wafer took place at Hypres Inc whereas the micromachining of the rest of the wafers was completed by us at MIT Lincoln Laboratories.
A description of the current fabrication follows along with a brief mention of the fabrication of our former wafer supplier and members of this research group. We conclude this section by presenting the micromachining steps and the gold deposition process.
3.1.1 Device Wafer Fabrication
HYPRES Inc fabrication process makes use of niobium for the SIS junctions as well as for planar metallic circuitry. Niobium has a high critical temperature ( 9.5 K ), electrical and thermal stability and thermal cyclability. These characteristics make Nb the metal of choice. In order to solve the problem of oxidization, Ti/Pb/Au are used for the wafer contacts.
SIS junctions are formed by a trilayer deposited on the whole wafer to achieve unifor-mity. The wafers used are silicon wafers which are covered on both sides by low-stress silicon nitride of 1-Mm thickness fabricated by low-pressure chemical vapor deposition
process (LPCVD). The trilayer consists of NblAl-Al203/Nb. The first Nb layer of the SIS
junction is commonly called the base electrode and the second one the counterelectrode when viewed from the cross section. The SIS junction is defined by patterning the area of
the counterelectrode. In this process, the capacitance of the junction is 38fF/ Am2.
The available layers for a typical fabrication process of HYPRES Inc when viewed from
the substrate to the upper metallic contacts are the following: Mo Nb layer, Io SiO2 layer,
M1 trilayer, SiO2 layer, R2 resistive layer (1 Ohm/sq. ), SiO2 layer, M2 Nb layer, 12 Si02
layer, M3 Nb layer and R3 Ti layer for contacts. R2 is made ofMo. The design rules for
the various layers can be found in [36].
Since there are many layers available for the circuit designer, the fabrication steps are numerous. Mo Nb layer is deposited on top of the substrate and the area of interest is defined by spinning photoresist, developing, RIE etching of the unexposed Mo layer and stripping
the photoresist (abbrev. PDRS). Io area is formed by depositing Si02 and patterned by
PDRS. Likewise, for the M trilayer. The trilayer is deposited in cryopumped load lock d.c
magnetron sputtering system with a base pressure of better than 5x10⁵ Pa. All the metals
Sub. M4(100 nm)
U
E
A2 (11 nm) R2 (100 nm)
M3(600 nm) M2(300 nm)
Figure 3-1: Cross section
MI BE (130 nm) o(150 0 nm)
MICE(7 0 nm) SiO2 (100 nm)
R3 (1000 nm) 12 (500 nm)
layer of Nb and the subsequent layer of Al, follows the critical step of oxidation of Al to form the oxide of the SIS junction. The parameters that affect the current density of the junction are the oxidation time and the oxygen pressure. For a fixed oxygen pressure the current density decreases as a function of oxidation time and for fixed oxidation time the current density decreases as a function of oxygen pressure. As mentioned above, the SIS junction area is defined by the area of the counterelectrode. Thus, a photoresist layer
is deposited and PDRS follows. After stripping the photoresist, a first layer of SiO2 is
deposited to serve as the substrate for R2 resistive layer from which the resistor is defined
by PDRS. On top, a second layer of Si02 is deposited. PDRS process results in the removal
of the underlying SiO2 in the regions of interest. M3 layer is deposited on top and the
designed planar circuit is formed by PDRS. Finally, Au contacts (R3) are made by spinning
photoresist, developing, Au evaporation, and lift-off. A typical cross section of a processed wafer is shown in Figure 3-1.
The patterning of the SIS junction is still an important research issue in many research groups. Edward Garcia and Brian Jacobson in our group fabricated SIS junctions and antenna structures using SNAP (selective niobium anodization process ) [14]. The areas that are anodized are converted into niobium oxide of the counterelectrode layer. Thus, the required SIS space is protected during the anodization process. In the past, the supplier of device wafers was A. W. Lichtenberger's research group from the University of Virginia. Two approaches were adopted for the SIS definition [37]. In the first approach, SNEP (selective niobium etching process) was used and in the second, a modified SNEP was applied.
Hypres Inc makes use of a simple SNEP technology which is efficient for large SIS
junctions. The counterelectrode is patterned with a mask and reactively etched by CF4/02
in a RIE system. The aluminum oxide acts as an etch stop and the junction is formed. A simplified flow process is illustrated in Figure 3-2.
R
im
Nb
A1
20
3Insulator
Metallization
Figure 3-2: Junction definition: (a) Trilayer deposition and base electrode definition;
(b) junction definition; (c) Si02 deposition and patterning; (d) wiring deposition and
patterning.
3.1.2 Micromachining Process
At Lincoln Lab, the Si wafers with the silicon nitride membrane on both sides are ultra-sonically cleaned in aceton-methanol and rinsed in deionized water. In order to remove any organic residues, they have to be plasma-ashed for 2 min. Then, we spin positive photoresist AZ512 , with a speed of 4000 rounds per min. It is a good practice before spinning to clean the wafer from any dust particles with nitrogen blow. In that way, the photoresist is uniformly distributed all over the wafer. The photoresist must be free from air bubbles which can cause nonuniformity. The photoresist is hardened by baking the wafer for 2 min at 1000 C. The next step is the mask alignment. The appropriate mask, which is initially cleaned in nanostrip and rinsed in DI, is mounted over the Si wafer at the mask aligner. It is very important to align the crystal axis of the Si wafer with the mask. Any misalignment can cause shifted apertures during the step of anisotropic etching leading to a misaligned stack of wafers. The exposure time of UV radiation is 3.3 sec. Then, they must be developed (30 sec in 452 developer). The result of this step is the formation of exposed regions where the apertures will be created. The membrane is removed from these areas with RIE etching in a plasma of oxygen and freon for 12 min. The wafer is then cleaned
a e b d f SO i 2 Photoresist
Si3N4 ] Etched away Si
Figure 3-3: Micromachining steps
from photoresist and placed in KOH for anisotropic etching of Si. Brian Jacobson built a circuit for monitoring the level of water while the KOH is heated so that the required concentration is kept the same, which is 80% water and 20% KOH by weight [38]. Initially, it is heated for 4.5h at 800 C and then for lh at 600 C. The result of this step is the formation of apertures in Si along the <111 > crystal axis. There is still membrane on the other side of the wafer which was not etched. It can be easily removed with a pointing q-tip. For any residues, the wafer is examined with a microscope. The various steps are shown in Figure 3-3.
The micromachining of the device wafer is not as straightforward as the previously described process. If the micromachining is conducted before the fabrication of the detec-tors, the device wafer must be handled with great care during the whole process due to the fragileness of the membrane [39]. If micromachining is the last step, the detectors must be protected from the KOH. Brian Jacobson performed micromachining at the end [38]. The device wafer is mounted in a specially designed teflon holder. KOH etching takes place on the exposed side of the device wafer while the other side is not facing KOH. This is achieved by the use of rubber o-rings between two teflon pieces and supply of nitrogen gas to assure
that the device wafer is firmly mounted minimizing the possibility of KOH leak. The RIE of the silicon nitride is done just before the micromachining. The drawback of this approach is the development of high temperature which may degrade the quality of the SIS junctions. In order to avoid that, long cooling between short periods of RIE is demanded as well as good thermal conductance between the wafer and the quartz plate of the etcher through which cool water flows. IR alignment is important before RIE in order to mark the areas of the dipoles where the free-standing membrane will appear. Gerhard de Lange performed RIE etching of the device wafers before the fabrication of the detectors. Alignment marks were necessary on the other side of the wafer for the orientation of the fabrication masks. Hypres Inc, our wafer supplier, also conducted micromachining at the end using a teflon mount. Another approach followed by [39], but for a different application, is to deposit
silicon nitride on the side that must be protected and subsequently remove it.
3.1.3 Gold Deposition
The lossy sidewalls of the Si cavity formed by the individual wafers must be coated with gold since the theory developed for these receivers assumes conductive sidewalls. This step takes place at Lincoln Lab (group 86). Prior to the gold deposition, Ti is used (200 A) as a first layer. In that way, Au can easily stick to the surface. A typical thickness is
4000
A.
Gold is evaporated through a shadow mask which was made at Lincoln Lab bylaser cutting technique. Since the wafers must be mounted on a metallic surface which fits in the evaporator, it is very dangerous to break the fragile membranes of the device wafer. Thus, we use a dummy Si wafer where we spin FCS photoresist. During the baking process we stick the device wafer on top with the membranes touching the Si wafer. In that way, the membranes are protected from the rough metallic mounting surface. For the aperture wafers, the above step is not necessary. The shadow mask is aligned by eyeball and then a microscope is used for finer alignment. The result is satisfactory and the diffraction effects are negligible.
3.2 Preparation of the Experimental Set-Up
After the device wafer and the aperture wafers have been fabricated, the mounting process follows resulting in a stack of wafers. This stack must be aligned to the machined section, the magnet, the DC-IF board and then placed in the dewar where all the necessary connections must be completed. The cryogenic unit and its efficient operation are fundamental for the measuring process. All the above issues are discussed and we conclude with the description of a biasing circuit assembled at MIT for the array of detectors.
3.2.1 Mounting Process of the Wafers
An essential part of the mounting process is a x-y-0 stage designed by Gerhard de Lange. By adjusting three different screws, a circular disk of the stage can move in an orthogonal fashion (x-y correction) as well as in a circular fashion (0 correction). A microscope slide is glued on the disk with superglue (krazy glue). The building of the stack follows the order: first backing wafer, second backing wafer, device wafer, last aperture wafer. The
x-y-O stage is placed on a hot plate at approximately 1500 C. Then, the first backing wafer
is placed on the glued slide with the opening cavity angle facing up. Small amount of bee wax is cut. When the stage is hot enough, we place the bee wax pieces with a razor near the four corners of the wafer so that the wax will penetrate below the wafer. For uniformity of bee wax, we may use a pair of q-tips to press the two opposite corners of the wafer. In that way, the little bee wax bumps are avoided. The stage is then removed from the hot plate using a pair of tweezers. Sometimes during this process, bee wax can stay on top of the wafer. In that case, it must be carefully removed with a q-tip immersed in hot TCE.
The second wafer is placed on top of another microscope slide that is heated on the hot plate and the same process of gluing with bee wax is repeated. This wafer must have the the opening cavity angle facing the slide. By eyeball, a first alignment is done after sliding the second wafer over the first wafer (the wafers touch each other). For better alignment, a microscope must be used. The alignment is facilitated by simultaneously examining many antennas. Having achieved a first rough alignment of the backing cavity to the second wafer, we must use the jug that holds the machined section of the array. This jug fits exactly
the x-y-0 stage with properly placed dowel pins. We put a small quantity of superglue on the two sides of the jug, place it carefully on the stage and press it. In that way the microscope slide with the second wafer is glued on the jug. Having now the jug on top of the stage, we can move it for precise alignment. First, the angle 0 is adjusted in such a way that all the backing cavities have the same x and y margin from the apertures of the second wafer. Second, the x and y adjustment is performed. We can do that by concentrating on one element since all the elements of the array will be aligned at the same time.
After we are certain that the alignment is satisfactory, the jug is removed and we put a small quantity of superglue at the corners and the midpoints of the wafer. Then, we press the jug against the stage and keep it firm for a minute. In the meanwhile, it is a good practice to look at the profile of the first stack to inspect any possible airgaps. If they exist, we press also the slide at the points of airgaps. That's why it is important to have uniformity of bee wax. The amount of superglue must not be excessive because it will spread all over the cavities. I found this step of alignment not very easy since the area of the first cavity is very small. The dowel pins have some degrees of freedom so a relative x-y movement is possible that may destroy the alignment. An approach I was usually following was to press the jug in one direction, x or y. During the gluing process, I kept pressing in the same direction. Unfortunately, it didn't work all the times and misalignments could not be corrected because the wafers were firmly glued together. For extreme misalignments, the first stack must be immersed in aceton and dissolved. Sometimes, this can take a few hours and other times a couple of days.
Having glued the two wafers, the x-y- stage along with the jug is placed on the hot plate. When the temperature is high enough, we carefully remove the jug. Two things may happen: the stack remains on either the stage or the jug. In either case, we put it again on the hot plate and when it is hot enough, we slide the stack with a q-tip away from the microscope slide. It is important to keep in mind that superglue cannot withstand high temperature for a long time and it starts melting. This problem occured many times in the past and the alignment of the wafers had to be redone. If the procedure is succesful, we immerse the stack in hot TCE (1000 C) for 5-10 sec to remove the bee wax.
is formed. When we place the device wafer, careful gluing is needed. In case the device wafer is not glued well on top of the stack of the backing wafers, pulling the jug out may destroy many membranes which were glued. So, we must make sure that the stack is firm and the wax has completely melted. Extra care of the device wafer is needed also during the x-y--0 alignment because the fragile membranes touch directly the stack of wafers. A good habit is to lift the jug slightly during the alignment process avoiding any friction on the membranes.
Once the stack of wafers is formed, it must be aligned with the machined section. The same process is followed with the only difference that the machined section is now screwed on the window of the jug and when we place the stage and the jug on the hot plate, the stack is detached from the jug where the bee wax exists.
It is essential to have a firm stack because during the four times that we use the hot plate a weak superglue layer between two wafers may loosen up.
3.2.2 Preparation of the Experimental Set-Up on the Cold Plate of the
Dewar
The stack of wafers is formed in such a way that the antenna pads are now exposed via apertures of the first backing wafer. Access to these pads is achieved with miniature bellows. During the whole process we may touch the antenna pads, so it is advised to wear an electrostatic discharge wrist to avoid destroying SIS junctions. The miniature bellows are placed in the apertures of the pads in such a way that the holes of the bellows are facing upwards. Then, the magnet is mounted. Holes in the magnet have been drilled so that the DC-IF board can have access to the bellows. This is done using microscrews and coaxial cables for the two antenna pads. The microscrews are screwed in the copper body of the magnet which is grounded while the coaxial cables stay firm with crystal bond. For the 9 antennas we have 18 pads. It is desirable to establish contact between the microscrews and all the antennas. Since the miniature bellows are not fixed in the apertures, it is not easy to have contact with all the antennas. The only possible view for finer orientation of the magnet is the side view which gives a 2D picture of the microscrews. Trying to access
many antenna pads, I destroyed a number of miniature bellows. Given the high cost of the bellows, it is preferred to have a moderate number of antennas with easy access. A better choice will be the permanent fixing of the bellows on the microscrews of the magnet. But even in this case, extra care is needed because excessive pressure on the miniature bellows can destroy their elasticity which is very important, especially when they are operated at low temperatures.
Gerhard de Lange had experimented for a long time with a number of contacts. Pins glued with silver epoxy was one of them. The pins alone were not an ideal solution because a good contact at room temperature was not preserved at 4.2 K. Apparently, the pins lose their elasticity. Then, epoxy was used at the apertures of the pads. Although the contact was better in this case, the wafer could not be easily reused because of the properties of epoxy. For its removal, Ecostrip is used. Unfortunately, the dissolved epoxy spreads all over the wafer shorting conductive areas. In addition, epoxy may press the wafers in such a way that cracks can occur. The idea of miniature bellows that Gert de Lange came up with was a clean and reliable solution.
The magnet fits to another copper frame which is screwed on the jug. In the past, it was noted that excessive pressure of the stack of wafers can result in cracking the stack. For this reason, a protective U-shaped copper frame is placed between the machined section and the magnet. Thus, the pressure is exerted on the machined section and the stack of wafers suffers only from the pressure of the microscrews of the magnet whose lengths can be adjusted. Sometimes, it was necessary to screw them further for better contact while the magnet frame was firm.
On top, the DC-IF board is mounted. It is essential that the microscrews are clean from crystal bond so that the electrical contact is established. The DC-IF board has proper connections for the IF signal and the bias of the SIS devices. On one of the corners of the jug, the temperature sensor is placed giving a representative temperature of the actual SIS device. For good thermal contact, indium foils are stacked between the temperature sensor and the jug. In addition, indium foils are used also at the bottom of the jug that touches the cold plate of the dewar. A metallic strip connecting the jug to the cold plate is also used for better thermal contact. Here, it is worth noting that the actual temperature of the junction