HAL Id: inserm-00144609
https://www.hal.inserm.fr/inserm-00144609
Submitted on 4 May 2007
HAL is a multi-disciplinary open access archive for the deposit and dissemination of sci-entific research documents, whether they are pub-lished or not. The documents may come from teaching and research institutions in France or
L’archive ouverte pluridisciplinaire HAL, est destinée au dépôt et à la diffusion de documents scientifiques de niveau recherche, publiés ou non, émanant des établissements d’enseignement et de recherche français ou étrangers, des laboratoires
Measuring cell viscoelastic properties using a
force-spectrometer: influence of protein-cytoplasm
interactions.
Elisabetta Canetta, Alain Duperray, Anne Leyrat, Claude Verdier
To cite this version:
Elisabetta Canetta, Alain Duperray, Anne Leyrat, Claude Verdier. Measuring cell viscoelastic proper-ties using a force-spectrometer: influence of protein-cytoplasm interactions.. Biorheology, IOS Press, 2005, 42 (5), pp.321-33. �inserm-00144609�
Full length article
Measuring cell viscoelastic properties using a force-spectrometer:
Influence of protein-cytoplasm interactions
Elisabetta Canettaa, Alain Duperrayb, Anne Leyrata and Claude Verdiera,* a
Laboratoire de Spectrométrie Physique – UMR 5588 (Université Grenoble I and CNRS)
b
INSERM U578 (Université Grenoble I), Groupe de Recherche sur le Cancer du Poumon, Institut Albert Bonniot
Keywords: Cell stretching - AFM - microrheology - Adhesion - ICAM-1
* Address for correspondence : Claude Verdier, Laboratoire de Spectrométrie Physique (UMR5588), BP 87, 140 rue de la Physique, 38402 Saint Martin d’Hères, France. Tel.: +33 4 76 63 59 80; Fax.: +33 4 76 63 54 95;E-mail: verdier@ujf-grenoble.fr
HAL author manuscript inserm-00144609, version 1
HAL author manuscript
Abstract
Cell adhesive and rheological properties play a very important role in cell transmigration through the endothelial barrier, in particular in the case of inflammation (leukocytes) or cancer metastasis (cancer cells). In order to characterize cell viscoelastic properties, we have designed a force spectrometer (AFM) which can stretch cells thereby allowing measurement of their rheological properties. This custom-made force spectrometer allows two different visualizations, one lateral and one from below. It allows investigation of the effects of rheology involved during cell stretching.
To test the ability of our system to characterize such viscoelastic properties, ICAM-1 transfected CHO cells were analyzed. Two forms of ICAM-1 were tested; wild type ICAM-1, which can interact with the cytoskeleton, and a mutant form which lacks the cytoplasmic domain, and is unable to associate with the cytoskeleton. Stretching experiments carried out on these cells show the formation of long filaments. Using a previous model of filament elongation, we could determine the viscoelastic properties of a single cell. As expected, different viscoelastic components were found between the wild type and the mutant, which reveal that the presence of interactions between ICAM-1 and the cytoskeleton increases the stiffness of the cell.
1. Introduction
For many years, scientists have been trying to characterize, understand and model the biomechanical and biochemical properties of cells and tissues [18] either in physiological or pathological conditions. Approaches are usually experimental, but study of the mechanical/physical properties of cells also call for theoretical approaches [13,14,15,40] in order to extract bulk and surface properties. Measurements depend upon the bio-physico-chemical environment provided, and on cell type. Consequently, values found in the literature for cell mechanical properties fall into a very broad range.
Cells are sensitive to applied forces, a phenomenon known as mechano-transduction [24,25]. The mechanotransducing machinery is not fully understood, but the involvement of cell adhesion molecules (CAMs) is essential [7]. CAMs are transmembrane proteins, connected to the cytoskeleton through linker proteins. These complexes are part of the mechanotransduction machinery, critical for the control of cell shape, migration and differentiation.
Nowadays, many systems exist to measure the rheological properties of individual cells, the most common ones are micropipettes [12,16,23], optical tweezers [1,21,35], AFM [2,3], microplates [38] or cell poking [11,19]. These techniques need to be coupled to an adequate rheological model. For instance, a compression and stretching experiment [38] provides information about the viscoelastic parameters as long as a proper model is used. Similar techniques also allow access to surface or adhesion properties [23].
AFM is probably the most versatile instrument for the determination of mechanical properties in a large force range [10pN-1µΝ]. It has been used for the determination of molecule-molecule or receptor-ligand interactions [6,22,29,37,42,43]. It is also well adapted for measuring cell elastic [2,9] or viscoelastic properties [30], but it only provides a view from below, when coupled with an inverted microscope.
The aim of our study is to measure the rheological properties of individual cells. We have designed a custom-made AFM apparatus, set on an inverted microscope [4]. A functionalized bead is glued onto the AFM cantilever. Consequently, the cell-bead contact area is located on the bead surface. An additional side view is possible through a lateral lens. Adherent cells can be stretched, while monitoring cell-bead contact area and cell shapes, in particular filament stretching can be measured. This apparatus is described in section 2. Stretching experiments give rise to large cell deformations which can be analyzed using a recent model developed for viscoelastic material stretching [41]. Similar stretched cell filaments have been observed recently using micropipettes, and modeled with a Johnson-Kendall-Roberts model [8]. The method of large deformation is justified by the fact that only protein-cytoplasm interactions are present in the long filament that is being formed. On the contrary, during indentation experiments, the nucleus might play a role, as observed previously [32].
In order to test the ability of the measurements to discriminate different cells, we used recombinant Chinese Hamster Ovary (CHO) cells transfected with the InterCellular Adhesion Molecule-1 (ICAM-1). ICAM-1 is a transmembrane cell adhesion protein [36] involved in diapedesis (i.e. adhesion and transmigration of leukocytes across the endothelium) [10,26,39]. The cytoplasmic domain of ICAM-1 is known to associate with the actin filaments [5,20]. Cell-endothelial interactions and diapedesis are also involved in cancer cell dissemination during the metastatic process [33]. Particular rheological properties are necessary in these processes, which imply large cell deformations.
In the present study, we used stable CHO cell lines expressing either the complete ICAM-1 sequence (Ca1-6) or the ICAM-1 molecule without its cytoplasmic domain (∆-Cyto), which cannot bind to the cytoskeleton [34]. The results presented in section 3 show that CHO Ca1-6 cells exhibit a higher stiffness compared to CHO ∆-Cyto cells. This was expected since CAM-membrane-cytoskeleton assembly is stronger in cells expressing wild type ICAM-1 compared to the mutant one.
2. Materials and methods 2.1. AFM spectrometer
We developed a stretching test for investigating the mechanical response of a cell grown on a glass substrate. A functionalized polystyrene microsphere (15 µm-diameter, Polyscience, Germany) glued onto an AFM cantilever, is put in contact with the cell. The diameter of the microsphere is large compared to the usual AFM probes in order to allow investigation of a large cell area.
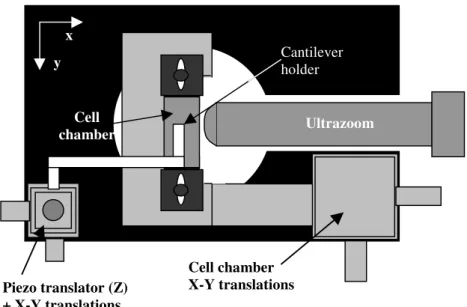
To localize and visualize the cell, the experiments were performed on an inverted microscope (Axiovert 200, Zeiss, Germany) equipped with a custom-built AFM force spectrometer. The adhering cells were visualized by means of the microscope (63X objective) and a lateral visualization was provided through an ultrazoom (Optophotonics, France), consisting of a high magnification zoom lens (Plan Apo 50X objective), connected to a CCD camera. A specially-designed microscope plateau was built, in order to bring the side view lens (Figure 1). Light was brought to the system using optical fibers. Cells were grown in rectangular cell chambers (5mm x 60mm x 23mm) with a thin glass wall allowing for lateral visualization of the cell-microsphere zone. The vertical position of the AFM cantilever relative to the cell was set with a capacitive sensor (Piezosystem Jena, Germany). A schematic picture is presented in Figure 1 and the full experiment is shown in Figure 2. The advantage of this method is that observations from both the side and below are possible.
Microspheres were attached to tipless Si3N4 AFM cantilevers (nominal stiffness 0.06N/m, length 200 µm, Veeco Instruments, France). Attachment was achieved by means of a water-resistant two-part epoxy adhesive.
Calibration of the system was performed using the method shown in Figure 3. The microsphere and cantilever were put into contact with the water surface. The microsphere was pulled up and the angle (θ) of the air-water interface with the vertical direction was measured.
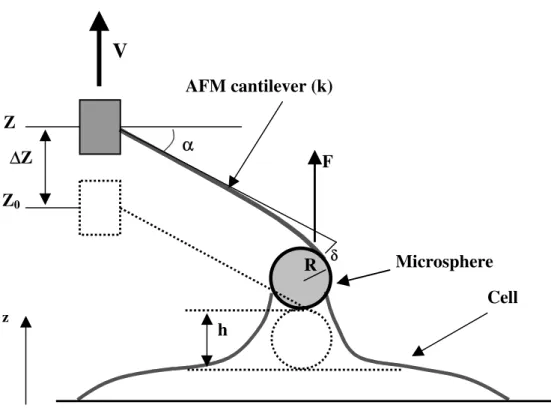
The vertical component of the force exerted by water on the bead is F = 2πaσcosθ, where a is the bead radius (7.5 µm), and σ the water surface tension (σ =72 mJ/m2). The component of this force in the direction normal to the cantilever (F cosα, where α is the angle between the cantilever and the horizontal direction) produces the deflection of the cantilever. Therefore, F cosα = k δ, where k is the bead-cantilever spring constant, and δ the tip deflection. The deflection can be measured using either a laser beam (through the condenser) reflected by the cantilever onto a photodiode (Figure 2), or using measurements from digitized lateral photographs. Measurements were made using a previously described method [9]. This is depicted in Figure 4: h is the measured resulting deflection, ∆Z=Z-Z0 is the piezo-translator displacement, leading to δ = (∆Z–h) cosα. h can be obtained by measuring the difference between two positions corresponding to a fixed point, such as the lower position of the bead. From the measurements of θ at the air-water interface, and the determination of δ, the spring stiffness k is calculated (contribution of the angle α disappears). It is found close to the nominal value 0.06 N/m (to +/- 10%).
During the stretching experiment, the vertical component F of the force exerted by the microsphere onto the cell was determined from the deflection of the AFM cantilever measured on the images obtained from the lateral view. The scale on the photographs was obtained from the knowledge of the bead size, measured separately. The value of F is simply given by:
F = k ( ∆Z – h) (1)
In the experiments, α=15°, corresponding to a good compromise between available space, proper beam ray reflection at the fluid-interface and measurements accuracy on digitized images.
A stretching test was performed as in previous studies [2,8], at a constant velocity V=1 µm/s.
2.2. Materials
2.2.1. Cell culture
Chinese Hamster Ovary (CHO) cells were cultured in Dulbecco’s modified Eagle’s medium (DMEM) supplemented with 10% FBS, 100U/ml penicillin, 100µg/ml streptomycin, 2mM L-glutamine and non-essential amino acids (BioWhittaker), at 37°C, 5% CO2. Two types of recombinant CHO cell lines were used [34] : CHO Ca1-6, expressing the unmodified form of human ICAM-1, and CHO ∆-Cyto expressing a mutant form of ICAM-1 without its cytoplasmic domain which cannot be anchored to the cytoskeleton (Figure 5). Cells were grown in cell chambers precoated with fibronectin (20µg/ml) at low cell density, in the presence of 20 mM Hepes buffer (pH 7.4). The chamber was then set onto the microscope and experiments were conducted within the next two hours.
2.2.2. Microsphere functionalization
The polystyrene microsphere used with the cantilever was functionalized by passive adsorption at room temperature for 45 min with ICAM-1 antibody 3D6 [10] at 100µg/ml, and used immediately after three washes in PBS.
Using FITC labeled 3D6, it can be shown that the number of adsorbed antibodies on the bead is around 26,000 per µm2 (data not shown).
2.2.3. Confocal microscopy
To visualize the effect of the contact between the functionalized bead and the cell surface on ICAM-1 distribution, we examined the cells by confocal microscopy. Cells were prepared exactly as for the AFM test, except that after 30 min incubation with the functionalized microsphere, cells were fixed with 2% paraformaldehyde, permeabilized with 0.5% Triton X-100, and stained with anti ICAM-1 3D6 (5µg/ml), followed by Goat anti Mouse from Jackson ImmunoResearch Laboratories. Images were acquired using a Zeiss confocal
microscope. Figure 6 shows a side view of the cells, where the staining for ICAM-1 is on the cell surface, with an increased staining at the interface between the cell and the functionalized bead. Quantification of this staining demonstrated that the clustering of ICAM-1 molecules induced by the functionalized bead was very similar for both cell types (average fluorescence intensity 215 ± 33 for CHO Ca1-6 vs 180 ± 25 for CHO ∆-Cyto). In contrast, mean fluorescence intensity was 108 ± 34 in other parts of the membrane outside the contact area for both cell types. Note that the contact area is not necessarily identical for both cell types. The ability of the functionalized bead to bind specifically to ICAM-1 receptors was demonstrated, by performing the same test without ICAM-1 antibodies: no interactions with the cell were found (data not shown).
2.3. Stretching experiments 2.3.1. Setup
Experiments were carried out at room temperature. The cantilever was placed in culture medium containing CHO cells adhering on the bottom of the cell chamber. Cells were visualized simultaneously using the microscope and the side view. At the onset of force measurement, the microsphere was positioned directly above an isolated cell. Since the nucleus is the most prominent cell element, it was possible to observe it laterally.
The microsphere was then lowered onto the cell surface until contact was made between the cell and the microsphere, as seen in the side view. The cell was then indented by the microsphere to a depth of 5 µm (in increments of 0.5 µm with 2 mn for relaxation) and then allowed to relax for 10 min. This method allows the formation of solid bonds between ICAM-1 molecules expressed at the cell surface and ICAM-ICAM-1 antibodies. Under these conditions, a sufficient adhesion zone was obtained. The microsphere was then pulled away vertically at a constant rate V= 1µm/sec and cell deformation followed using the lateral view. Figures 7a-f
show a sequence of lateral images during stretching in the vicinity of the cell nucleus, for a CHO Ca1-6 cell. The formation of a long thin filament is observed.
Stretching experiments were carried out for both cell types, and the deflection of the cantilever was recorded using video analysis in all cases as described previously by Dimitriadis et al [9]. This method was preferred rather than using the laser method, because the light used for the side-view renders the use of the laser difficult. These results will be discussed in section 3.
2.3.2 Modeling cell rheological properties
In order to analyze the data, we developed a model based on previous work [41], related to an experiment (at constant velocity V) for measuring tackiness of a viscoelastic adhesive, exhibiting long filaments. Such long filaments were similar to the one observed in Figure 7. The deformation first corresponds to shear motion at short times, followed by the formation and the elongation of a filament. The latter consists of the membrane, proteins and possibly parts of the underlying cytoskeleton. Modeling such a deformation can be based on the following assumptions:
- most of the force is spent in stretching the filament
- prediction of cell rheology is based on elongational deformation - the filament has a homogeneous cross-section
- the initial filament cross-section is A0, and the initial thickness is e - the cell is a viscoelastic material following the Oldroyd-B model [27] :
du
)
(
)
)
exp((
)
(
t
p
G
u
t
t 1u
t − ∞ −∫
∑
=
−
I
+
−
/
λ
C
(2)where ΣΣ(t), Ct-1(u), I are respectively the Cauchy stress tensor, the inverse of the right Cauchy-Green strain tensor, the identity tensors, p is the pressure, G is the shear modulus, and λ the relaxation time.
The parameter e is not a measurable quantity, since it is the equivalent thickness corresponding to the volume of the stretched part of the filament only. It is determined as explained below, usually it is of the order of a few microns (e≈1-3µm, for a stretched filament of length 40 µm, in our experiments). The initial cross-section, A0, on the other hand, can be measured as the initial contact area.
Under these assumptions, explicit formulas can be obtained [41]. In addition, this model is a three-dimensional one. Indeed, as the cell filament is stretched, it also shrinks. Other studies exist [38] but assume one-dimensional modeling. Filament elongation is based on the Hencky
strain ε=Ln(1+Vt/e), and the stretching rate is given by
•
0 =V/(e+Vt). Assuming that the initial cross-section (A0) of the filament of a given height (e) is stretched uniformly, mass conservation gives the filament cross section A(t) at any time (t):
A(t)(e+Vt)=A0e (3)
Stresses are both in the axial direction (z) and other directions as well (x and y). The stress tensor acting within the filament, is given [27] by eliminating the pressure field and calculating σ(t)= σzz-σxx, the stress difference. Using an Oldroyd-B model, with one relaxation mode, the stress σ(t), measured by the cantilever, becomes [41]:
σ(t) = + + − + + + + − + −
∫
− − − du Vt e Vu e Vu e Vt e e 1 ) Vt/e) (1 Vt/e) ((1 e G 2 t 0 u)/ (t 1 2 t/ (4)For incompressible materials, E=3G, where E is the Young modulus. Finally the force is obtained through:
F(t) = σ(t) A(t) = σ(t) A0 e/(e+Vt) (5) Examples of such predictions, for different parameters, are given in Figures 8a-c. A0, e, and V are kept constant for each cell. Modeling the different behaviors of the viscoelastic system is possible. The parameters that vary are the viscoelastic ones G and λ (two equivalent parameters are G and the viscosity η=G λ). In the first case (Figure 8a), the response is that of
an elastic material because the experimental time texp is small compared to λ (texp < λ). In Figure 8b, the behavior corresponds to a viscoelastic material (texp≈λ), and the last case (Figure 8c) is that of a viscous material (texp > λ). The shape of the curve is governed by the relaxation time λ whereas the height of the peak force is controlled by G. Therefore, this model can be used to analyse different cell viscoelastic properties. Monitoring the shape of the curve can be done using the relaxation time λ, while the height of the curve is changed by adjusting the shear modulus G.
3. Results and discussion
Different cells were tested and analyzed: CHO ∆-Cyto and CHO Ca1-6 cells. Force signals were obtained from the digitized video images using an image analysis software (ImageJ1), with the procedure explained in section 2.1. This gives force accuracy of around +/- 30 nN corresponding to pixel accuracy, which is sufficient in our case. For smaller signals required for measurements of molecule-molecule interactions, the laser system for force detection should be used.
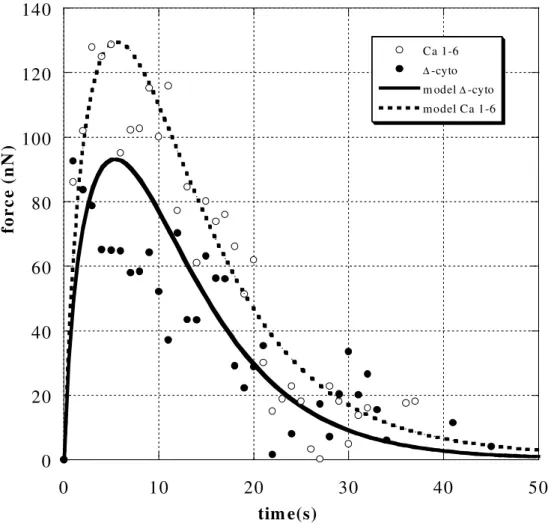
Figure 9 depicts the average force signals F(t) for the two cell types. They correspond to a cell viscoelastic response, with a rapid increase of force due to elasticity and a later decrease due to viscous effects. Force signals exhibit a maximum, corresponding to the case previously described in Figure 8c, and have been already observed experimentally [2,38]. Therefore, the CAM-membrane-cytoskeleton assembly behaves more like a viscous system, with some elasticity at short times.
The question of initial indentation can be questioned, although it has not been investigated further in the present study. Its influence has been reduced here because of the time allowed
1
Rasband, W.S., ImageJ, National Institutes of Health, Bethesda, Maryland, USA, http://rsb.info.nih.gov/ij/, 1997-2004.
for the cell to relax (2 mn after each 0.5 µm step indent, and finally 10 mn). In fact, indentation is used to induce bond creation.
To investigate these results further, the stress-strain curves corresponding to a velocity V=1µm/s were plotted (data not shown). The behavior is similar to the force-time curve, corresponding to a linear elastic behavior until ε≈1.2, followed by a maximum, then a rapid decrease. This gives more information about the intrinsic behavior of the cytoskeleton: it behaves in an elastic manner at small deformations, with no strain hardening, then it is governed by relaxation at larger deformations. Strain hardening may occur at larger velocities [41], but is not observed here. Further experiments at differents velocities V are possible (0.2µm/s<V<5µm/s) with the present setup; they may help understanding the cell rheological response (as shown in the model, equations 4-5), in relation to the cytoskeleton remodeling. Indeed, the local properties of the membrane-cytoskeleton-proteins assembly are investigated here. During the long-term stretching, some remodeling may exist, in particular progressive breakeage (or damage) of the various cytoskeleton filaments. It was not possible to study such features using the side view. Further experiments using immunofluorescent cytoskeleton proteins and confocal microscopy would be required to resolve this question.
Differences between the two cell types could also be captured. In Figure 9, CHO Ca1-6 cells exhibit a higher force peak, corresponding to increased stiffness (small times). This difference makes sense since it corresponds to a stronger assembly of membrane and proteins with the cytoskeleton. In order to determine the modulus G and viscosity η, we correlated our experimental data with model equations (4-5). At the beginning of the experiment, the microsphere is closely linked to the cell surface. The diameter of the contact area (2a0) is usually smaller than the bead diameter (see for example Figure 7a), in the range [12-15 µm] in all cases. The values of e are not physical, because the cell filament has no height at the outset. After several seconds, the cell is stretched, thus additional material comes from the inside of the cell (below). We chose to measure the cell area change A(10)/A =(1+Vt/e)-1 after
10 seconds, which gives us the values of e.A(10) is the measured minimum cross section of the filament at t=10s. Finally, the unknown parameters G and λ were optimized. The best fits are shown in Figure 9, and results are presented in Table 1.
The shear moduli are found to be G = 675±100 Pa and λ=5 ±1s for CHO Ca 1-6 cells, and G=250±50 Pa and λ=6 ±1s for CHO ∆-cyto cells.
According to previous studies [31,32], indentation experiments with an AFM have been carried out in the case of endothelial cells, and give elastic moduli E in the range of a few kPa, depending on the position of the probe with respect to the nucleus. In our experiments, the part of the cell being tested consists mainly of the membrane and proteins (attached to the cytoskeleton or not) located on top of the nucleus. Our measurements give G=E/3 in the range 600-700 Pa (CHO Ca1-6), so that E=1.8-2.1 kPa, and E=0.9-1.2 kPa for the second cell type (CHO ∆-cyto). These comparisons still need to be considered with caution, because it is likely that the nucleus plays a role during indentation. Indeed, as the probe indents the cell, the response is dependent on probe position [31,32].
On the contrary, during stretching, most of the response probably depends on the microstructure of the filament but not on the nucleus. Nevertheless, the results are in qualitative agreement with the litterature. In addition, the stretching experiment seems to be more closely related to diapedesis, during which a cell first forms a protrusion and then extends it [26].
In another study using magnetocytometry and RGD-coated beads [17] two different values of G for cortical and cytosolic cytoskeleton nerworks [28] were found (range 49-85 Pa and 74-159 Pa respectively), whereas relaxation times for the same assemblies were respectively 0.3-0.7 s and 14-30 s (corresponding to stresses in the range 10-30 Pa). This might give an indication that the filament that we observed for ∆-cyto CHO cells behaves more like the cytosolic cytoskeleton of the previous study [28], although the observed stress levels are
higher (1-3 kPa) due to the large deformations involved. In the case of Ca1-6 CHO cells, the elastic modulus G is higher by a factor of 2.5, revealing a stronger assembly stiffness.
The effect of the relaxation time is more complex, as the values are quite close for the two cell types (5s and 6s), with a slightly smaller relaxation time for the Ca1-6 type. This similarity suggests that both cell types behave similarly, from a viscoelastic point of view, and that only stiffnesses can be affected by reorganization at the cell membrane. Values of the relaxation times fall within the range of previously published data [28], and might be considered to be an average over the different components of the underlying cytoskeleton. However, this type of method for the determination of elastic modulus and relaxation time is new, and could be used further to differentiate other cell types. Several relaxational processes might also be included in the model.
We conclude that the overall behavior of the two cell types is similar, with the exception of the elastic modulus which is two fold higher when ICAM-1 is linked to the cytoskeleton. Similar results have been obtained in a study combining AFM and cell poking [19] of embryonic cells, where cells lacking vinculin exhibited reduced elasticity.
To summarize, we have designed a new method for characterizing cell stretching using a custom-made AFM. This technique, which allows two kinds of visualization, is quite convenient. It can be coupled to a 3D-model for viscoelastic cell stretching. It enables determination of an elastic modulus and a relaxation time. The method has been tested on recombinant CHO-cells expressing ICAM-1, with or without their cytoplasmic domains. It is efficient in measuring small changes in the viscoelastic parameters of these two cell types.
Acknowledgements
This work has been supported partly by the RTN project funded by the EU, Contract N° CT-2000-00105.
REFERENCES
[1] A. Ashkin and J.M. Dziedzic, Internal cell manipulation using infrared laser traps, Proc. Natl Acad. Sci. USA 86 (1989), 7914-7918.
[2] M. Benoit, D. Gabriel, G. Gerisch and H.E. Gaub, Discrete interactions in cell adhesion measured by single-molecule force spectroscopy, Nature Cell Biol. 2 (2000), 313-317.
[3] G. Binnig, C.F. Quate and C. Gerber, Atomic Force Microscope, Phys. Rev. Letters 56 (1986), 930-933. [4] E. Canetta, A. Leyrat and C. Verdier, A physical model for studying adhesion between a living cell and a spherical functionalized substrate, Math. Comp. Modelling 37 (2003), 1121-1129.
[5] O. Carpen, P. Pallai, D.E. Staunton and T.A. Springer, Association of intercellular adhesion molecule-1 (ICAM-1) with actin- containing cytoskeleton and alpha-actinin, J. Cell Biol. 118 (1992), 1223-1234.
[6] A. Chen and V.T. Moy, Cross-linking of cell surface receptors enhances cooperativity of molecular adhesion,
Biophys. J. 78 (2000), 2814-2820.
[7] C.S. Chen, J. Tan and J. Tien, Mechanotransduction at Cell-Matrix and Cell-Cell Contacts, Annual Rev.
Biomed. Eng. 6 (2004), 275-302.
[8] Y.S. Chu, S. Dufour, J.P. Thiery, E. Perez and F. Pincet, Johnson-Kendall-Roberts theory applied to living cells, Phys. Rev. Letters 94 (2005), 028102.
[9] E.K. Dimitriadis, E. Horkay, J. Maresca, B. Kachar and R.S. Chadwick, Determination of elastic moduli of thin layers of soft material using the atomic force microscope, Biophys. J. 82 (2002), 2798-2810.
[10] A. Duperray, L.R. Languino, J. Plescia, A. McDowall, N. Hogg, A.G. Craig, A.R. Berendt and D.C. Altieri, Molecular identification of a novel fibrinogen binding site on the first domain of ICAM-1 regulating leukocyte-endothelium bridging, J. Biol. Chem. 72 (1997), 435-441.
[11] M. Duszyk, B. Schwab III, G.I. Zahalak, H. Qian and E.L. Elson, Cell poking: quantitative analysis of indentation of thick viscoelastic layers, Biophys. J. 55 (1989), 683-690.
[12] E. Evans, New membrane concept applied to the analysis of fluid shear-and micropipette-deformed red blood cells, Biophys. J. 13 (1973), 941-954.
[13] E. Evans, Probing the relation between force lifetime and chemistry in single molecular bonds, Annual Rev.
Biophys. Biomol. Struct. 30 (2001), 105-128.
[14] E. Evans and K. Ritchie, Dynamic strength of molecular adhesion bonds, Biophys. J. 72 (1997), 1541-1555. [15] E. Evans and K. Ritchie, Strength of a weak bond connecting flexible polymer chains, Biophys. J. 76 (1999), 2439-2447.
[16] E. Evans and A. Yeung, Apparent viscosity and cortical tension of blood granulocytes determined by micropipette aspiration, Biophys. J. 56 (1989),151-160.
[17] R. Fodil, V. M. Laurent, E. Planus and D. Isabey, Characterization of cytoskeleton mechanical properties and 3D-actin structure in twisted adherent epithelial cells, Biorheology 40 (2003), 241–245.
[18] Y.C. Fung, Biomechanics. Mechanical properties of living tissues, 2nd edn, Springer-Verlag, 1993.
[19] W.H. Goldmann, R. Galneder, M. Ludwig, A. Kromm and R.M. Ezzell, Differences in F9 and 5.51 cell elasticity determined by cell poking and atomic force microscopy, FEBS Letters 424 (1998), 139-142.
[20] L. Heiska, K. Alfthan, M. Gronholm, P. Vilja, A. Vaheri and O. Carpen, Association of ezrin with intercellular adhesion molecule-1 and -2 (ICAM-1 and ICAM-2). Regulation by phosphatidylinositol 4, 5-bisphosphate, J. Biol. Chem. 273 (1998), 21893-21900.
[21] S. Hénon, G. Lenormand, A. Richter and F. Gallet, A new determination of the shear modulus of the human erythrocyte membrane using optical tweezers, Biophys. J. 76 (1999), 1145-1151.
[22] P. Hinterdorfer, W. Baumgartner, H.J. Gruber and K. Schilcher, Detection and localization of individual antibody-antigen recognition events by atomic force microscopy, Proc. Natl Acad. Sci. USA 93 (1996), 3477-3481.
[23] R.M. Hochmuth, and W.D. Marcus, Membrane tethers formed from blood cells with available area and determination of their adhesion energy, Biophys. J. 82 (2002), 2964-2969.
[24] D.E. Ingber, Tensegrity I. Cell structure and hierarchical systems biology, J. Cell Science 116 (2003), 1157-1173.
[25] D.E. Ingber, Tensegrity II. How structural networks influence cellular information processing networks, J.
Cell Science 116 (2003), 1397-1408.
[26] C. Johnson-Leger, M. Aurrand-Lions and B.A. Imhof, The parting of the endothelium: miracle, or simply a junctional affair ? J. Cell Science 113 (2000), 921-933.
[27] R.G. Larson, Constitutive equations for polymer melts and solutions, Butterworths, 1988.
[28] V. M. Laurent, E. Planus, R. Fodil and D. Isabey, Mechanical assessment by magnetocytometry of the cytosolic and cortical cytoskeletal compartments in adherent epithelial cells, Biorheology 40 (2003), 235–240. [29] F. Li, S.D. Redick, H.P. Erickson and V.T. Moy, Force measurements of the α5β1 integrin-fibronectin interaction, Biophys. J. 84 (2003), 1252-1262.
[30] R.E. Mahaffy, C.K. Shih, F.C. Mackintosh and J. Käs, Scanning probe-based frequency-dependent microrheology of polymer gels and biological cells, Phys. Rev. Letters 85 (2000), 880-883.
[31] A.B. Mathur, A.M. Collinsworth, W.M. Reichert, W.E. Kraus and G.A. Truskey, Endothelial, cardiac muscle and skeletal muscle exhibit different viscous and elastic properties as determined by AFM, J.
Biomechanics 34 (2001), 1545-1553.
[32] A.B. Mathur, G.A. Truskey and W.M. Reichert, Atomic force and total internal reflection fluorescence microscopy for the study of force transmission in endothelial cells, Biophys. J. 78 (2000), 1725-1735.
[33] I. Saiki, Cell adhesion molecules and cancer metastasis. Japan. J. Pharmacol. 75 (1997), 215-242.
[34] E. Sans, E. Delachanal and A. Duperray, Analysis of the roles of ICAM-1 in neutrophil transmigration using a reconstituted mammalian cell expression model: implication of ICAM-1 cytoplasmic domain and rho-dependent signaling pathway, J. Immunol. 166 (2001), 544-551.
[35] M. Sheetz, Laser tweezers in cell biology, vol.55: Methods in cell biology, Academic Press, 1997. [36] T.A. Springer, Adhesion receptors of the immune system, Nature 346 (1990), 425-434.
[37] T. Strunz, K. Oroszlan, R. Schäfer and H.J. Güntherodt, Dynamic force spectroscopy of single DNA molecules, Proc. Natl Acad. Sci. USA 96 (1999), 11277-11282.
[38] O. Thoumine and A. Ott, Time scale dependent viscoelastic and contractile regimes in fibroblasts probed by microplate manipulation, J. Cell Science 110 (1997), 2109-2116.
[39] Y. Van Kooyk and C.G. Figdor, Avidity regulation of integrins : the driving force in leukocyte adhesion,
Current Op. Cell Biol. 12 (2000), 542-547.
[40] C. Verdier, Review: Rheological properties of living materials. From cells to tissues, J. Theor. Medicine 5 (2003), 67-91.
[41] C. Verdier and J.M. Piau, The effect of the nonlinear viscoelastic properties on tack, J. Polym. Sci. Part B:
[42] E.P. Wojcikiewicz, X. Zhang, A. Chen and V.T. Moy, Contributions of molecular binding events and cellular compliance to the modulation of leukocyte adhesion, J. Cell Science 116 (2003), 2531-2539.
[43] X. Zhang and V.T. Moy, Cooperative adhesion of ligand-receptor bonds, Biophys. Chem. 104 (2003), 271-278.
FIGURE CAPTIONS
FIGURE 1. Schematic illustration of the visualization system. Usual view from below (phase
contrast, fluorescence) and side view using an ultrazoom (camera + prolongator + objective X50).
FIGURE 2. Experimental setup. 1) Specially designed inverted microscope plateau. 2)
Two-axes culture chamber translator 3) Ultrazoom 4) X-Y-Z AFM cantilever translator with piezo translator (Z direction) 5) Cell chamber 6) Photo-diode 7) Laser beam 8) Microscope condenser.
FIGURE 3. Measurement of the Cantilever stiffness using water. Measurement of the contact
angle gives access to the force, since the water surface tension is known (γ=72 mJ/m2 ).
FIGURE 4. Sketch of the AFM technique showing the relevant parameters.
FIGURE 5. Differences in attachment of ICAM-1 to the cytoskeleton. Anti-ICAM-1 are
shown on the bead side. CHO Ca1-6: ICAM-1 is attached to cytoskeleton (inside the cell). CHO ∆-Cyto: ICAM-1 cannot bind to the cytoskeleton.
FIGURE 6. Z slices of a CHO Ca1-6 cell (left) and a CHO ∆-Cyto (right) stained with
ICAM-1 antibodies, with a functionalized bead (dotted circle) on top of the cell. After incubation for 30 min at room temperature, cells were processed for confocal microscopy as described in Materials and Methods. ICAM-1 level is increased at the interface between the cell and the functionalized bead. Bar = 10 µm.
FIGURE 7. Typical stretching experiments (CHO Ca1-6). Side view with reflexion below.
The bead first indents the cells, then it is pulled upwards at a constant velocity V=1 µm/s. Evidence of the formation of a filament is shown. (a) t=0s (b) t=6s (c) t=11s (d) t=14s (e) t=22s (f) t=38s.
FIGURE 8. Comparison of different results obtained for the theoretical force signal,
corresponding to different values of the (G, λ) set. V=1 µm/s, e=1 µm. A0=7 µm2. a) G=75 Pa, λ=150 s. b) G=75 Pa, λ=50s. c) G=700 Pa, λ=10 s.
FIGURE 9. Comparison of average force levels obtained for the two different cell types (
∆-Cyto CHO and Ca1-6 CHO cells), together with the viscoelastic fit.
TABLE 1
CHO Cell type e (µm) V (µm/s) G (Pa) η (Pa.s) λ (s) A0=πa02(µm2)
Ca1-6 2.5-3.0 1 675 ±100 3375±100 5.0±1 140-165
∆∆-Cyto 1.5-2.5 1 250±50 1500±50 6.0±1 150-155
Table 1. Model parameters corresponding to the different cells tested
FIGURE 1
y x Cell chamber Cell chamber X-Y translations Piezo translator (Z) + X-Y translations Ultrazoom Cantilever holderFIGURE 2
1 2 3 4 6 7 5 8FIGURE 3
FIGURE 4
Z Z0 ∆∆Z αα RV
z F AFM cantilever (k) Microsphere Cell δδ hFIGURE 5
CHO Ca1-6 microsphere
CHO ∆∆cyto microsphere
FIGURE 6
FIGURE 7
(a) (b)
(c) (d)
(e) (f)
FIGURE 8
a)
b)
c)
FIGURE 9 0 20 40 60 80 100 120 140 0 10 20 30 40 50 Ca 1-6 ∆-cyto m odel ∆-cyto model Ca 1-6 tim e(s) fo r c e (n N )