1
DEFORMATIONS IN DEEP CONTINUOUS REINFORCED CONCRETE
TRANSFER GIRDERS
B. Mihaylov1, B. Hunt2, E. Bentz3and M. P. Collins3
1
University of Liege, Department of ArGEnCo, Sector Structural Engineering, Liege, Belgium. 2
Carleton University, Department of Civil and Environmental Engineering, Ottawa, Canada. 3
University of Toronto, Department of Civil Engineering, Toronto, Canada.
e-mail:[email protected],[email protected],[email protected],[email protected]
SUMMARY
This paper presents a three-parameter kinematic model for the deformation patterns of deep continuous transfer girders. The three degrees of freedom of the model are the average strains along the top and bottom longitudinal reinforcements within each shear span, as well as the transverse displacement in the critical loading zone. The model is validated with the help of a large test of a two-span continuous beam performed at the University of Toronto. It is shown that the apparently complex deformation patterns of the specimen are captured well by the kinematic model.
Keywords: transfer girders, deep beams, tests, shear deformations, kinematic model.
1. INTRODUCTION
Continuous beams with small span-to-depth ratios (deep beams) are common in urban construction. For example transfer girders near the podium level of high rise buildings are often used to support heavy column loads across large open spaces. As these members are characterized by large shear distortions, their serviceability and displacement capacity can be assessed accurately only with the help of complex non-linear finite element models. This paper presents the basis of an alternative approach: a kinematic model with only three degrees of freedom (DOFs) capable of capturing the apparent complex deformation patterns of deep beams under double curvature. This model stems from an earlier two-parameter kinematic model for deep beams under single curvature [1][2].
2. DEFORMATIONS IN CONTINUOUS DEEP BEAMS
The deformation patterns of deep continuous transfer girders will be discussed with respect to the test specimen shown in Fig. 1. This symmetrical two span continuous beam is approximately a one-third scale model of a full storey height transfer girder. It contained 0.91% of longitudinal reinforcement top and bottom and 0.20% of transverse reinforcement.
1120 64 60 4x25M 1x35M 4x25M 1x35M 85 #3 @235 fy fu u #3 25M 35M bar MPa x10-3 490 405 455 600 613 570 150 140 140 MPa 600 350 988 850 600 350 mount reinf. axis attached to top of beam 20 20 steel rod on column side att.to bottom of beam on column
side on columnside
150 45 888 1 2W 2E L V D T 3W 3E att.to rod 4W 4E 5W 6W 6E 5E 7W 8W 8E 7E 9W LVDT 9E 10W 11W 10E 11E 12W 13W 12E 13E Layout of LVDTs East 40 71 500 1000 Area mm2 300 300 P P a=1775 1700 a=1775 1700 7250 mm 503 Column 300/300 mm (typ.) 4x20M long. 10M@100 ties fy~ 400 MPa 51 ~ 300/300/102 steel plate 300/300/51 steel plate (typ.)
1 200 m m d =1094 Concrete f '=29.7 MPac ag=14 mm 300
2
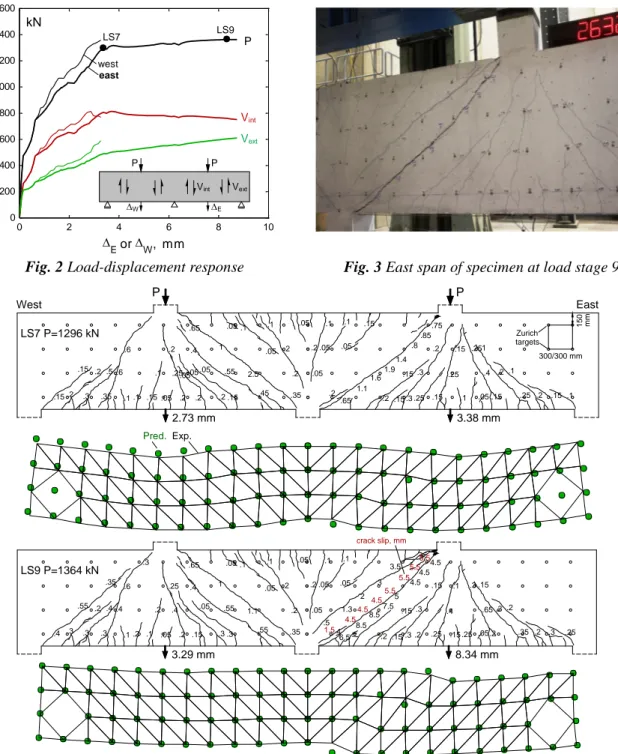
The beam was loaded to failure by two symmetrical loads P which were applied in nine load steps. At the end of each load step the load was lowered by about 10% in order to mark cracks and measure deformations on the concrete surface. The envelope of the measured load-deflection response of the specimen is shown in Fig. 2. The deflections under the two loads were measured with LVDTs 2E and 2W with respect to a steel rod going between two end mounts (Fig. 1). It can be seen that failure commenced in the east span after load stage 7 (LS7) when a small increase in load resulted in a large increase in deflectionEand the shear force Vintreached its maximum value. The load P could still be increased because Vext increased faster than Vint decreased. At LS9 a large diagonal crack had opened in the inner east shear span and concrete crushing was visible near the load, see Fig. 3. Strain measurements on the longitudinal reinforcement showed that the steel bars remained elastic.
Fig. 2 Load-displacement response Fig. 3 East span of specimen at load stage 9
.1 .1 .2 .05 .05 .05 .2 .65 1.1 1.6 1.9 .8 .85 .75 .2 .3 .15 .25 .15 .1 .05 .15 .25 .2 .15 .1 .2 .4 .1 .25 .15 .25 .1 1.4 .15 .2 .15 .3 .2 .05 .1 2.5 .2 .1 .05 1 .65 .45 .15 .2 .55 .2 .05 .25 .1 .05 .2 .15 .1 .35 .3 .2 .15 .2 .5 .6 .6 .2 .35 .15 .1 .4 .05 .05.05 LS7 P=1296 kN 2.73 mm 3.38 mm 300/300 mm 150 Zurich targets East m m P P West .1 .1 .2 .05 .05 2 3 1.3 .5 .05 1.5 6.5 8.5 8.5 7.5 4.5 4.5 4.5 3.5 .15 .3 .15 .2 .15 .3 .2 .25 .15 .25 .05.2 .35 .2 .3 .2 .3 .65 .15 .3 .1 .4 .25 5 4 4.5 4.5 4.5 5.5 5.5 5.5 5.5 .2 .05 .1 1.1 .2 .1 .05 1 .65 .55 .3 .3 .55 .15 .05 .4 .2 .05 .2 .1 .1 .3 .3 .3 .55 .2 .4 .4 .6 .35 .3 .25 .35 .4 .2 .4 .05 LS9 P=1364 kN crack slip, mm 3.29 mm 8.34 mm
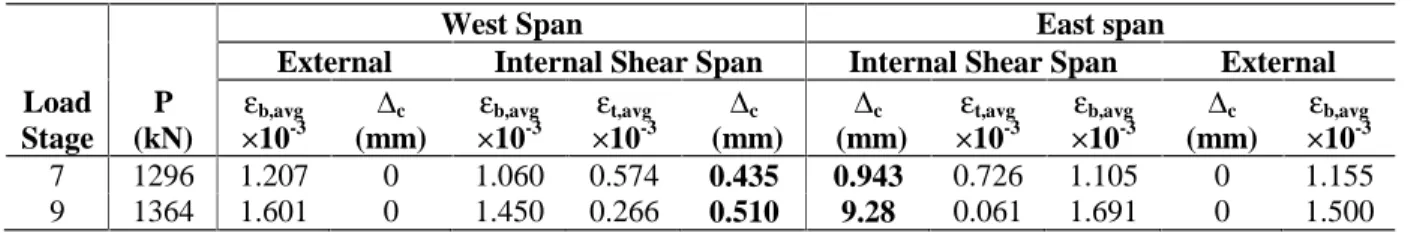
Fig. 4 Deformations in test specimen
Pred.Exp. 0 2 4 6 8 10 0 200 400 600 800 1000 1200 1400 1600 E orW, mm LS9 LS7 Vint west east kN Vint P P W E Vext Vext P
3
Figure 4 shows the crack diagrams and the measured deformed shapes of the specimen at LS7 and LS9. The deformed shapes were calculated from the readings of demountable displacement transducers taken on a 300 mm by 300 mm grid of targets and are drawn so that for each diagram the maximum displacement plots as if it was 150 mm. It can be seen that the crack patterns consist of three “fans” of cracks radiating out of the two loading points and the middle support. At LS7 the width of the critical diagonal crack in the inner east shear span reached 1.9 mm while the rest of the crack widths in this shear span did not exceed 0.55 mm. Despite the wide shear cracks, the deformed shape of the specimen at LS7 is dominated by flexural deformations characterized by “positive” curvatures in the spans and “negative” curvatures above the middle support. The shear deformations are evident from the distorted shape of the triangles along the major diagonal cracks. At LS9 when the east inner shear span was post-peak, the shear distortions dominated the measured deformed shape. The crack measurements along the critical diagonal crack show that its width reached 8.5 mm while the maximum crack slip was 5.5 mm. Significant crushing of concrete was observed at the top and bottom ends of the critical crack in the critical loading zones (CLZ) [2]. A simple description of these apparently complex deformation patterns is discussed next.
3. THREE-PARAMETER KINEMATIC MODEL
The deformation patterns of deep beams subjected to single curvature can be described by a two-parameter kinematic model suggested by Mihaylov et al. [1][2]. This model consists of the first two deformation patterns depicted in Fig. 5. The first pattern is associated with the elongation of the bottom longitudinal reinforcement (average strainb,avg) while the second pattern is associated with the transverse displacement c at the CLZ. The critical diagonal crack is assumed to extend from the inner edge of the support to the point along the loading plate where the shear force is zero or minimum. The cracked concrete below the crack is represented by a set of rigid radial struts pinned at the loading point and connected to the bottom reinforcement. The concrete above the critical crack is modelled as a rigid block. The combination of deformation patterns 1 and 2 is used to reproduce the complete deformed shape of the external shear spans of continuous deep transfer girders, see Fig. 6. The third deformation pattern in Fig. 5 is introduced in order to extend the two-parameter kinematic model to deep beams under double curvature. This pattern is associated with the elongation of the top longitudinal reinforcement (average straint,avg) and is an inverted version of pattern 1. When the three patterns are superimposed, they model the complete deformed shape of the internal shear spans of continuous transfer girders as shown in Fig. 6.
a+ d cotb,avg 1 d1 x z c x z x z k l c CLZ x z a+ d cott,avg 2 x z x z d 2 1 2 3 1 2 3 1 2 (c~ 0)~ x' z' x" z" b,avg t,avg c 1 P P
Fig. 5 Three-degree of freedom kinematic model for shear spans of deep beams
a+ d cott1,avg 1 d1 x z c x z x z k l c CLZ x z a+ d cott2,avg 2 x z x z d 2 1 2 3 1 2 3 1 2 (c~ 0)~ x' z' x" z" b,avg t,avg c 1 P P
Fig. 6 Three-degree of freedom kinematic model applied to a symmetrical two-span deep transfer girder
The deformation patterns of the three-parameter kinematic model can be expressed by the following algebraic relationships as a function of the degrees of freedom of the modelb,avg,t,avg, andc: - Points below the critical diagonal crack
x z bavgxx , ,
4
x z bavgx
h z
z , / 2 , (2)- Points above the critical diagonal crack
x x,z b,avg hz cot t,avg xazcot (3)
x z bavgx c tavg
x a z
a x
zz , , cot , cot /
(4)
To validate the model, equations (1)-(4) are applied to the test specimen based on the scheme depicted in Fig. 6. It is assumed that the transverse displacement in the CLZs of the external shear spans is negligible (c≈0) as the shear failure occurred in the east inner shear span. The rest of the DOFs of the model, namely the average strains in the bottom and top reinforcement, and the transverse displacements of the inner CLZs, were obtained from the readings of LVDTs 7E/W, 8E/W, 9E/W, 11E/W, and 13E/W (Fig. 1). The values at LS7 and LS9 are summarized in Table 1.
Table 1 Measured degrees of freedom of the three-parameter kinematic model
Load Stage
P (kN)
West Span East span
External Internal Shear Span Internal Shear Span External b,avg ×10-3 c (mm) b,avg ×10-3 t,avg ×10-3 c (mm) c (mm) t,avg ×10-3 b,avg ×10-3 c (mm) b,avg ×10-3 7 1296 1.207 0 1.060 0.574 0.435 0.943 0.726 1.105 0 1.155 9 1364 1.601 0 1.450 0.266 0.510 9.28 0.061 1.691 0 1.500
The resulting predicted locations of the points from the grid are shown with green circles in Fig. 4. It can be seen that the circles match well the vertices of the triangles depicting the measured locations of these targets. From Table 1 it can be seen that the average strains in the longitudinal reinforcement were almost symmetrical with respect to the middle section. This is due to the symmetrical bending moment diagram and the elastic longitudinal reinforcement. Furthermore, the average strains in the bottom reinforcement were almost constant along the two spans as characteristic of arch action in deep beams. The transverse displacement in the inner CLZs, on the other hand, differed significantly between the east and west shear spans since the shear failure occurred in the east span. Therefore, the three-parameter kinematic model shown in Fig. 5 can be used to accurately predict the entire deformed shapes of deep continuous girders such as the test specimen with the help of only four independent kinematic parameters: the average strain in the bottom reinforcement, the average strain in the top reinforcement between the loading points, and the transverse displacements of the two inner CLZs. These degrees of freedom can be predicted if the equations of the kinematic model are combined with equilibrium equations and appropriate constitutive relationships for the mechanisms of shear resistance of the member [2][3].
4. CONCLUSIONS
This paper showed that the apparently complex deformation patterns of deep continuous transfer girders can be accurately described by a kinematic model that uses only three degrees of freedom per shear span. These degrees of freedom are the average strains in the top and bottom longitudinal reinforcement, as well as the transverse displacement in the critical loading zone. The degrees of freedom of the model were measured in a test of a large shear-critical two-span continuous deep beam. It was shown that with the measured DOFs the three-parameter kinematic model provides an excellent approximation of the measured deformation patterns of the specimen. Approaches for predicting the values of the DOFs and using the model to estimate both shear strength and load distribution in such continuous girders near shear failure are discussed elsewhere [2][3].
References
[1] MIHAYLOV B., BENTZ E. and COLLINS M.P., A Two Degree of Freedom Kinematic Model for Predicting the Deformations of Deep Beams, CSCE 2nd International Engineering
Mechanics and Materials Specialty Conference, June 2011.
[2] MIHAYLOV B., BENTZ E. and COLLINS M.P., Two-Parameter Kinematic Theory for Shear Behaviour of Deep Beams, ACI Structural Journal, Vol. 110, No. 3, 2013, pp. 447-456. [3] MIHAYLOV B., HUNT B., BENTZ E., COLLINS M.P., Three-Parameter Kinematic Theory