arXiv:astro-ph/0305191v3 1 Nov 2004
Marguerite PIERRE, Ivan VALTCHANOV1, CEA/DSM/DAPNIA, Service d’Astrophysique, Saclay,
F-91191 Gif sur Yvette [email protected] Bruno ALTIERI
XMM Science Operations Centre, Villafranca, Spain Stefano ANDREON
Osservatorio Astronomico di Brera, Milano, Italy Micol BOLZONELLA6
IASF, Milano, Italy Malcolm BREMER
Department of Physics, University of Bristol, UK Ludovic DISSEAU
European Southern Observatory, Santiago, Chile Sergio DOS SANTOS
CEA/DSM/DAPNIA, Service d’Astrophysique, Saclay, France Poshak GANDHI
European Southern Observatory, Santiago, Chile Christophe JEAN
Institut d’Astrophysique et de G´eophysique, Universit´e de Li`ege, Belgium Florian PACAUD
CEA/DSM/DAPNIA, Service d’Astrophysique, Saclay, France
1
currently at Imperial College, London
6
Andrew READ2
School of Physics and Astronomy, University of Birmingham, UK Alexandre REFREGIER
CEA/DSM/DAPNIA, Service d’Astrophysique, Saclay, France Jon WILLIS3 4
European Southern Observatory, Santiago, Chile Christophe ADAMI
Laboratoire d’Astrophysique, Marseille, France Danielle ALLOIN
European Southern Observatory, Santiago, Chile Mark BIRKINSHAW
Department of Physics, University of Bristol, UK Lucio CHIAPPETTI
IASF, Milano, Italy Aaron COHEN
Naval Research laboratory, Washington, US Alain DETAL
Institut d’Astrophysique et de G´eophysique, Universit´e de Li`ege, Belgium Pierre-Alain DUC
CEA/DSM/DAPNIA, Service d’Astrophysique, Saclay, France Eric GOSSET
Institut d’Astrophysique et de G´eophysique, Universit´e de Li`ege, Belgium
2
currently at University of Leicester
3
Pontificia Universidad Cat´olica, Santiago, Chile
4
Jens HJORTH
Astronomical Observatory, Copenhagen, Denmark Laurence JONES
School of Physics and Astronomy, University of Birmingham, UK Olivier LE FEVRE
Laboratoire d’Astrophysique, Marseille, France Carol LONSDALE
Infrared Processing and Analysis Center, Caltech, US Dario MACCAGNI
IASF, Milano, Italy Alain MAZURE
Laboratoire d’Astrophysique, Marseille, France Brian McBREEN
Physics Department, University College, Dublin, Ireland Henry McCRACKEN5
Laboratoire d’Astrophysique, Marseille, France Yannick MELLIER
Institut d’Astrophysique, Paris, France Trevor PONMAN
School of Physics and Astronomy, University of Birmingham, UK Hernan QUINTANA
Pontificia Universidad Cat´olica, Santiago, Chile Huub ROTTGERING
Leiden Observatory, Leiden, The Netherlands
5
Alain SMETTE, Jean SURDEJ
Institut d’Astrophysique et de G´eophysique, Universit´e de Li`ege, Belgium Jean-Luc STARCK, Laurent VIGROUX
CEA/DSM/DAPNIA, Service d’Astrophysique, Saclay, France Simon WHITE
Max Planck Institut f¨ur Astrophysik, Garching bei M¨unchen, Germany. ABSTRACT
The XMM Large Scale Structure survey (XMM-LSS) is a medium deep large area X-ray survey. Its goal is to extend large scale structure investigations attempted using ROSAT cluster samples to two redshift bins between 0 < z < 1 while maintaining the precision of earlier studies. Two main goals have constrained the survey design: the evolutionary study of the cluster-cluster correlation function and of the cluster number density. The adopted observing configuration consists of an equatorial mosaic of 10 ks pointings, separated by 20′
and covering 8◦
×8◦
, giving a point source sensitivity of ∼5 10−15 erg cm−2 s−1 in the [0.5-2] keV band. This will yield more than 800 clusters
of galaxies and a sample of X-ray AGN with a space density of about 300 deg−2. We
present the expected cosmological implications of the survey in the context of ΛCDM models and cluster evolution. We give an overview of the first observational results.
The XMM-LSS survey is associated with several other major surveys, ranging from the UV to the radio wavebands which will provide the necessary resources for X-ray source identification and further statistical studies. In particular, the associated CFHTLS weak lensing and AMiBA Sunyaev-Zel’dovich surveys over the entire XMM-LSS area will provide for the first time a comprehensive study of the mass distribution and of cluster physics in the universe on scales of a few hundred Mpc. We describe the main characteristics of our wavelet-based X-ray pipeline and source identification procedures, including the classification of the cluster candidates by means of a pho-tometric redshift analysis. This permits the selection of suitable targets for spectro-scopic follow-up. We present preliminary results from the first 25 XMM-LSS pointings : X-ray source properties, optical counterparts,highlights from the first Magellan and VLT/FORS2 spectroscopic runs as well as preliminary results from the NIR search for z > 1 clusters. The results are promising and, so far, in accordance with our predictions. In particular: (1) we reproduce the LogN-LogS distribution for point sources obtained from deeper surveys at our sensitivity; (2) we find a cluster number density of 15-20 per deg2; (3) for the first time, we statistically sample the group mass regime at a redshift
1. Introduction
1.1. The role of clusters in cosmology
We have come a long way since the Virgo cluster of galaxies was discovered as an accumulation of “nebulae” by Messier in 1781, the first time the term “cluster” was used by Shapley & Ames in 1926, and the first inference of large amounts of “dark matter” in the Virgo cluster by Zwicky in 1933, to the point where clusters of galaxies are now routinely used as cosmological tools. This progress, is intimately related to the development and success of the standard cosmological model over the past 50 years, following ever-deeper insights into the early evolution of the Universe and the growing power of numerical simulations. From a simple theoretical point of view, clusters of galaxies - the most massive bound structures in the Universe - are objects having a mass of the order of 1014−16 M⊙growing by accretion at a rate governed by the initial density fluctuation spectrum,
the cosmological parameters, the nature and amount of dark matter as well as the nature of the dark energy. Their 3-dimensional space distribution and number density as functions of cosmic time constrain cosmological parameters in a unique way. Non-gravitational effects accompanying cluster formation render the picture more complicated, but compared to galaxies, clusters still offer considerable advantages for large scale structure (LSS) studies: they can provide complete samples of objects over a very large volume of space, and they are in crucial respects simpler to understand. The extent (and mass) of clusters can be traced by their X-ray emission while the theory describing their formation (biasing) and evolution from the initial fluctuations can be tested with numerical simulations. Such a level of understanding does not exist for galaxies - which have reached a highly non-linear stage - and even less for QSO and AGN formation. The resulting cluster LSS counts can constrain cosmological parameters, independently of Cosmic Microwave Background (CMB) and supernova (SN) studies since they do not rely on the same physical processes. In addition, they can also be used to test fundamental assumptions of the standard paradigm, such as the gravitational instability scenario. A quantitative overview of the cosmological implications of cluster surveys can be found for instance in Haiman et al (2001).
Conversely, given a cosmological model, a large and deep statistical sample of clusters would provide long-awaited information linking cluster physics, non-linear phenomena involved in cluster evolution, and scaling relations. Further, cluster number counts as a function of both the redshift and X-ray luminosity (or any observable), provide strong consistency tests on assumptions made in modelling the mass-luminosity (or mass-observable) relation and cosmological models involving dark energy (Hu 2003). This is timely, since following the WMAP2 results, independent cosmo-logical constraints from both the early and the local universe, must be integrated into a consistent framework.
1
paper based on observations obtained with the XMM,CFH, ESO (Prg: P70. A-0283; .A-0733), VLA, CTIO and Las Campanas observatories
2
1.2. The quest for clusters
Initiated by Abell in 1958 over the whole sky in the optical, the systematic search for clusters underwent a boost of activity in the X-ray waveband during the EINSTEIN (1978-1981) era. The first X-ray rockets and satellites had revealed the existence of X-ray emission associated with clusters. The UHURU (1970) data, in particular, showed that this emission is thermal and originates in a hot diffuse gas trapped in the gravitational potential of the cluster. The Extended EINSTEIN Medium Sensitivity Survey (EMSS3) provided some 730 serendipitous X-ray sources extracted from
pointed observations down to a sensitivity of 1.5 10−13 erg cm−2 s−1 in the [0.3-3.5] keV band. A
sub-sample of 67 sources identified as clusters of galaxies in the 0.14 < z < 0.6 range, (Gioia et al 1990) suggested, for the first time, a mild evolution in the cluster number density. Next, the ROSAT All-Sky-Survey4 (RASS, 1990-1991) provided the first sample of X-ray clusters over the entire sky and thus, a fundamental resource for LSS studies. Cosmological implications have been investigated in detail from the southern REFLEX (3 10−12erg cm−2 s−1 in the [0.2-2.4] keV band)
and North Ecliptic Pole samples (down to 3 10−14 erg cm−2 s−1) by B¨ohringer et al (2001) and
Henry et al. (2001) respectively.
In parallel, following on the EMSS achievement, serendipitous searches for distant clusters in deep pointed ROSAT observations led to the discovery of clusters out to z ∼ 1.2 with a modest evolution of the high luminosity cluster population; a summary of the main X-ray cluster surveys is presented on Fig. 1.
Both, structure and luminosity evolution studies, are consistent with hierarchical models of structure formation in a flat low density universe with matter density Ωm ∼ 0.3 and amplitude
of mass fluctuations on 8 h−1 Mpc scale, σ
8 ∼0.7 − 0.8 (see Rosati et al (2002), for a review).
In parallel, the quest for clusters in the optical made its own way, from automated searches on digitised sky survey plates to deep multi-colour CCD imaging. Indeed, beyond z ≥ 0.8, detecting clusters only from galaxy overdensity in a single band is severely hampered by the faint background population, so that the use of fine-tuned photometric redshift information becomes mandatory (see e.g. Sec. 5.1). However, given the limitations on the accuracy of such methods and various un-derlying hypotheses about galaxy evolution, this usually yields large numbers of high-z candidates, many of them simply being portions of cosmic filaments seen in projection. One will thus always require in default of extensive optical spectroscopic campaigns, an ultimate confirmation from the X-ray band, to assess the presence of deep potential wells.
3
http://xml.gsfc.nasa.gov/archive/catalogs/9/9015/
4
http://heasarc.gsfc.nasa.gov/docs/rosat/survey/. In survey mode the PSF HPD is ∼ 130′′at 1 keV (from EXSAS
1.3. The power of XMM
At the time the XMM project was initiated5, the case for surveys was not as compelling as it is today. Ten years after the completion of the RASS, and following considerable steps forward in our knowledge of cluster physics (e.g. Peterson et al (2003)), XMM is in a position to open a new era for X-ray surveys. Its high sensitivity, considerably better PSF than the RASS (FWHM ∼ 6′′
on axis6) and large field of view (30′
), make it a powerful tool for the study of extragalactic LSS. In this respect, two key points may be emphasised. Firstly, a high galactic latitude field observed with XMM at medium sensitivity (∼ 0.5 − 1 10−14 erg cm−2 s−1) is “clean” as it contains only two
types of objects, namely QSOs (pointlike sources) and clusters (extended sources) well above the confusion limit. Secondly, if clusters more luminous than L[2−10] ∼3 1044 h−702erg/s are present at
high redshift, they can be detected as extended sources out to z = 2, in XMM exposures of only 10 ks. XMM is a powerful wide angle X-ray imager, with a sensitivity to extended sources which will remain unrivalled in the coming decade. In parallel, progress in optical wide field imaging makes it possible to undertake optical identification of faint X-ray sources over tens of square degrees. Consequently, we are now in a position to probe the evolution of the cosmic network traced by clusters and QSOs over large volumes of the Universe to high redshift.
1.4. The goals of the XMM-LSS
Each new generation of instruments brings major improvements over its predecessors. While the BCS sample presented hints of structure in the sky distribution of X-ray bright clusters, RE-FLEX was the first X-ray survey to systematically address LSS with clusters in the nearby universe (450 clusters with z ≤ 0.2). Ten years later, there is a clear need to investigate the evolution of the cosmic network out to z ∼ 1. In this context, we have designed a survey to yield some 800 clusters in two redshift bins with 0 < z < 1: the XMM Large Scale Structure Survey (XMM-LSS). This simple goal has set the sensitivity and the coverage of the XMM-LSS and, as shown in Sec.2.1, implies an X-ray sensitivity about two orders of magnitude deeper than REFLEX. Consequently, this survey will determine how the cluster number density evolves - a hotly debated topic. It will also trace the LSS as defined by X-ray QSOs out to redshifts of ∼ 4. The cosmological implications of the XMM-LSS are summarised in Sec. 2. In addition, the proposed X-ray survey is associated with several other major new surveys (optical, IR, Radio, UV). This will provide a new data set that can be used to study the evolution of clusters, cluster galaxies, and star and AGN formation as a function of environment, in the context of structure formation. An overview of these capa-bilities is presented in Sec. 3. In the following sections we present a summary of results derived
5
first discussions proposing 27 telescopes in 1982; acceptance in 1988
6
the XMM PSF broadens and becomes irregular with increasing off-axis angle; for instance, at 1.5 keV, the radius at which 90% of the energy is encircled is ∼ 50′′ and 65′′ for off-axis angles of 0 and 12′ respectively for the pn
from the XMM AO-1 data set, demonstrating the feasibility of the project. Specifically, in Sec. 4, we describe our current X-ray source identification procedure, which led to the first spectroscopic and NIR follow-up campaigns in Autumn 2002 (Sec. 5 & 6). Future activities and immediate improvements are presented in Sec. 7.
1.5. The XMM-LSS consortium
The wide scope of the project has motivated the assembly of a large consortium to facilitate both the data reduction/management and the scientific analysis of the survey. The XMM-LSS Consortium comprises some fifteen European and Chilean institutes. The project is presented in detail on the following website: http://vela.astro.ulg.ac.be/themes/spatial/xmm/
LSS/index e.html
2. Survey design and cosmological implications 2.1. Defining the survey
Given our driving goal of extending the REFLEX achievements to high redshift (Sec. 1.4), the following objectives drove the design of the survey.
•Measure the cluster correlation function in two redshift bins spanning 0 < z < 1, with a good level of accuracy. A first estimate using the Hubble Volume Simulations7 of a ΛCDM universe, showed that some 400 clusters per redshift bin are necessary in order to obtain an accuracy of 15-20% on the correlation length; this is comparable to the size of the low-z REFLEX sample. Subsequent implications for the accuracy of the determination of the cosmological parameters are summarized in Sec. 2.2.
•Probe a comoving length which is significantly larger than 100 h−1Mpc at z ∼ 1, the
characteristic scale in the galaxy power spectrum of the local universe (e.g. Landy et al (1996)). This constraint corresponds to an opening survey angle of ∼ 10◦
at z = 1 (i.e. 400 h−1Mpc)
• Find the best compromise between the two above constraints in order to minimise the necessary XMM observing time. Quantitatively, we used the Press-Schechter formalism (Press & Schechter 1974) and the mass-temperature relation from simulations to predict the counts of clusters and their X-ray properties in several CDM models (Refregier et al 2002). We computed the detection efficiency of clusters, using realistic simulations of XMM images, and studied how this differs from a conventional flux limit.
7
In order to fulfil the first 3 conditions above, and assuming the current favoured ΛCDM cosmological model, the optimal survey design was found to be an 8◦ ×
8◦
area, paved with 10 ks XMM pointings separated by 20 arcmin (i.e. 9 pointings per deg2). The expected ultimate
sensitivity is ∼ 3 10−15 erg cm−2 s−1 for pointlike sources in the [0.5-2] keV band. This is about
1000 and 10 times deeper than the REFLEX (B¨ohringer et al 2001) and NEP (Henry et al. 2001) single area surveys respectively and provides much better angular resolution (6′′
vs 2′
). So far, some 6 deg2 have been covered by XMM in the region.
• Find an adequate survey location. An equatorial field is optimal, as ground-based follow-up resources from both hemispheres may be used. High galactic latitude and the absence of bright X-ray sources (e.g. nearby clusters) are also required. Moreover, the visibility of the field by XMM must be ≥ 15%. Given this, only one area in the sky turned out to be favorable: a field centred around α = 2h18m00s,δ = −7◦
00′
00′′
(at b = −58◦
) with neutral hydrogen column 1.4 × 10²⁰ < NH(cm−2) < 3.5 × 10²⁰. Whereas this region appears to be the best compromise
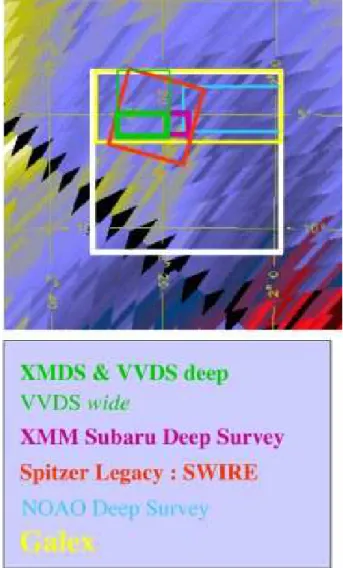
between many astronomical and instrumental constraints, it should be noted that it is not optimal for far infra-red observations (above 25 µm) because of cirrus contamination. The X-ray survey is centred on two deeper areas (one and two square degrees) deriving from XMM guaranteed time programmes (GT). Several surveys are located in the same region (Sec.3) of which an overview map is presented on Fig. 2.
2.2. Constraining cosmology - Quantitative assessments
The prospects that the XMM-LSS cluster catalogue offers for determining cosmological pa-rameters have been studied in detail by Refregier et al (2002). We recall here the main issues.
• The cluster counts set strong constraints on the value of the (Ωm−σ8) combination. This
combination will also provide a consistency check for the ΛCDM model, and a discrimination between this model and the OCDM model.
•The addition of the cluster 2-point correlation function provides a constraint on Γ, the shape of the initial density fluctuation power spectrum.
• With the current survey design, the simultaneous expected precision on Ωm, σ8 and Γ is
about 15%, 10%, 35% respectively. It is important to note that the present uncertainties on σ8
globally result in a factor of 2 uncertainty in our predicted cluster numbers of ∼15 deg−2
(i.e. from 600 to 1200 cluster detections expected within 0 < z < 1). The high sensitivity to σ8 is not
surprising, as it is precisely this which makes cluster counts a good measure of this parameter. This uncertainty can be reduced by analysing about 15 deg2 of the XMM-LSS, the minimum area
required to improve upon the current measurements of σ8 in the presence of shot noise and cosmic
variance.
detected out to a redshift of 0.6, and will unveil the nearby group population (the cluster selection function can be found in Refregier et al (2002)). Rather few galaxy groups have been well-studied in the nearby universe, whereas they are believed to constitute the majority of the mass, and of the baryon reservoir. They are also the building block of richer clusters. With increasing redshift, the XMM-LSS is less sensitive to low mass systems. Consequently, the low-z and high-z samples to be used for the study of the LSS, will pertain to different cluster mass ranges. But as outlined above, this does not prevent the derivation of strong cosmological constraints. The XMM-LSS high-z clustering properties will be compared to the REFLEX ones, which accurately sample the most massive nearby clusters. Moreover, given the large volume sampled at high redshift, the XMM-LSS is well suited to constraining the abundance of distant massive clusters. For instance, the probability of finding a Coma-like cluster in the 1.5 < z < 2 range over 64 deg2 is the order
of 6 10−7 for a ΛCDM universe. Finding a few such objects would thus put the current favored
cosmological model into severe troubles, or strongly question our understanding of cluster physics at high redshift.
3. Associated multi-wavelength surveys : an overview
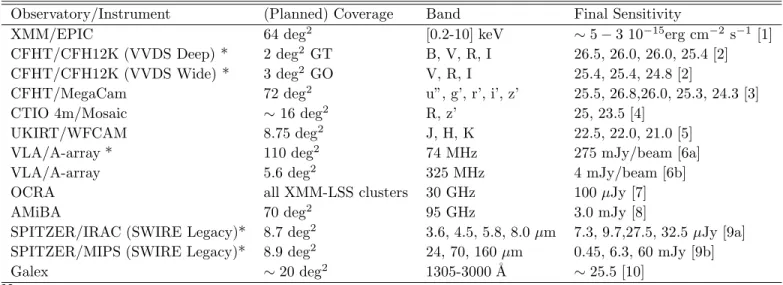
While optical information remains the primary data base for X-ray source identification, con-tribution from other wave bands may be critical, for example in the far infra-red domain, where many heavily absorbed X-ray QSO, not visible in the optical, are expected to show up. Beyond the necessary identification step, multi-wavelength information provides an overview of the energy emission and absorption processes in astronomical objects, which is vital to our understanding of their physics, formation and evolution. The contiguous design of the XMM-LSS, optimised for large scale studies, provides considerable advantages for complementary observations, compared to serendipitous fields, and the project has developed numerous collaborations at other wavelengths. The main characteristics of associated surveys are summarised in Table 1 and their main science applications are outlined below.
Optical, NIR and UV imaging: The imaging of the 8 × 8 deg2 XMM-LSS area is one of the priorities of the Canada-France-Hawaii Legacy Survey8 (CFHTLS). It is being performed by Mega-Cam, the one degree field imager built by CEA and installed at the new CFHT prime focus. Imaging of the XMM-LSS region started by mid 2003. The CFHTLS will provide deep high quality optical multi-colour imaging counterpart of the X-ray sources at a rate of 25 deg2/yr in at least three colours. Data pipelines and processing have been developed by the TERAPIX9 consortium which
provides object catalogues and astrometric positions for the entire surveyed region. Currently, the optical data used for the identification work, and presented in this paper, mostly pertain to the CFH12K VIRMOS-DESCART VLT Deep Surveys (VVDS [deep] and [wide], Fig. 2 and Tab.1, (Le
8
http://cdsweb.u-strasbg.fr:2001/Science/CFHLS/cfhtlscfhtoverview.html
9
Table 1: XMM-LSS X-ray and associated surveys.
Observatory/Instrument (Planned) Coverage Band Final Sensitivity
XMM/EPIC 64 deg2 [0.2-10] keV ∼5 − 3 10−15erg cm−2 s−1[1] CFHT/CFH12K (VVDS Deep) * 2 deg2 GT B, V, R, I 26.5, 26.0, 26.0, 25.4 [2] CFHT/CFH12K (VVDS Wide) * 3 deg2 GO V, R, I 25.4, 25.4, 24.8 [2] CFHT/MegaCam 72 deg2 u”, g’, r’, i’, z’ 25.5, 26.8,26.0, 25.3, 24.3 [3]
CTIO 4m/Mosaic ∼16 deg2
R, z’ 25, 23.5 [4] UKIRT/WFCAM 8.75 deg2 J, H, K 22.5, 22.0, 21.0 [5] VLA/A-array * 110 deg2 74 MHz 275 mJy/beam [6a] VLA/A-array 5.6 deg2 325 MHz 4 mJy/beam [6b]
OCRA all XMM-LSS clusters 30 GHz 100 µJy [7]
AMiBA 70 deg2
95 GHz 3.0 mJy [8]
SPITZER/IRAC (SWIRE Legacy)* 8.7 deg2
3.6, 4.5, 5.8, 8.0 µm 7.3, 9.7,27.5, 32.5 µJy [9a]
SPITZER/MIPS (SWIRE Legacy)* 8.9 deg2
24, 70, 160 µm 0.45, 6.3, 60 mJy [9b]
Galex ∼20 deg2
1305-3000 ˚A ∼25.5 [10]
Notes: * :complete
[1]: for pointlike sources in [0.5-2] keV [2]: ABM ag, 5′′ aperture
[3]: S/N = 5 in 1.15′′aperture
[4]: 4 σ in 3′′ aperture
[5]: VegaM ag
[6a]: 30′′ resolution; deeper observations planned
[6b]: 6.3′′ resolution [7]: 5σ, detection limit [8]: 6σ, detection limit [9a]: 5σ [9b] 5σ [10]: ABM ag
F`evre et al 2004)). An optical cluster catalogue is under construction using both spatial clustering analysis and multi-colour matched filter techniques, in addition to photometric redshift estimates. Moreover, the MegaCam data will form the basis of a weak lensing analysis10, whose cosmological
constraints will be compared to those provided by the X-ray data on the same region. This will be the first, coherent study of LSS on such scales. R and z’ imaging taken by us at CTIO are also being analysed, forming the basis of an independent cluster catalogue (Sec. 5.1, Andreon et al (2004)). In addition, deep NIR VLT imaging (J & K ) of z > 1 cluster candidates found in the XMM-LSS is performed as a confirmation prior to spectroscopy. Finally, a sub area of 8.75 deg2 of
the XMM-LSS field is a high priority target of the Deep Extragalactic Survey part of the UKIRT Deep Sky Survey (UKIDSS11). In the UV domain, the XMM-LSS field is one of the targets of the Galex12 Deep Survey, whose main goal is to map the global history of star formation out to z ∼ 2.
Spectroscopy: The standard spectroscopic follow-up is designed to perform redshift measure-ments for all identified 0 < z < 1 X-ray clusters in Multi-Object-Spectroscopy mode, using 4m and 8m class telescopes. Current identification procedures and first results are described in later Sections. We shall subsequently undertake programmes of advanced spectroscopy that will focus on individual objects, and include high resolution spectroscopy, the measurement of cluster velocity dispersions and QSO absorption line surveys, as well as NIR spectroscopy of our z > 1 cluster candidates.
Radio: In the radio waveband, the complete survey region is being mapped using the VLA at 74MHz and 325MHz. First results of this low frequency coverage are described by Cohen et al (2003). Radio observations are not only particularly relevant for tracing merger events triggered by structure formation, but also as a useful indicator of galactic nuclear or star-formation activity. Sunyaev-Zel’dovich: Observations (S-Z) are also planned. Clusters in the XMM-LSS field are the targets of the prototype OCRA (One-Centimeter Radiometer Array, Browne et al (2000)) instrument. The full XMM-LSS field will be mapped by the OCRA (start in 2005), and will be an early target of the Array for Microwave Background Anisotropy (AMiBA) (Lo et al 2000). This will enable not only the measurement of the Hubble constant, but also a statistical analysis of the physics of the ICM as a function of redshift. For instance, the AMiBA deep survey will be sensitive to clusters with M ≥ 1.5 1014 out to z < 2 (Liang 2001). A cross-correlation between the
AMiBA and XMM maps in the survey region, will thus allow us to study the gas properties of X-ray selected clusters and to detect clusters beyond the X-ray detection threshold. Such measurements are complementary to the X-ray and weak lensing surveys, connecting the mass distribution of clusters to the structure of the hot gas they contain. The three data sets together will also provide
10 http://www2.iap.fr/LaboEtActivites/ThemesRecherche/ Lentilles/LentillesTop.html 11 http://www.ukidss.org/ 12 http://www.srl.caltech.edu/galextech/galex.htm
a direct and independent check of the extragalactic distance scale.
Infrared: In the infrared, the SWIRE13SPITZER Legacy Programme covered ∼ 9 deg2 of the XMM-LSS in 7 MIR and FIR wavebands from 4 to 160 µm (Lonsdale et al 2003). The estimated IR source densities per square degree in this area are around 1100/400/130 and 670/150/130 for starbursts/spiral-irregular/AGN in the 0 < z < 1 and 1 < z < 2 redshift intervals, respectively (Xu et al 2003). This represents a unique X-ray/IR combination in depth and scales to be probed. The coordinated SWIRE/XMM-LSS observations will clarify an important aspect of environmental studies, namely how star formation in cluster galaxies depends on distance from the cluster centre, on the strength of the gravitational potential, and on the density of the ICM. In this respect the XMM-LSS represents the optimum SWIRE field, where galaxy environment, deep NIR imaging and optical spectroscopic properties will be the main parameters in modelling the MIR/FIR activity. Here also, the location of IR AGNs within the cosmic web will help establish their nature. The FIR/X/optical/radio association will also provide valuable insights into the physics of heavily ob-scured objects, as well as the first coherent study of biasing mechanisms as a function of scale and cosmic time, for hot (XMM), dark (weak lensing), luminous galactic (optical/NIR) and obscured (SWIRE) material.
In summary, we may underline the complementarity of the two major categories of associated surveys. Those covering an area of the order of 10-20 deg2, focussing on source environment, will provide new insights on the physics of AGN and clusters. Surveys planned over a ∼ 70 deg2 area
(MegaCam and AMiBA), in addition to proper LSS studies, are intended strong consistency tests on assumptions made in modelling the cluster mass/luminosity and mass/temperature relations and cosmological models involving dark energy.
4. X-ray source lists
In addition to the XMDS Guaranteed Time survey consisting of 18 pointings (Fig. 2), 33 Guest Observer XMM-LSS pointings have been allocated in the first two XMM AOs. The results presented in this section pertain to the first 27 GO XMM-LSS pointings allocated in AO1. Most of the X-ray observations were performed in good background conditions. However, two pointed GO observations (namely B13 and B17) are heavily contaminated by solar flares, having a mean total count-rate approximately 100 times higher than the quiescent background. Effective exposure times range from 5 to 16 ks (after removal of bad time intervals, mainly due to flares). The mean exposure time weighted over the area is about 12 ks and 9 ks for the MOS and pn detectors respectively, which is close to the nominal survey exposure time of 10 ks. Statistics presented in this section are obtained using the 25 good pointed observations that were used out to an off-axis angle of 10′
and cover a total area of 2.18 deg2.
13
4.1. Source detection and statistics
The XMM-LSS pipeline is based on a 3 stage filtering/detection/measurement process initiated by Valtchanov et al (2001). After applying the standard XMM pre-reduction procedure14, photon images are generated in several energy bands, and the 3 detector images are co-added in each band. This mosaic is subsequently filtered by a multi-resolution algorithm (in counts, to preserve Poisson statistics): a scale-dependent wavelet coefficient threshold, (corresponding to a probability for each event of being a random background fluctuation lower than 10−3) is computed in wavelet
space by histogram auto-convolution, and followed by an iterative reconstruction of the image (MR1, see Starck & Pierre (1998)). The source extraction procedure SExtractor (Bertin & Arnouts 1996) is then applied on the resulting image to obtain a preliminary list of sources. At this stage, extraction parameters are set in order to avoid missing faint sources. Co-adding images allows us to increase the S/N before filtering and, consequently, to lower the detection thresholds in the first step. Third step consists in examining the likelihood of the detections and characterizing their extent by means of a procedure we have developed (Xamin, Pacaud et al (2005)). The principle is the following: For each Sextractor source, it performs a maximum likelihood profile fit on two raw photon images (PN image, and co-added MOS images) independently, thus yielding a quantitative assessment of the source, taking into account the PSF variation with energy and off-axis radius, as well as other detector characteristics (vignetting, bad pixels, CCD gaps). Two source models are tested: a PSF model provided by the XMM calibration files, and a spherically symmetric β-model (with fixed β = 2/3) convolved with the PSF. Models are weighted by the exposure maps at the location of the fit. The parameters that are varied for each source are: position, local background, count rates and core radius of the β-model. Position and extension are forced to be the same in each detector, while count rates are adjusted independently for each EPIC detector type. At the end of the analysis Xamin yields a catalogue of some 50 parameters for each source including: source count rates (in each detector type), likelihood of detection, likelihood of source extent, and extension in arcsec. Finally, discrimination between pointlike and extended sources, is performed in the [Detection Likelihood / Extent] parameter space, calibrated by means of extensive image simulations spanning a wide range in source counts and extent. Performing this analysis on the 25 first 10 ks pointings, we detect some 200 sources per square degree down to a flux limit of 5 10−15
erg cm−2
s−1
in the [0.5-2] keV band for a detection likelihood threshold of 20 (assuming a power-law spectrum with a photon index of Γ = 1.7). Corresponding log N-log S curve is shown on Fig. 5.
14
4.2. Extended sources and visual check
As clusters of galaxies constitute the core of the project, special care is devoted to the detection and assessment of faint extended sources. The MR1/Sextractor/Xamin hybrid method described above provides a series of parameters used to establish a preliminary list of extended sources. Currently, the procedure is performed on the [0.5-2] keV catalogue which offers optimal sensitivity considering the observed cluster emission spectra over the 0 < z < 1 range, the various components of the background (galactic, particle, solar flares), and galactic absorption. We have developed an automated interface to produce X-ray/optical overlays for every extended source candidate (Fig. 4). At the end of the pipeline procedure, each overlay is inspected by eye in order to catch possible instrumental artefacts which could have escaped the pipeline rejection algorithm. Finally, a list of plausible extended sources is issued with an indication of whether they correspond to an obvious overdensity of galaxies. We currently find an extended source density of about 15-20 deg−2
, with conspicuous optical cluster (or group) counterparts on the CFH12K I images. At this stage, given the small number of spectroscopically confirmed clusters, it is not possible to make firm statements about these results. The fact that we tend to find somewhat more extended objects than formally predicted, would suggest that either we sample the cluster population below the 2 keV limit that was set in our theoretical predictions, using a given set of M-T-L(z) relations or that we are more sensitive than assumed. An example of the sensitivity performances for extended sources is displayed in Fig. 6. This suggests that we reach a sensitivity of at least 10−14 erg cm−2 s−1 in the
[0.5-2] keV band to extended sources of over a large fraction of the detector. Which is in agreement with the predictions of Refregier et al (2002), showing that the cluster selection function is close to a flux limit of 10−14 erg cm−2 s−1 for z < 1 clusters. The detailed study of the log N-log S
distribution of extended sources and of their selection function will be the subject of a forthcoming paper.
5. Source classification 5.1. Clusters
The depths of both the XMM-LSS and of the CFHTLS and CTIO data, have been tuned to sample most of the cluster population out to a redshift of 1 (Sec. 2.1 and Tab. 1). Beyond this, massive clusters can still be detected in the X-ray band (Valtchanov et al 2001). A cluster located at z ∼ 2 and having a temperature of 7 keV will show up with an apparent temperature of about 2.5 keV, which falls in the most sensitive part of the XMM response. Hence, for such a cluster, the X-ray K-correction is only ∼ 0.7 (Jones et al 1998). In contrast, z > 1 clusters do not appear as significant overdensities of galaxies in the optical band. Increasing the depth of the optical survey would not significantly improve the situation, as most of the galaxy light is shifted into the infrared band. We have therefore adopted the following approach and definitions:
1) A z ≤ 1 cluster candidate is defined as an extended X-ray source corresponding to a significant visual excess of galaxies in the optical wavebands. The multi-colour BVRIz’ information is used to enhance the visual contrast of the cluster galaxy density with respect to the background population and to construct optical cluster catalogues following different methods : the Red Cluster Sequence (Gladders & Yee (2000), Andreon et al (2004)), clustering analysis in redshift slices (Adami et al 1998), and matched filter (Lobo et al 2000).These catalogues are currently used as ancillary information and cross-correlated with the X-ray extended source catalogue. Further, the optical data allow us to assign photometric redshifts to the X-ray cluster candidates in an independent way. First, we apply the public code Hyperz (Bolzonella et al 2000) to the entire BVRI galaxy catalogue. For each galaxy, we derive the photometric redshift, corresponding to the minimum χ2 computed comparing the observed photometry to the fluxes expected from a set of
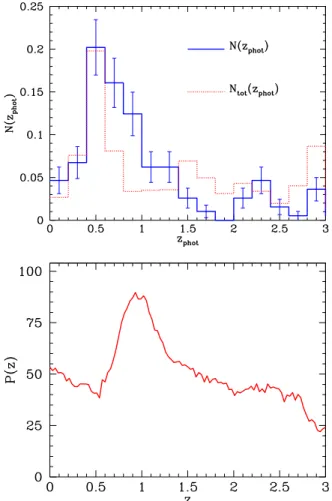
reference templates (GISSEL98, Bruzual & Charlot (1993)). Second, we search for the cluster signature by placing a number of apertures in the field of the X-ray detection in order to determine the maximum overdensity in photometric redshift space relative to the “field” distribution . This approach does not assume that the distribution of cluster galaxy members apparent in the optical data is centred on the X-ray detection and it makes no prior assumption of the apparent optical extent of the candidate cluster. The redshift bin in N (zphot) has been set similar to the precision
expected from photometric redshifts, given the set of filters and their depths (typically ∆z = 0.2). Finally, from the region with the largest overdensity detected, we selected the candidate cluster members in different classes of confidence, considering their zphot, their error bars and probability
functions. The method is illustrated by Fig.7 and 8. This procedure enables the pre-selection of the cluster candidates into NEAR and MID distance classes, corresponding to the 0 < z < 0.5 and 0.5 < z < 1 ranges respectively, and provides a useful tool for ascribing targets to the various telescopes available for the spectroscopic follow-up.
2) A small fraction of the extended sources (≤ 1 per pointing) do not present any significant optical counterpart – occasionally, one or two galaxies visible in the I or z’ band, sometimes nothing at all. These are typically interesting z > 1 cluster candidates and are classified into the third category, DISTANT, to be imaged in the NIR bands. If confirmed, they are the subject of dedicated spectroscopic follow-up programmes.
5.2. AGNs and QSO
Active galactic nuclei constitute by far, the dominant population of X-ray sources at the XMM-LSS sensitivity. Given the XMM PSF, and consequently, the positional accuracy, there is some ambiguity in the identification of pointlike sources, as can be appreciated in Fig. 4 (note the sources having two or three possible optical counterparts, or for which the optical ID is below the limit of the optical survey). This is a well known draw-back, thoroughly studied in deep surveys; but here, the situation is simpler since the XMM-LSS flux limit is well above the confusion limit.
6. First spectroscopic campaigns 6.1. Strategy
The first spectroscopic observations dedicated to the identification and redshift measurement of the XMM-LSS galaxy clusters took place during the fall of 2002. Three nights were allocated at ESO on the VLT/FORS2 instrument and 2 nights at Las Campanas with the Magellan/LDSS2 instrument. We summarise here the most important outcomes. Galaxy cluster candidates were pre-selected as described above, comprehensive information (X-ray, optical, photometric redshift) being gathered into an HTML database, allowing a rapid overview of the cluster properties. From this, we selected a number of clusters spanning different optical morphology and flux ranges, in order to optimise the allocated spectroscopic time, and to give a representative overview of the XMM-LSS cluster population. For the first spectroscopic campaign, it was decided to conservatively obtain two masks per cluster in order to sample well the cluster galaxies in the central region, and ensure confident redshift determination. Thanks to the high throughput of the FORS2 instrument in the [0.8-1] µm range, all MID galaxy cluster candidates were directed to the VLT sample. The NEAR ones were assigned to the Magellan sample, and also as backup sources for VLT, in case of possible poor weather. In order to investigate and quantify the most efficient method for the future, galaxies to be measured were selected using different approaches: simple magnitude cut, colour selection or photometric redshift criteria.
No dedicated spectroscopic runs were planned in 2002 for the QSO and AGN population. However, many pointlike X-ray sources surrounding the selected clusters and present in the cor-responding instrumental field of view were included in the spectroscopic masks. For each 7′ ×
7′
field centred on a galaxy cluster candidate, we first cross-correlated the X-ray point-like source catalogues with the optical ones obtained from the CFH12K data. We then searched for optical counterparts within a radius of 5′′
from each X-ray point-like source and produced catalogues of associations. Using the latter, we overlaid on the optical images the positions of the X-ray sources and their associated optical counterparts, if any. Then, we visually checked on the optical images each X-ray position (no more than ten per field) associated with 0, 1 or more optical counterparts. Depending on the “quality” of the X/optical associations, we sorted the AGN/QSO candidates into different categories characterising the priority for spectroscopic observations of the optical counter-parts. There were three main classes: (1) unambiguous cases where a unique and relatively bright optical source lies within a radius of 5′′
; (2) ambiguous or doubtful cases when there were several possible optical counterparts and/or when the optical counterpart(s) was (were) rather faint; (3) rejected cases when there was no, or a much too faint, optical counterpart. The fraction represented by each class was ∼ 35, 25 and 40% respectively. A catalogue containing the first two classes of AGN/QSO candidates was considered for spectroscopic observations of each field. Given the con-straints imposed by the cluster spectroscopy (especially, optimal sampling of the cluster cores) and the zones of avoidance within the FORS2 field of view, an average of 2-3 pointlike sources were measured per cluster field. This corresponds to about 30-45 sources per deg2.
6.2. Overview of the results
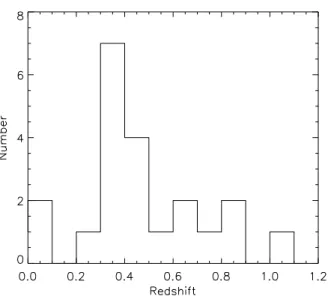
Weather and working conditions at the VLT were optimal. In three nights, 12 cluster fields (5 MID, 7 NEAR – z > 0.35) were observed, containing on average about 30 slits per mask, yielding some 700 spectra. In addition, 2 new nearby compact groups were also observed (with 7 and 8 galaxies per group), prepared as a backup programme. The overall strategy proved successful. An example spectrum is shown in Fig. 9. Encouragingly, an estimate of the velocity dispersion (16 cluster galaxy spectra) of a newly discovered 0.85 redshift cluster can be achieved in 2 hours, supporting the follow-up of large numbers of distant clusters with relatively little observing time. Seven NEAR clusters were observed at Magellan, where one night out of the allocated two suffered from poor meteorological conditions. With an average number of slits of 15 per masks, some 200 spectra were obtained.
The photometric cluster distance estimates proved useful and reliable indicators for the cluster classification (cf Fig. 7, 8). Current results on the measured redshift distribution are shown on Fig.10. Given the exploratory selection procedure adopted for this first identification campaign, this cannot be ascribed any cosmological interpretation yet. These measurements, however, enabled us to compute the cluster luminosities and, subsequently, to confirm our sensitivity predictions (Refregier et al 2002) and to demonstrate that we are sampling a new population of low luminosity (i.e. low mass) objects. Fig. 11 displays the luminosity distribution of our current confirmed cluster sample as a function of redshift, compared to the previously known set of X-ray clusters: out to 0.5, we identified a bunch of very faint clusters, thus significantly extending the sample that was inventoried in the very local universe so far (z < 0.1). Between 0.5 < z < 1, we are similarly discovering the high redshift counterparts of the known z < 0.5 cluster population. Further statistical analysis of this population will be especially relevant to better constrain the evolution of cluster scaling laws as to the gas properties, since groups are more sensitive than clusters to the interactions with the individual galaxies. From the LSS point of view, low mass groups will provide a precious link between structure underlined by clusters and those by galaxies, thus enlightening the bias controversy. A comprehensive X-ray/optical study of the current NEAR and MID samples is presented by Willis et al (2004) and Valtchanov et al (2004) respectively. The optical properties of the cluster galaxies (luminosity function and colour distribution) are discussed by Andreon et al (2004).
The optical spectra of the measured X-ray AGNs showed a plethora of properties. The most distant X-ray source measured so far has a redshift of 3.3 (Fig. 12). The AGN sample is currently under analysis.
7. First NIR imaging campaign
In November 2002, we carried out an initial, exploratory observing run with SOFI on the NTT, in order to search for DISTANT clusters selected from candidates in the first set of available
XMM data. The details will be presented by Andreon et al (2005). Here we note that by selecting faint, extended X-ray sources associated with either blank fields in the CFHT data, or with fields showing a hint of clustering at faint (I > 22) magnitude levels in the same data, we were successful at reliably detecting such clusters. Moreover, the X-ray fluxes of these objects are such that if they were placed at higher redshifts they would still be detectable in the XMM-LSS exposures. Thus the survey will enable us to map the cluster distribution to redshifts well above z = 1. An example is shown in Fig. 13 and 14.
8. Conclusion and prospects 8.1. The newly discovered clusters
Following the completion of the AO-1 period, the main outcome of the XMM-LSS project can be summarised as follows : XMM observations of only 10 ks, coupled with a similar time spent on imaging at CFHT or CTIO, can detect a significant fraction of the cluster population out to z ∼ 1 (a flux of 0.8 × 10⁻¹⁴ erg cm−2s−1 corresponds to a cluster mass of 6.7 × 10¹³M
⊙ [T = 2.7 keV] at
z = 1, assuming typical scaling laws). Moreover, adding two hours of FORS2 spectroscopic time provides a reliable estimate of cluster velocity dispersion at z = 0.85. This represents a substantial increase in efficiency compared to former high-z cluster searches.
For the first time we are detecting the numerous population of low luminosity (mass) objects out to z ∼ 0.5; this will allow a dense mapping of the matter distribution. So far (within ∼ 4 deg2,
including the GT area), no massive object has been detected and, following a detailed inspection of the optical images, no giant arcs have been found in the identified clusters. These results are consistent with the Press-Schechter formalism (folded with the current favoured cosmological model) predicting 2.8 and 0.0001 cluster per deg2 between 0 < z < 1 for clusters more massive than 1014M⊙and 1015M⊙respectively, if we assume that only massive clusters are potential strong
lenses. Of course, an additional necessary condition is the steepness of the mass profile.
Immediate foreseen improvements are the following: in the next version of the X-ray pipeline, the source flux detection limit will be significantly lowered. This requires further work on the background estimation. In parallel, extensive simulations are being performed to improve the characterisation (extent and flux) of the faintest sources as well as to determine the survey selection function. This is complicated by the necessity of taking proper account of the Poisson nature of the data and the fact that the signal to be analysed comes from 3 different detectors.
8.2. Cluster identification refinements
In a second step, we shall systematically investigate overlaps and differences between the optical cluster catalogues and the X-ray extended source catalogue. There are two main reasons
why variations should be observed: (i) faint groups or distant clusters may not be unambiguously detected as extended sources because of their low flux or, alternatively, because they host a cooling flow, which makes them appear unresolved. Currently, we are confident that any regular object having a typical core radius of the order of 125 h−1
100 kpc and producing a net number of pn counts
of ≥ 70 is detected by the pipeline as an extended source (Valtchanov et al 2001); (ii) there are intrinsic differences between the X-ray and optical catalogues since the methods used to construct them rely on specific assumptions as to galaxy colour and evolution, or on the properties of the IGM at high redshift. Understanding the discrepancies will not only increase the efficiency of our cluster finding procedure, but also shed light on the much debated topic of cluster formation and evolution. This will also contribute to the improvement of our photometric redshift determination procedure. Finally, output from the weak lensing analysis will reveal large mass concentrations, optimally within the 0.1 < z < 0.5 range. Again, the comparison between the X-ray and optical catalogues will be most instructive. Given the current understanding of structure formation, it is difficult to devise a physical process that would prevent gas being trapped or heated within large concentrations of dark matter. However, the surveyed volume is ideally suited to systematically search for “dark clump”.
8.3. Active galactic Nuclei
Due to the primary goal of the spectroscopic observations performed so far (confirmation and redshift determination of X-ray selected galaxy clusters), few AGN/QSO candidates could be ob-served. For this reason, a spectroscopic survey of a unique sample of X-ray selected AGN/QSOs within a large contiguous area of some 10 deg2, typically complete down to F
[2−10]keV ∼10−14erg cm−2s−1,
F[0.5−2]keV ∼5×10⁻¹⁵erg cm−2 s−1and IAB= 22.5 is foreseen. Because of the large surface density
of AGN/QSO candidates detected in the XMM-LSS field (typically > 200 deg−2 with 0 < z < 1),
compared to previous surveys, it should be more sensitive to contrasts between voids and peaks than previous surveys, such as 2dF. This will enable us to study with high precision the correlation function of these objects over scales in the [2-400] Mpc range, to probe the environmental influence on various type of AGN, and to compare these correlations with those for normal galaxies. The distinct redshift distributions of X-ray selected type I and type II AGN can be accurately deter-mined, and this will provide interesting constraints on models of black hole formation compared with models of star formation. The proposed studies will provide a comparison of the clustering properties, as a function of redshift, of X-ray, optical (2dF) or radio selected AGN/QSO.
8.4. Survey products
A dedicated mysql database with a Java front end interface is available via a site at IASF Milano15 with a mirror at ESO Santiago. This includes the X-ray source catalogue, and complete catalogues of surveys performed by the LSS Consortium in other wavebands, together with selected subsets from the surveys performed by other Consortia made available under agreement. It also gives access to a selection of data products. The database, currently accessible and used internally by the Consortium, will be gradually opened to the public. The first public release, based on the AO-1 pointings (X-ray source lists and available identifications) is foreseen by the end of 2004.
XMM is an ESA science mission with instruments and contributions directly funded by ESA Member States and NASA. SDS was supported by a post-doctoral position from the Centre National d’Etudes Spatiales. MP and IV are grateful to the ESO/Santiago Office for Science, for a 2 week stay in October 2002, where the analysis of the VLT data presented here was initiated; they would like to thank G. Marconi, for his support at the VLT. Thanks also to G. Boese and R. Gruber at MPE, for enlightening discussions about the RASS PSF
REFERENCES
Adami C., Mazure A., Katgert P., Biviano A., 1998, A&A 336, 63
Andreon S., Willis J., Quintana H., Valtchanov I., Pierre M., Pacaud F., 2004 MNRAS, 353, 368 Andreon et al 2005 in preparation
Arnaud, M. & Evrard, A., 1999, MNRAS, 305, 631
Baldi A., Molendi S., Comastri A., Fiore F., Matt G., Vignali C., 2002, ApJ, 564, 190 Bertin M., Arnouts S., 1996, A&AS, 117, 393
B¨ohringer, H., Voges, W., Huchra, J. P., McLean, B., Giacconi, R., Rosati, P., Burg, R., Mader, J., Schuecker, P., Simi¸c, D., Komossa, S., Reiprich, T. H., Retzlaff, J., Tr¨umper, J., 2000, ApJS, 129, 435
B¨ohringer H., Schuecker P., Guzzo L., Collins C. A., Voges W., Schindler S., Neumann D. M., Cruddace R. G., De Grandi S., Chincarini G., Edge A. C., MacGillivray H. T., Shaver P., 2001,A& A 369, 826
Bolzonella, M., Miralles, J.-M. & Pell´o, R. 2000, A&A 363, 476
15
Browne I. W., Mao S., Wilkinson P. N., Kus A. J., Marecki A., Birkinshaw M., 2000, SPIE 4015, 299
Bruzual, G. & Charlot, S. 1993, ApJ 405, 538 Castander, F. J., et al. 1995, Nature, 281, 59
Cohen A. , Rttgering H.J.A, Kassim N.E., Cotton W.D., Perley R.A., Wilman R., Best P., Pierre M., Birkinshaw M., Bremer M., Zanichelli M. , 2003, ApJ. 591, 640 et al 2003,
Collins, C. A., Burke, D. J., Romer, A. K., Sharples, R. M.,Nichol, R. C., 1997, ApJ, 479, L117 de Grandi, S., B¨ohringer, H., Guzzo, L., Molendi, S., Chincarini, G., Collins, C., Cruddace, R.,
Neumann, D., Schindler, S., Schuecker, P., Voges, W., 1999, ApJ, 514, 148
Donahue, M., Mack, J., Scharf, C., Lee, P., Postman, M., Rosati, P., Dickinson, M., Voit, G. M., Stocke, J. T., 2001, ApJ, 552, L93
Ebeling, H., Edge, A. C., Henry, J.P 2001, ApJ, 553, 668
Ebeling, H., Edge, A. C., Allen, S. W., Crawford, C. S., Fabian, A. C., Huchra, J. P., 2000, MNRAS, 318, 333
Ebeling, H., Mullis, C. R., Tully, R. B., 2002 ApJ, 580, 774
Gioia, I. M.; Henry, J. P.; Maccacaro, T.; Morris, S. L.; Stocke,J. T.; Wolter, A., 1990, ApJ Let 356, L35-L38
Gladders M.D., Yee H.K., 2000, AJ 120, 2148
Haiman Z., Mohr J. J., Holder G. P., 2001, ApJ, 553, 545
Henry J. P., Gioia I.M., Mullis C.R., Voges W., Briel U.G.,B¨ohringer H., 2001, ApJ Let 553, L109 Hu W., 2003, astroph/0301416
Jones, L. R., Scharf, C., Ebeling, H., Perlman, E., Wegner, G.,Malkan, M., Horner, D. 1998, ApJ, 495, 100
Landy S.D. et al., 1996, ApJ 456, L1
Le Fevre, O., Mellier, Y., McCracken, H.J., Foucaud, S., Gwyn, S., Radovich, M., Dantel-Fort, M., Bertin, E., Moreau, C.,Cuillandre, Pierre, M., J.C., Le Brun, V., Mazure, A., Tresse, L., 2004, A&A 417, 839
Liang H., 2001, astro-ph/0110518
Lo K. Y., Chiueh T., Liang H., Ma C. P., Martin R., Ng K.-W., Pen U. L., Subramanyan R., 2000, IAU Symp 201, 31
Lonsdale C. et al 2003, PASP 115, 89
Lobo C., Iovino A., Lazzati D., Chincarini G., 2000, A&A 360, 896 Moretti A., Campana S., Lazzati D., Tagliaferri G., 2003, Apj 588, 656 Pacaud et al, 2005 A&A, in preparation
Panzera, M. R., Campana, S., Covino, S., Lazzati, D., Mignani, R.P., Moretti, A., Tagliaferri, G. 2003, A&A, 399, 351
Perlman, E. S., Horner, D. J., Jones, L. R., Scharf, C., Ebeling, H., Wegner, G., Malkan, M., 2002, ApJS, 140, 265
Peterson J.R., Kahn S.M., Paerels F.B.S., Kaastra J.S., Tamura T., Bleeker J.A.M., Ferrigno C., Jernigan J.G., 2003, ApJ, 590, 207
Press, W.H., & Schechter, P., 1974, ApJ, 187, 425 Refregier A., Valtchanov I., Pierre M., 2002, A&A 390, 1
Romer, A. K., Nichol, R. C., Holden, B. P., Ulmer, M. P., Pildis,R. A., Merrelli, A. J., Adami, C., Burke, D. J., Collins, C. A., Metevier, A. J., Kron, R. G., Commons, K. 2000, ApJS, 126, 206
Romer, A. K., Viana, P. T. P., Liddle, A. R.; Mann, R. G., 2001, ApJ, 547, 594 Rosati P., della Ceca R., Norman C., Giacconi R., 1998, ApJ Let492, 21L Rosati P., Borgani S., Norman C., 2002, ARA&A 40, 539
Starck J.-L., Pierre M., 1998, A&A 128, 397
Valtchanov I., Pierre M., Gastaud R., 2001 A&A 370, 689
Valtchanov I., Pierre M., Willis J., Dos Santos S., Jones L., Andreon S., Adami C., Altieri B., Bolzonella M., Bremer M., Duc P.-A., Gosset E., Jean C., Surdej J., 2004, A&A 423, 75 Vikhlinin, A., McNamara, B. R., Forman, W., Jones, C., Quintana,H., Hornstrup, A. 1998a, ApJ,
502, 558
Willis J. et al 2004, MNRAS submitted
Xu C.K., Lonsdale C. J., Shupe D. L., Franceschini A., Martin C., Schiminovich D., 2003, ApJ 587, 90
Fig. 1.— Overview of existing X-ray cluster surveys as a function of area and flux. The area plotted is the maximum area of each survey; the flux plotted is the flux at which the survey area is half the maximum. The light filled circles indicate surveys covering contiguous area, while the blue circles represent serendipitous surveys; the stars show the position of the survey presented in this paper, the XMM-LSS survey (current stage and the foreseen final coverage). References: MACS (Ebeling et al 2001), RASS1-BS (de Grandi et al 1999), REFLEX/NORAS (B¨ohringer et al 2000), (B¨ohringer et al 2001) , EMSS (Gioia et al 1990), , BMW (Panzera et al 2003), Bright SHARC (Romer et al 2000), 160deg2 (Vikhlinin et al 1998), NEP (Henry et al. 2001), WARPS (Perlman et al 2002), RDCS (Rosati et al 1998), RIXOS (Castander et al 1995), SHARC-S (Collins et al 1997), ROX (Donahue et al 2001). Other cluster surveys are CIZA (Ebeling et al 2002), XCS (Romer et al 2001) (relevant information not available). For eBCS (Ebeling et al 2000), the shape of the flux/area curve was assumed to be similar to that of REFLEX ).
Fig. 2.— Large white square indicating the location of the XMM-LSS survey is overlaid on a map of NH (1.4 1020 < NH(cm−2) < 3.5 1020 for the XMM-LSS field). The survey area surrounds
two deep XMM surveys based on guaranteed time: the XMM SSC/Subaru Deep Survey (80 ks exposures in 1 deg2) and the XMM Medium Deep Survey (XMDS; 20 ks exposures in 2 deg2) also corresponding to the VIRMOS-DESCART Deep Survey[deep], the latter being a collaboration between several instrumental teams: XMM-OM (Li`ege), XMM-EPIC (IASF-MILANO),XMM-SSC (Saclay); CFHTLS (Saclay, IAP); VIRMOS (LAM, IASF-MILANO,OAB). Also indicated are the positions of the associated DESCART-VIRMOS Deep Survey [wide], the SWIRE SPITZER Legacy Survey, the Galex survey and the NOAO deep survey (Sec. 3); the 8.75 deg2 UKIDSS survey is centered on the Subaru Deep Survey and the CTIO R-z’ imaging covers a region corresponding to the VVDS [wide] and [deep] surveys.(Note that the center of the whole XMM-LSS survey has been shifted by 2 degrees southward from its initial position because of the presence of the variable type M7 star Mira Ceti (02 19 20.8-02 58 39) which can reach I=1, and cause difficulties with optical mapping.)
Fig. 3.— First view of the deep X-ray sky on large scales. Image obtained combining the first 15 XMM-LSS fields mosaiced in true X-ray colours: red [0.3-1.0] keV, green [1.0-2.5] keV, blue [2.5-10.0] keV. The circles indicate the sources found in the RASS; the brightest one being a star, HD14938. The other source, apparently not present in our XMM data, is from the RASS Faint Source Catalogue with only 7 counts, and thus probably a spurious detection. The displayed region covers 1.6 deg2. This is the first time that such an X-ray depth has been achieved over
such an area. The improvement with respect to the RASS is striking, with a source density of the order of ∼ 300 deg−2 in the [0.5-2] keV band. The wealth of sources includes supersoft and very
hard sources, as well as sources with a wide range of intrinsic extents, giving an indication of the scientific potential of the XMM-LSS survey.
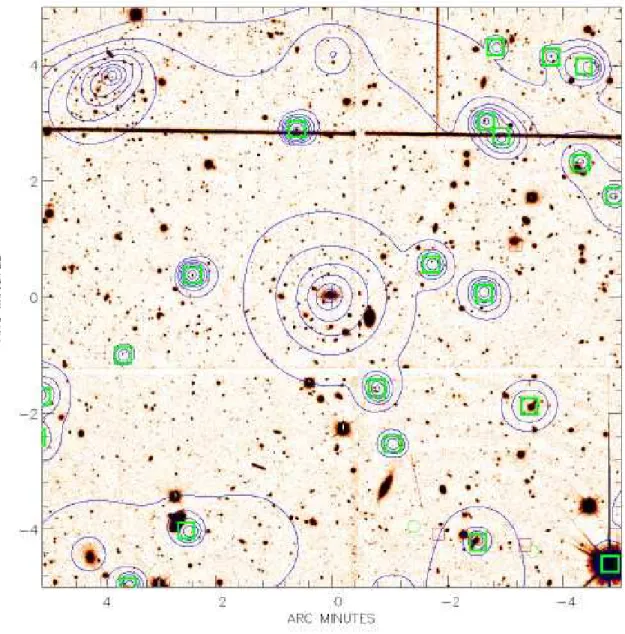
Fig. 4.— This image (10′×
10′
) provides an overview of the source types encountered in the survey and of the identification procedure. Overlaid on a 1h exposure CFH12KI-band image (processed by Terapix) are blue XMM flux contours in [0.5-2] keV, obtained by the MR1 multi-scale wavelet filter-ing algorithm; the procedure allows the automatic recognition of pointlike sources (green squares); the significance of the lowest wavelet contour is 10−4 (equivalent to 3.7σ for Gaussian noise, cf
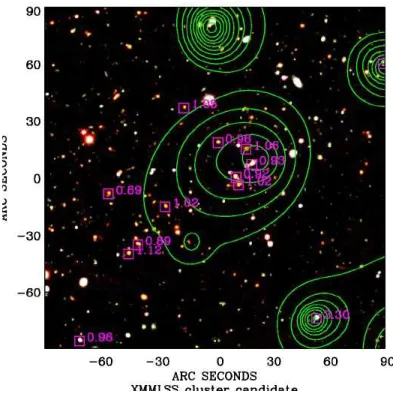
Starck & Pierre (1998)). The image is centred on a bright extended X-ray source, corresponding to an obvious nearby cluster (a NEAR candidate) for which we measured a redshift of 0.33. An-other - much more distant - cluster is apparent in the upper left corner (a MID candidate); this object was found to have a redshift of 0.84. Top middle, another extended source without a clear optical counterpart, typically a DISTANT candidate. The density of pointlike sources is high, some of them having an obvious optical counterpart, others, none. The red squares and green circles indicate VLA NVSS and 325 MHz radio sources respectively. In the lower right corner, there is a conspicuous double lobe radio galaxy, which is also an X-ray source.
Fig. 5.— Left: Cumulative log N-log S distribution, in the [0.5-2] keV band, for the sources per-taining to the first 25 XMM-LSS pointings (off-axis < 10 ′, N
counts > 20 and detection likelihood
> 20). The dashed line is the analytical fit of the deep log N-log S distribution, by Moretti et al (2003), the dotted line the determination by Baldi et al (2002) for the HELLAS2 survey. Right: Corresponding sky coverage for point sources shows that 90% of the area is covered with a sensi-tivity better than 5 × 10⁻¹⁵ erg cm−2 s−1. On-going pipeline developments, coupled with extensive
Fig. 6.— The figure shows an XMM source detected as extended with only ∼ 50 net counts in the [0.5-2] keV combined image of the 3 detectors. The overlay on the optical image confirms the presence of a distant cluster (z ∼ 0.8 − 0.9), and even reveals X-ray structure associated with 2 distinct groups of galaxies. The sources actually lies at an off-axis angle of 11.5′
. The collected photons correspond to an emitted flux of ∼ 1.2 × 10⁻¹⁴ or ∼ 4 × 10⁻¹⁵ erg cm−2 s−1, for a source
falling at an off-axis distance of 11′
or on-axis respectively, assuming a typical thermal cluster spectrum.
Fig. 7.— Photometric redshift determination around the position of an X-ray cluster candidate (see text). Top: the photometric redshift distribution of the region where the overdensity has been detected (solid line), compared to the reference redshift distribution, obtained from the total catalogue (dotted line). The redshift distributions have been normalised to the respective number of objects. To select the significant overdensities, we plot the Poissonian error bars of the small region N (zphot). Bottom: combined photometric redshift probability as a function of redshift of
galaxies selected within an aperture of radius 1′
whose position within the field maximises the probability of the redshift “peak”. Individual galaxy probabilities are determined from the chi-squared statistic returned from the photometric redshift template fitting procedure. VLT/FORS2 observations showed that this X-ray source indeed corresponds to a structure at z ∼ 0.9 − 1. See Fig. 8
Fig. 8.— The most distant X-ray complex identified so far, showing a clear concentration of galaxies in the 0.9 < z < 1 range (Green X-ray contours overlaid on a CFH12K VRI composite). Bottom right is the most distant X-ray QSO currently measured in the XMM-LSS at a redshift z = 3.3 (see Fig. 12); its isophotes are distorted by the immediate vicinity of an X-ray bright emission line galaxy located at z = 0.054.
Fig. 9.— One of the most distant cluster galaxy measured, at a redshift of z = 1.02 (see Fig. 8). This good quality spectrum was obtained in 1.5h with the R600RI+19 grism on the VLT/FORS2 instrument. The object has magnitudes of V=24.19, R=23.34, I=22.21 and displays characteristics of an elliptical galaxy having a component of young stars (E+A type).
Fig. 10.— Redshift distribution of the 21 spectroscopically confirmed clusters and compact groups during the 2002 Magellan/LDSS and VLT/FORS2 runs.
Fig. 11.— The locus of the XMM-LSS clusters. Clusters observed during the first 2002 spectroscopic campaign are indicated as large filled green circles, while dots indicate all clusters in the literature having X-ray observations (BAX: http://bax.ast.obs-mip.fr/). The curved lower edge of the shaded region indicates the expected XMM-LSS ultimate cluster completeness limit (∼ 8×10⁻¹⁵erg/s/cm2
in [0.5-2] keV), whereas the upper limit is merely to guide the eye (maximum luminosity at which at least one cluster is expected within the full 64 deg2 area, according to ΛCDM model). Although the 2002 exploratory campaign was not intended to be flux limited, the figure well enlightens the tendency of the XMM-LSS to identify significantly lower luminosity (i.e. lower mass) systems than the previous cluster surveys. Luminosity is expressed in the [0.1-2.4] keV band
Fig. 12.— Most distant X-ray AGN detected so far, at a redshift of z = 3.3 (see Fig. 8); grey bands indicate the position of strong atmospheric lines.
Fig. 13.— Extended X-ray source with a very faint optical counterpart in the I-band. The NIR image of the field is shown in Fig. 14.
Fig. 14.— J-K colour image of the DISTANT cluster candidate flagged in Fig. 13. This presents a significant overdensity of red objects. The brightest cluster member has Ks∼ 17.5 ± 0.3, and the other objects within 20′′
are generally fainter than Ks ∼ 18.5. These properties are consistent with a cluster at z = 1 or above.

![Fig. 3.— First view of the deep X-ray sky on large scales. Image obtained combining the first 15 XMM-LSS fields mosaiced in true X-ray colours: red [0.3-1.0] keV, green [1.0-2.5] keV, blue [2.5-10.0] keV](https://thumb-eu.123doks.com/thumbv2/123doknet/5441350.127939/26.918.73.852.259.731/scales-image-obtained-combining-fields-mosaiced-colours-green.webp)
![Fig. 5.— Left: Cumulative log N-log S distribution, in the [0.5-2] keV band, for the sources per- per-taining to the first 25 XMM-LSS pointings (off-axis < 10 ′ , N counts > 20 and detection likelihood](https://thumb-eu.123doks.com/thumbv2/123doknet/5441350.127939/28.918.173.738.302.732/cumulative-distribution-sources-taining-pointings-counts-detection-likelihood.webp)
![Fig. 6.— The figure shows an XMM source detected as extended with only ∼ 50 net counts in the [0.5-2] keV combined image of the 3 detectors](https://thumb-eu.123doks.com/thumbv2/123doknet/5441350.127939/29.918.295.599.393.695/figure-shows-source-detected-extended-counts-combined-detectors.webp)