HAL Id: inserm-01683559
https://www.hal.inserm.fr/inserm-01683559
Submitted on 14 Jan 2018
HAL is a multi-disciplinary open access
archive for the deposit and dissemination of
sci-entific research documents, whether they are
pub-lished or not. The documents may come from
teaching and research institutions in France or
abroad, or from public or private research centers.
L’archive ouverte pluridisciplinaire HAL, est
destinée au dépôt et à la diffusion de documents
scientifiques de niveau recherche, publiés ou non,
émanant des établissements d’enseignement et de
recherche français ou étrangers, des laboratoires
publics ou privés.
Sara El Kennani, Annie Adrait, Olga Permiakova, Anne-Marie Hesse, Côme
Ialy-Radio, Myriam Ferro, Virginie Brun, Julie Cocquet, Jérôme Govin,
Delphine Pflieger
To cite this version:
Sara El Kennani, Annie Adrait, Olga Permiakova, Anne-Marie Hesse, Côme Ialy-Radio, et al..
System-atic quantitative analysis of H2A and H2B variants by targeted proteomics. Epigenetics & Chromatin,
BioMed Central, 2018, 11 (1), pp.2. �10.1186/s13072-017-0172-y�. �inserm-01683559�
METHODOLOGY
Systematic quantitative analysis of H2A
and H2B variants by targeted proteomics
Sara El Kennani
1, Annie Adrait
1, Olga Permiakova
1, Anne‑Marie Hesse
1, Côme Ialy‑Radio
2, Myriam Ferro
1,
Virginie Brun
1, Julie Cocquet
2, Jérôme Govin
1*and Delphine Pflieger
1,3*Abstract
Background: Histones organize DNA into chromatin through a variety of processes. Among them, a vast diversity of
histone variants can be incorporated into chromatin and finely modulate its organization and functionality. Classically, the study of histone variants has largely relied on antibody‑based assays. However, antibodies have a limited effi‑ ciency to discriminate between highly similar histone variants.
Results: In this study, we established a mass spectrometry‑based analysis to address this challenge. We developed a
targeted proteomics method, using selected reaction monitoring or parallel reaction monitoring, to quantify a maxi‑ mum number of histone variants in a single multiplexed assay, even when histones are present in a crude extract. This strategy was developed on H2A and H2B variants, using 55 peptides corresponding to 25 different histone sequences, among which a few differ by a single amino acid. The methodology was then applied to mouse testis extracts in which almost all histone variants are expressed. It confirmed the abundance profiles of several testis‑specific histones during successive stages of spermatogenesis and the existence of predicted H2A.L.1 isoforms. This methodology was also used to explore the over‑expression pattern of H2A.L.1 isoforms in a mouse model of male infertility.
Conclusions: Our results demonstrate that targeted proteomics is a powerful method to quantify highly similar his‑
tone variants and isoforms. The developed method can be easily transposed to the study of human histone variants, whose abundance can be deregulated in various diseases.
Keywords: Histone variants, Chromatin, Proteomics, Targeted proteomics, SRM, PRM, Spermatogenesis
© The Author(s) 2018. This article is distributed under the terms of the Creative Commons Attribution 4.0 International License (http://creativecommons.org/licenses/by/4.0/), which permits unrestricted use, distribution, and reproduction in any medium, provided you give appropriate credit to the original author(s) and the source, provide a link to the Creative Commons license, and indicate if changes were made. The Creative Commons Public Domain Dedication waiver (http://creativecommons.org/ publicdomain/zero/1.0/) applies to the data made available in this article, unless otherwise stated.
Background
The basic unit of chromatin is the nucleosome, an octamer of four core histones, H2A, H2B, H3, and H4. The assembly of eight histone molecules into a nucleo-some is mediated by the histone fold, a central globular domain, to form a core particle around which 147 base pairs of DNA wrap [1].
The tight control of nucleosomal organization is criti-cal for many cellular processes, such as the regulation of transcription, DNA replication, and DNA repair [2, 3]. A vast diversity of regulatory mechanisms are involved in these nuclear processes, such as DNA methylation, his-tone modifications, and chromatin remodeling by protein complexes and noncoding regulatory RNAs [4–7]. The
existence of histone variants adds a level of complexity to these mechanisms. Indeed, 83 histone variants (including splicing isoforms) have been identified in mouse for his-tones H2A, H2B, and H3 that largely expand the diversity of nucleosomal actors involved in chromatin signaling pathways [8].
Antibodies are routinely used to explore the functional roles of histone variants. Many of them are now com-mercially available and widely utilized by research groups for the quantification and visualization of histones by classical biochemical approaches, such as western blots, immunofluorescence, and immunoprecipitation. These bio-reagents have notably the advantage of being highly sensitive when combined with secondary detection methodologies. They thus allowed monitoring the abun-dance of histone variants in several cellular or pathologi-cal contexts [9–14].
Open Access
*Correspondence: [email protected]; [email protected]
1 INSERM U1038, CEA, BIG‑BGE, Univ. Grenoble Alpes, Grenoble, France
However, antibody-based techniques show limitations regarding specificity and throughput. For instance, H2A histone variants exhibit extremely high-sequence simi-larity that can go beyond 90% for H2A.L.1 variants or canonical H2A and H2A.X histones. In addition, histones are notoriously decorated by a multitude of post-transla-tional modifications (PTMs), which further complicates the generation of antibodies [15]. Finally, lot-to-lot vari-ations of antibodies can result in a lack of reproducibility [16, 17].
Mass spectrometry (MS) has now become a power-ful analytical strategy to qualitatively and quantitatively study proteins and their PTMs. Different MS-based approaches have been implemented to characterize histones, by analyzing polypeptides of different sizes: bottom-up analysis of smaller peptides [18–22], middle-down analysis of larger peptides, typically spanning the about 50 N-terminal residues of H3 or H4 [21, 23], and top-down analysis of intact proteins [22, 24–27]. Dis-covery proteomics aims at identifying and quantifying a maximum number of proteins in a biological sample. In a bottom-up approach, proteins extracted from biologi-cal samples are processed into peptides, usually with the protease trypsin which cleaves peptidic bonds after the basic amino acids lysine and arginine. The resulting pep-tides are then separated by liquid chromatography (LC) before their on-line analysis by the mass spectrometer. Following measurement of their accurate mass-to-charge (m/z) ratios, peptides are fragmented to obtain amino acid sequence information. In a discovery-based prot-eomics approach, the peptides giving rise to the most intense signals in MS are automatically selected for frag-mentation by MS/MS. The acquired MS/MS spectra are finally matched to theoretical fragment spectra to deter-mine the most likely peptide sequences. Such approaches are very powerful to characterize complex samples. Yet, in spite of the increased sensitivity and dynamic range of recent mass spectrometry instruments, lower abundance proteins may still be hidden by the major protein compo-nents in the sample.
Targeted MS analyses have emerged as an alternative analytical scheme to quantify a predefined set of pro-teins of interest in a complex protein matrix [28, 29]. The objective of such analyses compares to the use of anti-bodies against a few proteins of biological interest, yet with the advantages of higher selectivity and straightfor-ward multiplexing. Targeted proteomics by selected reac-tion monitoring (SRM) consists of selectively recording proteolytic (usually tryptic) peptide sequences that are unique to the proteins of interest. The quantification of such peptides specific of a protein sequence thus informs on the abundance of that protein. SRM originally uses a triple quadrupole mass spectrometer (QQQ), which
is able to select, fragment, and quantify the ions corre-sponding to the peptides of interest (Fig. 1). Briefly, the first quadrupole (Q1) allows selecting the m/z ratio cor-responding to a desired peptide. The latter ions then enter a second quadrupole (Q2) in which they get frag-mented. Finally, some predefined fragment ions are selected in the third quadrupole (Q3) to be detected. The m/z ratios of the fragments associated with the m/z of the original peptide are called transitions. Recording of the transitions for a given peptide throughout its chro-matographic elution peak informs on its abundance in the sample, and by extrapolation, on the amount of the corresponding protein. Isotopically 13C/15N-labeled
syn-thetic peptides are commonly added to the initial protein sample or proteolytic peptide mixture to ascertain proper recording of the endogenous peptide transitions [30, 31]. Another targeted MS approach, named parallel reaction monitoring (PRM), has been developed more recently. It relies on MS instruments generally used in discovery analyses (e.g., Q-Exactive instruments). Instead of only recording a selection of peptide-fragment transitions, this method allows acquiring on each targeted peptide a complete MS/MS spectrum with high-resolution and mass accuracy on fragment ions [32, 33], which allows better discriminating fragments of the targeted peptides from possible contaminants.
In the context of histone characterization, SRM analy-ses have been successfully used to investigate their PTMs. Zhang et al. evaluated the level of histone H3 acetylation in human brain tissue with advanced Alzheimer’s disease as compared to neurological controls [34]. Darwanto et al. successfully developed an SRM method to quan-tify low-abundance histone modifications [35]. This work notably focused on the correlation between H3K120 ubiquitination and H3K79 methylation. Recently, a study proposed a targeted mass spectrometry approach to quantify histones H3 and H2B for a clinical application in patients affected by a critical bacteriaemic septic shock [36]. Finally, PRM was used to monitor modifications on human and mouse H3 and H4 and identified new meth-ylation and acetmeth-ylation sites [37, 38].
In this report, we developed SRM- and PRM-based methods to quantify a maximum number of H2A and H2B variants in a multiplexed assay. Our goal was to be able to identify and quantify more reliably histone variants from a crude histone extract (around 1500 pro-teins) than discovery analyses would allow doing. A list of histone variants we recently published was explored to select histone isoforms amenable to a targeted prot-eomic analysis [8]. Tryptic peptides were identified that are specific for each of the selected histone variants, and extensive LC–MS/MS analysis confirmed that these “sig-nature peptides” bear no PTM or were modified at very
low levels. The SRM and PRM methods were successfully implemented and used to analyze the abundance of H2A and H2B histone variants during sperm differentiation in mouse. This choice was motivated by the fact that almost all known histone variants are expressed during spermat-ogenesis. The implementation of the method confirmed the expression profiles of many testis-specific histones and demonstrated the existence of a predicted H2A.L.1 isoform. Finally, we established by PRM the over-expres-sion pattern of H2A.L.1 isoforms in spermatids of a mouse model of male infertility.
Results
Theoretical histone peptides relevant for a targeted proteomic analysis
The difficulty to perform a functional analysis of histone variants with traditional biochemical approaches comes from their strong sequence homology that exceeds 90% for many of them (Fig. 2). We hypothesized that targeted proteomics could represent an interesting alternative to the use of antibodies in order to obtain specific detection
and precise quantification of histone variants. Such MS analyses require selecting peptides specific of each his-tone variant that can be successfully analyzed by MS. Since histones are well known to be highly decorated by a multitude of PTMs, finding non-modified (or minimally modified) sequences specific of each variant was a par-ticularly challenging task.
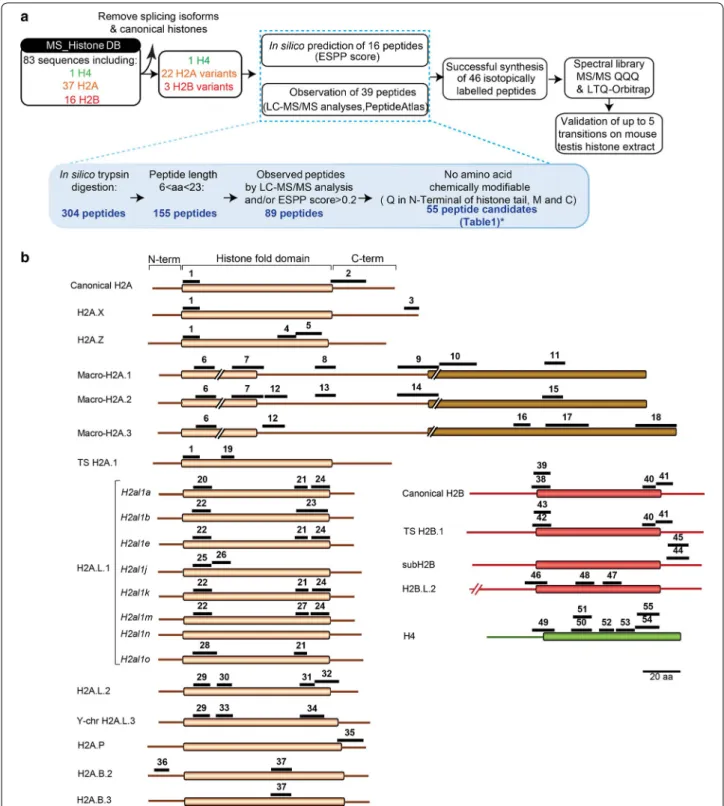
We referred to MS_HistoneDB, a comprehensive and non-redundant list of 83 mouse histone variants recently published by our group to determine the pro-tein sequences of interest [8]. We chose to digest protein samples with trypsin, the most classically used protease in proteomics: Trypsin indeed provides highly reproduc-ible proteolysis and generates peptides ending with the basic Lys/Arg residues which are favorable for ionization and MS/MS fragmentation [40]. The in silico digestion of the 83 mouse histone sequences with trypsin pro-duced a list of 304 theoretical peptides. From this list we selected peptides more likely to be successfully identi-fied by MS by considering the following criteria (Fig. 3a). First, peptide length had to be comprised between 6 and
Fig. 1 Principles of discovery and targeted proteomics approaches. Major steps of discovery and targeted mass spectrometry analyses are sche‑
matized. Discovery proteomics (top panel) characterizes the global composition of a protein sample. With the quadrupole‑orbitrap technology, peptide ions within a small window of mass‑to‑charge (m/z) ratio are isolated in the first quadrupole (Q1) and then fragmented in a collision cell; all ion fragments are finally monitored in the orbitrap analyzer. The processing of resulting MS/MS spectra allows identifying the proteins initially present in the samples (not shown). Targeted proteomics (bottom panel) precisely quantifies a predefined set of proteins. The SRM methodology first selects peptide ions representative of the proteins of interest in the first quadrupole (Q1); they are fragmented in the second quadrupole (Q2); finally, predefined representative ion fragments (F1, F2 and F3) are recorded in the last quadrupole (Q3). The reconstitution of each peptide elution profile, named SRM trace, allows for the integration and quantification of its abundance. The PRM methodology is similar to the SRM pipeline but the last quantification step is not restricted to a predefined set of fragment ions and can consider all of them, recorded in the Orbitrap analyzer
23 amino acids, which reduced the list to 155 peptides. The fact that histones are rich in K/R residues, leading to very small peptides in some protein regions, accounted for this significant peptide list reduction. Second, their detectability potential using MS was estimated using the ESP Prediction tool [41] that calculates an ESPP score for each peptide sequence. Based on published recom-mendations and our LC–MS/MS discovery analyses of histones from mouse testes, a score threshold was set to 0.2 [41]. This led to 89 remaining peptides. Finally, by using the software Skyline fed with MS_HistoneDB, each peptide was confirmed to be unique for its histone entry among the mouse proteome, or shared by a small group of histone variants/isoforms [28, 29]. The list of peptides preselected for targeted MS analysis was compared to experimental data available in public databases, notably PeptideAtlas [42]. Next, the presence of modifications on the signature peptides was carefully examined, because a significant stoichiometry would bias the quantifica-tion of the histone variants which the peptides represent. Chemical modifications possibly occurring in vitro were also considered: sample preparation (in-gel digestion) and LC–MS/MS analysis classically use low pH solutions.
Peptides containing methionine residues, prone to oxida-tion, or with an N-terminal glutamine, readily converted into pyroglutamate under acidic conditions, were then excluded when possible, in agreement with formerly pub-lished guidelines on SRM assay development [43].
The six H3 variants have nearly identical sequences with very minor variations. Selecting specific tryptic pep-tides that met the above-listed criteria was therefore not feasible (Additional file 1) [28]. Indeed, five peptides spe-cific of a single variant were obtained by in silico diges-tion, one and four covering the canonical histone H3.1 and cenH3, respectively. However, two peptides may be subject to a pyroglutamylation in acidic conditions (Additional file 1, peptides A and B), while three oth-ers are preceded by several R/K neighboring residues, which renders trypsin cleavage site uncertain (Additional file 1, peptides C, D and E, see further comments on this issue below); peptides D and E also contain more than 30 amino acids (Additional file 1). We then decided to focus our targeted analyses on H2A and H2B variants.
Among the 55 theoretical peptides allowing the analy-sis of 22 H2A, 3 H2B variants and histone H4, 31 pep-tides met all the above-listed requirements for SRM
Fig. 2 Sequence similarities between H2A, H2B and H3 histone variants. The similarity between H2A, H2B, and H3 variants is displayed in orange,
red, and blue, respectively. Sequences were aligned with Clustal Omega tools available on the EMBL‑EBI Website [39]. The size of plotted disks is proportional to the percentage of similarity between histone variants
Fig. 3 Signature peptides used to quantify H2A and H2B variants by targeted proteomics. a Strategy used to select the signature peptides and
validate their compatibility with targeted proteomic analysis. The sequences of 22 H2A and 3 H2B variants were obtained from our recently pub‑ lished list of mouse histone variants (MS_histone_DB, [8]). In silico digestion of these sequences produced a theoretical list of peptides, which were ranked according to their computed ESPP score, predictive of their compatibility with MS analysis [41]. Fifty‑five peptides were selected and further analyzed to monitor the potential presence of post‑translational modifications, which could interfere with their analysis by targeted proteomics. This analysis excluded seven of them (see Table 1). Then, heavy standard peptides, 13C,15N‑labeled, were synthesized and analyzed on different MS instruments (LTQ‑Orbitrap Velos, QTRAP 5500) to acquire full MS/MS spectra and create spectral libraries. They were used to select up to five more intense SRM transitions for each peptide. b Selected signature peptides presented on their corresponding histone variants. They are presented as black bars and numbered according to Table 1. Histone fold domains, also called globular domains, are presented as a rectangle for each histone, surrounded by N‑ and C‑terminal tails. H2A (orange), H2B (red), H4 (green)
analyses (Additional file 2). They could notably differ-entiate between highly similar isoforms of histone vari-ants. Peptides P20 and P22 thus differ by one amino acid only, while peptides P20 and P25 exhibit an inversion of two amino acids and can discriminate between H2A.L.1 isoforms (Fig. 3b and Table 1). Such selectivity can be achieved by peptide-based targeted proteomics and is very unlikely to be apprehended by traditional biochemi-cal approaches, nor by proteomics top-down or middle-down analyses.
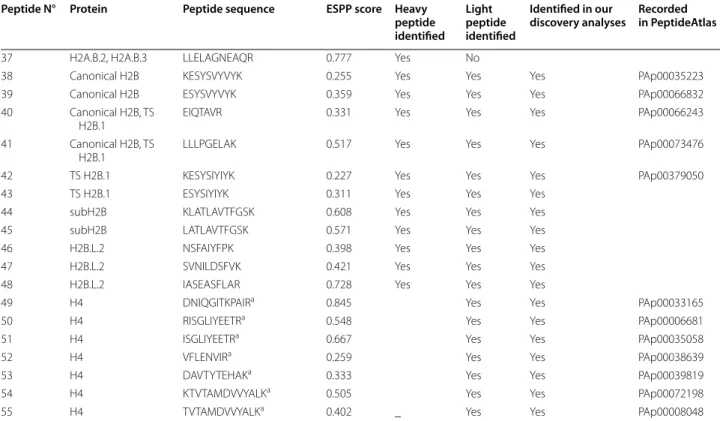
As no H4 variant has been described in mouse, this histone is particularly adapted for inter-sample normali-zation. Peptide ISALVYEETR from yeast histone H4 cor-responding to the sequence ISGLIYEETR (P51) in mouse has already been successfully used to normalize total histone abundance by SRM [44]. Since we also identified the latter sequence with a missed cleavage by LC–MS/ MS analysis, we additionally considered the sequence RISGLIYEETR (P50). Finally, a third peptide, P52, was also recorded to quantify H4 abundance (Table 1, Fig. 3). Peptides P53–P55 were originally further included in the SRM methodology to start with a large enough set of candidate peptides, but were finally not considered for H4 quantification, due to weak signal or excessive vari-ability of quantitative measurements for P53–55.
Trypsin missed cleavages in signature peptides
The list of 55 selected peptides contains five pairs of sequences differing by one missed cleavage, such as (K) ESYSIYIYK for TS H2B.1 (peptides P38–39), and also the peptide pairs P42–43, P44–45, P50–51, and P54–55. For histone H4, we monitored P50–52 to normalize the amounts of H2A and H2B histone variants, as described above. We observed that quite stable relative proportions of the fully and non-fully cleaved peptide versions were produced across histone samples obtained by classical acid-based extraction from spermatocytes, round sper-matids and elongating/condensing spersper-matids when the protein samples were digested in parallel (Fig. 4). The case of RISGLIYEETR (P50) and ISGLIYEETR (P51) for H4 is shown in Additional file 3. Besides, we observed that 21 out of the 55 selected peptides had further neighbor-ing Lys/Arg residues on the N- or C-terminal side which could lead to peptides with one or several missed cleav-ages. Peptide ASQASQEY from H2A.X is thus preceded by two Lys residues. Such peptides are usually excluded from targeted proteomic analyses because the fractions of peptides with and without non-cleaved K/R residues may vary between independent sample preparations, which would impact protein quantification. However, the limited number of options to quantify some histone variants (e.g., H2A.X, H2A.L.1, and H2A.B) forced us to consider such peptides. The variably cleaved forms were
systematically monitored by targeted analysis, and barely any or no signal was measurable for the peptides with missed cleavages, probably because we always performed our in-gel digestion protocol with an excess of protease.
To conclude, a list of 55 theoretical signature peptides was established to detect and quantify 100% of H2A and H2B histone variants. It also included peptides of H4 to be used for normalization. Most of them (71%, 39 peptides) were experimentally detected while 29% (16 peptides) were only predicted by an in silico analysis (Table 1).
Signature peptides are devoid of post‑translational modifications
Histones are proteins particularly challenging to follow by SRM to get protein abundances, since they are decorated with a wealth of dynamic PTMs [45]. Histones have two structurally distinct features: a globular domain that is responsible for the formation of core nucleosomal particles and unstructured tails protruding from this core particle. The histone globular domains play an important structural role in the assembly of nucleosomes and bear fewer modi-fications than the N- or C-terminal tails [46]. For this rea-son, signature peptides were preferentially chosen within the histone globular domains (Fig. 3b). Nonetheless, the absence of PTMs at significant stoichiometry on the sig-nature peptides was experimentally confirmed, by discov-ery analysis of gel-separated histone samples. Mouse testis tissue was chosen as a source of histones to be analyzed. It showed the advantage of providing abundant quantities of histones at different stages of spermatogenesis, which facilitated the development of this methodology. In addi-tion, different publications have documented the presence of many histone variants in this tissue, including many testis-specific ones [14]. Finally, many histone modifica-tions have been described during spermatogenesis [47,
48]. Using such a tissue to confirm that PTMs are not sig-nificantly present on the selected signature peptides, thus strongly supports the relevance of these peptides in other biological contexts. Histones were purified from different stages of sperm differentiation, with meiotic spermato-cytes and post-meiotic round and elongating/condensing spermatids. PTMs (acetylation, mono- and dimethyla-tions, phosphorylations) were extensively searched in the signature peptides by discovery LC–MS/MS analysis of histone samples extracted from testis and migrated on a gel. Modifications were identified on 5 out of the 55 pep-tides listed in Table 1 (Fig. 4a). The modified forms were quantified by integrating the area under the chromato-graphic peaks of the modified and non-modified peptide versions within the LC–MS/MS analyses. They never rep-resented more than 2% of the total quantity of the peptide detected (Fig. 4b). We then concluded that the presence of
Table 1 H2A, H2B and H4 signature peptides
Peptide N° Protein Peptide sequence ESPP score Heavy
peptide identified Light peptide identified Identified in our
discovery analyses Recorded in PeptideAtlas
1 Canonical H2A, H2A.J, H2A.X, H2AZ.1, H2AZ.2, TS H2A.1
AGLQFPVGR 0.739 Yes Yes Yes PAp00032266
2 Canonical H2A, H2A.J,
TS H2A.1 VTIAQGGVLPNIQAVLLPK
a 0.224 Yes Yes PAp00008634
3 H2A.X ASQASQEY 0.278 No No Yes PAp00852754
4 H2AZ.1, H2AZ.2 GDEELDSLIK 0.519 Yes Yes Yes PAp00067999
5 H2AZ.1, H2AZ.2 ATIAGGGVIPHIHK 0.522 Yes Yes Yes PAp00032640
6 Macro‑H2A.1, Macro‑
H2A.2, Macro‑H2A.3 AGVIFPVGR 0.575 Yes Yes Yes PAp00413759 7 Macro‑H2A.1, Macro‑
H2A.2 HILLAVANDEELNQLLK 0.222 Yes Yes Yes PAp00069466
8 Macro‑H2A.1 LEAIITPPPAK 0.713 Yes Yes Yes PAp00429995
9 Macro‑H2A.1 AASADSTTEGTPTDGFT‑
VLSTK 0.517 Yes Yes No PAp00380945
10 Macro‑H2A.1 NGPLEVAGAAISAGHGLPAK 0.723 Yes Yes Yes PAp00389241
11 Macro‑H2A.1 SIAFPSIGSGR 0.796 Yes Yes Yes PAp00077504
12 Macro‑H2A.2, Macro‑
H2A.3 GVTIASGGVLPR 0.866 Yes Yes Yes PAp00519811
13 Macro‑H2A.2 SETILSPPPEK 0.580 Yes No Yes
14 Macro‑H2A.2 EGTSNSTSEDGPGDGFTILSSK 0.499 No No Yes
15 Macro‑H2A.2 SVAFPPFPSGR 0.578 Yes Yes Yes
16 Macro‑H2A.3 NCLSAAEIR 0.726 Yes No No
17 Macro‑H2A.3 SPVAETASPGRPGDPQGHLG‑
SLR 0.664 Yes No No
18 Macro‑H2A.3 AGDGQTGHQVALS‑
GSGGEGGSA 0.504 No No No
19 TS H2A.1 QGNYAQR 0.089 Yes No No
20 H2A.L.1‑H2al1a GELPFSLVDR 0.821 Yes Yes Yes
21 H2A.L.1‑H2al1a, H2al1e, H2al1k, H2al1o IAPEDVR 0.299 No No 22 H2A.L.1‑H2al1b, H2al1e, H2al1k, H2al1m, H2al1n
GELPLSLVDR 0.814 Yes Yes Yes
23 H2A.L.1‑H2al1b IAPEDVHLVVQNNEQLR 0.301 Yes No Yes 24 H2A.L.1‑H2al1a,
H2al1e, H2al1k, H2al1m
LVVQNNEQLR 0.596 Yes Yes Yes
25 H2A.L.1‑H2al1j GEFPLSLVDR 0.821 Yes No
26 H2A.L.1‑H2al1j FLPEGNHSGR 0.445 Yes No
27 H2A.L.1‑H2al1m VTPEDVR 0.216 Yes No
28 H2A.L.1‑H2al1o GELPLSLVDHFLR 0.262 Yes No 29 H2A.L.2, Y‑Chr
H2A.L.3 AELQFPVSR 0.844 Yes Yes Yes
30 H2A.L.2 FLREGNYSR 0.289 No No
31 H2A.L.2 IAPEHVCR 0.438 Yes No Yes
32 H2A.L.2 VVQNNEQLHQLFKa 0.322 Yes Yes
33 Y‑Chr H2A.L.3 FLGEGIYSR 0.433 Yes No
34 Y‑Chr H2A.L.3 IAPEHVCQVVQNK 0.464 Yes No
35 H2A.P NAPFSLFDEMPGPR 0.673 Yes No
PTMs on the signature peptides was unlikely to interfere significantly with the quantification of the corresponding proteins.
Development of an SRM assay to quantify histone variants
The 55 peptides of interest were synthesized in a heavy-isotope-labeled version with incorporation of
13C/15N atoms into the C-terminal Arg or Lys
resi-dues. We later call them “standards.” Unfortunately, P2 and P32 could not be synthesized but the natural sequences were still recorded in the follow-up analy-ses. The heavy peptides were mixed and analyzed by discovery analysis on a Qtrap instrument. Whole frag-mentation spectra were acquired, from which higher-intensity fragment ions were selected to establish peptide–fragment transitions [28]. For each peptide of interest, 3–5 highly responding fragment ion can-didates were selected [28]. Most histone variants were represented by a single peptide, and the analyzed sam-ples were relatively complex with ~ 1000 to 1500 pro-teins identified per exploratory LC–MS/MS analysis. Selecting 3–5 transitions per peptide limited the risk of quantification failing due to the contamination by another peptide of close m/z ratio that would produce
overlapping transitions. Of note, 25 signature peptides of H2A variants contain one or several proline resi-dues that are detrimental to fragmentation in continu-ous y-type ion series. Indeed, y-type ions ending with the Pro residue(s) are highly stabilized during MS/MS fragmentation. In such cases, it happened that only fewer than five transitions could be selected. Yet the Pro-ending y-type ions of characteristic higher inten-sity constituted excellent transitions.
The detectability and signal specificity of endogenous peptides was next tested by spiking the mixture of labeled peptides in a tryptic digest of histones extracted from mouse testes. The perfect co-elution of endogenous pep-tides with their synthetic counterparts and the similarity of the fragmentation patterns were confirmed.
Finally, 550 transitions were monitored by LC-SRM analysis (Additional file 4). Forty-one out of 46 standard peptides had symmetrical and narrow chromatographic elution profiles, with intensities at least five times higher than the background signal, while P3, P14, P18, P21, and P30 were not successfully identified by LC-SRM analy-sis, probably due to weak ionization efficiency. Despite a high amount of P19 standard (for TS H2A.1) spiked in the sample (estimated to be at about 119 pmol/μL, see
The carbamidomethylated or oxidized forms of peptides containing cysteine or methionine residues, respectively, were also monitored. “Yes” indicates that peptides were successfully detected by LC-SRM or LC–MS/MS analysis and “No” indicates they failed to be
a Peptides monitored only in their endogenous form
Table 1 continued
Peptide N° Protein Peptide sequence ESPP score Heavy
peptide identified Light peptide identified Identified in our
discovery analyses Recorded in PeptideAtlas
37 H2A.B.2, H2A.B.3 LLELAGNEAQR 0.777 Yes No
38 Canonical H2B KESYSVYVYK 0.255 Yes Yes Yes PAp00035223
39 Canonical H2B ESYSVYVYK 0.359 Yes Yes Yes PAp00066832
40 Canonical H2B, TS
H2B.1 EIQTAVR 0.331 Yes Yes Yes PAp00066243
41 Canonical H2B, TS
H2B.1 LLLPGELAK 0.517 Yes Yes Yes PAp00073476
42 TS H2B.1 KESYSIYIYK 0.227 Yes Yes Yes PAp00379050
43 TS H2B.1 ESYSIYIYK 0.311 Yes Yes Yes
44 subH2B KLATLAVTFGSK 0.608 Yes Yes Yes
45 subH2B LATLAVTFGSK 0.571 Yes Yes Yes
46 H2B.L.2 NSFAIYFPK 0.398 Yes Yes Yes
47 H2B.L.2 SVNILDSFVK 0.421 Yes Yes Yes
48 H2B.L.2 IASEASFLAR 0.728 Yes Yes Yes
49 H4 DNIQGITKPAIRa 0.845 Yes Yes PAp00033165
50 H4 RISGLIYEETRa 0.548 Yes Yes PAp00006681
51 H4 ISGLIYEETRa 0.667 Yes Yes PAp00035058
52 H4 VFLENVIRa 0.259 Yes Yes PAp00038639
53 H4 DAVTYTEHAKa 0.333 Yes Yes PAp00039819
54 H4 KTVTAMDVVYALKa 0.505 Yes Yes PAp00072198
Additional file 5), the intensity of the SRM trace remained weak. The possible pyroglutamylation in the N-terminal glutamine of the endogenous peptide sequence and its weak ESPP score could explain this result (Table 1). Of note, four of the five poorly detected peptides above were not recorded in PeptideAtlas.
Performance of the SRM assay
The analytical performances of the SRM method were evaluated by stable isotope dilution (SID) over a 100-fold dilution range [31]. For this purpose, increasing quanti-ties of heavy standard peptides were added in a constant quantity of testis histone extract. Figure 5a shows repre-sentative response curves of signature peptides, in which standard-to-endogenous ratios are plotted against their theoretical dilution factor. Excellent linear responses were observed for all peptides (R2 > 0.96, Fig. 5a,
Additional file 6). The median CV for technical replicates was under 30% for 75% of the peptides, which is correct when the objective is to perform relative quantification.
The former dilution series was well suited to test whether the method allowed detecting abundance vari-ations of a few histone variants in a globally constant complex sample. However, samples can be highly variable when studying a biological system. This is the case for histones extracted from cells at different stages of sper-matogenesis. In this example, the variability is due to the chromatin dynamics throughout sperm differentiation, in particular, the progressive replacement of histones by transition proteins and protamines during this process (for review see [50, 51]). In the present context of study and in others consisting of comparing significantly dif-ferent histone samples, it was necessary to also test the response linearity by varying the amount of endogenous
Fig. 4 Signature peptides are mostly devoid of post‑translational modifications. a Numbers of H2A, H2B and H4 peptides used in the targeted
proteomic analysis that were identified to be fully non‑modified or modified to some extent by discovery LC–MS/MS analyses. b Abundance of modified versus non‑modified forms of the signature peptides of H2B, TS H2B.1 and H4. Analyses were performed on spermatocytes (Sc), round spermatids (R), elongating and condensing spermatids (EC)
material and following the corresponding peptide sig-nals while keeping the standard peptides constant. Then, a constant quantity of standard peptide was added in an increasing amount of histone testis extract (Fig. 5b). The monitored abundances correlated very well with the dilu-tion factors (R2 > 0.96), even though the highly variable
matrix could have been expected to significantly impact the ionization efficiency of the peptides of interest (Addi-tional file 6).
Quantifying histone variants during mouse spermatogenesis
The validated SRM methodology was implemented to investigate the abundance of H2A and H2B variants dur-ing mouse spermatogenesis (Fig. 6a).
H2A histone variants The two isoforms of H2A.Z,
H2A.Z.1, and H2A.Z.2, are highly similar and differ by only three amino acids [52]. Two tryptic peptides shared by both H2A.Z isoforms could be quantified during
Fig. 5 Evaluation of the linearity of SRM quantification. a The SRM quantification is linear, using an increasing quantity of each isotopically labeled
signature peptide spiked in a constant amount of protein matrix (acid‑extracted histones from mouse testis). Please refer to the “Methods” section for experimental details. Data were normalized as described in Ref. [49]. b Similar results were obtained when a constant quantity of isotopically labeled signature peptide was spiked in an increasing amount of protein matrix (acid‑extracted histones from mouse testis)
spermatogenesis. When considering the average of sig-nals detected on P4 and P5, we found that the amount of H2A.Z was globally constant through spermatogen-esis (Fig. 6). Greaves et al. assessed the relative amount of this variant during spermatogenesis by indirect fluo-rescence generated by affinity-purified H2A.Z antibodies [53]. They observed a moderate increase in H2A.Z pro-tein (by a factor of about 1.5) in round spermatids com-pared to pachytene spermatocytes. Such an abundance ratio is often not distinguishable from 1 in proteomics measurements.
Two macro-H2A genes were identified in mammals,
H2AFY and H2AFY2, that encode macro-H2A.1 and
macro-H2A.2 isoforms, respectively. MacroH2A is largely expressed in mouse testis [54] and mainly asso-ciated with transcriptionally inactive domains [55, 56]. MacroH2A.1 is more expressed during the early pachy-tene stage of spermatogenesis, where it is associated with sex vesicles containing sequestered X- and Y-chro-mosomes [57]. Even though we did not analyze histones from this stage, targeted analysis of peptide P11 specific of Macro-H2A.1 showed decrease by a factor of 2 toward the end of spermatogenesis [57]. Finally, the abundance of peptide P6, shared by Macro-H2A.1/2/3, seemed to be constant through spermatogenesis (Fig. 6).
H2A.X would have been quantifiable by one peptide only, namely P3 (Table 1). Yet this peptide could not be detected, probably due to poor ionization efficiency, as predicted from its low ESPP score (0.278).
H2A.L.1 variant, also called H2A.Lap.2, is encoded by the genes H2al1a, H2al1c, H2al1d, H2al1f, H2al1g,
H2al1h, and H2al1i. The sequence of H2A.L.1 and
H2A.L.2 are very close, with 72% of sequence iden-tity. This explains why, to the best of our knowledge, no H2A.L.1- or H2A.L.2-specific antibody has yet been described [14, 58, 59]. Both H2A.L.1 and H2A.L.2 vari-ants are strongly enriched in elongating and condens-ing spermatids, and a recent study demonstrated that H2A.L.2 variant participates in the final spermatic chromatin organization [58]. The direct contribution of H2A.L.1 is still unclear and which H2A.L.1 isoforms are expressed at the protein level remains to be charac-terized. In the present study, peptide P20, specific of the H2A.L.1 isoform encoded by H2al1a gene, was quanti-fied by SRM and its abundance through the three sper-matogenesis stages appeared in complete agreement with its published expression profile [14, 56]. Seven other putative H2A.L.1 isoforms, that would differ by a few amino acids, have been inferred by homology or only identified at the transcript level [8]. Peptide P22 is shared by the H2A.L.1 isoforms encoded by H2al1b, H2al1e,
H2al1k, H2al1m, and H2al1n genes (see P20 vs. P22
peptides indicated in Table 1). Interestingly, its detec-tion by MS confirmed the existence of the protein prod-uct of at least one of these genes. Thus, it accumulates in the last stage of sperm differentiation, similarly to the
H2al1a-encoded protein (Fig. 6).
H2B histone variants. In mice, TS H2B.1 is highly
expressed in testis and participates in the establishment of a sperm-specific chromatin structure [14, 58, 60]. Its abundance was estimated with peptides P42 and P43 and was observed to be constant over the three stages of spermatogenesis analyzed. Similarly to previous studies, although present in whole testis extracts, H2B.L.2 was not detected in germ cells [14]. This result correlates with the fact that H2B.L.2 mRNA was detected at a very low level in meiotic, as well as post-meiotic, germ cells [14].
Altogether, our SRM methodology confirmed that about 70% of H2A and H2B variants can be quantified in a single multiplexed assay, with results confirming abundance profiles previously published using antibod-ies [14, 58–60]. The most prominent discovery brought by our analyses is the identification, for the first time at the protein level, of a new isoform of H2A.L.1. This iso-form dramatically increases in abundance in the course of spermatogenesis, mirroring the variations of the originally studied variant H2A.L.1. This information could only be obtained by the discriminative power of proteomics that can distinguish sequences differing by one single residue.
Quantification of histone variants in a mouse model of male infertility
The established methodology was then tested on a mouse model of male infertility. The transcription regulator SLY is encoded by the Y-chromosome and is expressed only in spermatids where it controls the expression of hundreds of sex chromosome-encoded genes, including several histone variants [61, 62]. This gene was knocked down by a transgenic approach of shRNA in the mouse (Sly-KD males) resulting in defects in sperm differentia-tion with abnormal chromatin compacdifferentia-tion and increased sperm DNA damage [63, 64]. At the transcript level, many X- and Y-chromosome-encoded genes are upreg-ulated in Sly-KD round spermatids; among them are the spermatid-specific genes H2afb3 and H2al1, which encode histone variants H2A.B.3 and H2A.L.1, respec-tively. Autosomal genes encoding H2A variants (such as
H2al2) were not found deregulated [64]. It was not pos-sible to confirm upregulation of H2A.L.1 at the protein level because anti-H2A.L.2 antibody cross-reacts with H2A.L.2. We therefore sought to apply our methodology to quantify histone variants in Sly-KD round spermatids. For this application, the SRM methodology was adapted to a PRM approach to gain sensitivity (Additional file 7).
Using PRM also improved the detection of peptide P23, specific for the H2A.L.1 isoform encoded by H2al1b, which was hardly detectable by LC-SRM.
PRM analyses also identified another H2A.L.1 iso-form and showed that all H2A.L.1 isoiso-forms are indeed
over-expressed in Sly-KD compared to WT round sper-matids (Fig. 7) [64]. Discovery LC–MS/MS analyses confirmed that no PTM was detectable on the signature peptides used for this quantification, so that peptide abundances truly reflected histone variant abundances
Fig. 6 SRM‑based quantification of H2A and H2B variants during mouse spermatogenesis a Experimental design. Spermatogenic cell fractions
were analyzed [meiotic spermatocytes (Sc); round spermatids (R); elongating and condensing spermatids (EC)]. Histones were extracted with sulfu‑ ric acid, digested by trypsin and analyzed by LC‑SRM. b LC‑SRM quantification of the abundance of histone variants during spermatogenesis. Data were normalized to H4 levels as described in the “Methods” section and in Additional file 3. Two independent biological replicates are presented for each protein (replicate 1 and replicate 2) and were analyzed in technical triplicates. c Heat maps representing the abundance of H2A and H2B variants during spermatogenesis
(Additional file 8). Even though H2A.B.3 is upregulated at the mRNA level in Sly-KD round spermatids [64], its specific peptide P37 could not be quantified by PRM. As the standard peptide ionized well and could be detected by SRM, the very low abundance of its endogenous coun-terpart probably explains its non-detection).
Discussion
In this study, we developed a targeted proteomics approach to quantify a maximum of histone variants in a single assay. In-depth analysis of the sequences of all mouse histone variants defined a set of signature pep-tides for 100% of H2A and H2B histone variants. They can be produced using trypsin and standard proteomics sample preparation. These peptides were experimentally validated: They could be detected on standard mass spec-trometers and are mostly devoid of PTMs. They were used within an SRM methodology to quantify histone variants during sperm differentiation, demonstrating for the first time the dramatic abundant increase in the pro-tein paralogs of H2A.L.1 encoded by genes H2al1a and by genes H2al1b, H2al1e, H2al1k, H2al1m, and H2al1n
in condensing/elongating spermatids. It is worth add-ing that our targeted proteomic approaches led to the identification of a yet undescribed H2A.L.1 isoform (encoded by H2al1b). Furthermore, the SRM methodol-ogy was transposed to the PRM technolmethodol-ogy, which suc-cessfully showed that testis-specific histone variants, including H2A.L.1 isoforms, are deregulated in a mouse model of male infertility. This observation is important for the pathophysiology of the SLY-KD mouse model: The increased amount of H2A.L.1 in spermatids could indeed contribute to the sperm chromatin remodeling defects and associated male infertility observed in these males [64]. H2A.L.1 is highly similar to H2A.L.2 in terms of sequence and pattern of expression. Since H2A.L.2 knockout has been shown to lead to defective sperm chromatin reorganization [58], the respective contribu-tion of H2A.L.1 isoforms and H2A.L.2 remains to be studied.
The sequence similarity between histone sequences makes it challenging to differentiate canonical histones and their variants at the protein level via antibody-based techniques. The development of MS methods now allows researchers to specifically characterize histones and their PTMs using traditional discovery proteomics. Few studies were interested in providing an analytical tool to monitor simultaneously histone variants with high speci-ficity. A top-down approach was developed to investigate histone variants, although this strategy presents multiple drawbacks including weak sensitivity, difficulties in data interpretation and thus quantification, compared to other MS strategies [65]. Moreover, a top-down approach will likely fail to distinguish two histone variants differing by minor sequence variation from a same variant harbor-ing different PTM combinations. Given that limitation, we decided to develop for the first time a targeted pro-teomics method enabling to quantify in a single analy-sis multiple histone variants. We applied the method to investigate variants in the course of spermatogenesis, where many histone variants are expressed dynamically.
The choice of peptides to be followed by SRM requires several considerations including uniqueness, size, detect-ability, the absence of PTMs or missed cleavage sites [28,
29]. We recently developed two exhaustive and non-redundant protein databases, named MS_HistoneDB, as resources for the proteomic study of mouse and human histones [8]. This resource has been used to identify in silico the peptides which are likely detectable by mass spectrometry and present an interest for the quantifica-tion of histone variants by targeted proteomics. However, when studying histones, it is complicated to comply with all the rules established for targeted analyses, because these proteins are enriched in lysine and arginine resi-dues and thus subject to a wealth of PTMs and to trypsin
Fig. 7 Quantification of the abundance of H2A.L.1 isoforms in Sly‑KD
mice. The relative abundance of H2A and H2B variants was quantified by PRM in round spermatids from WT and Sly‑KD mice. Two inde‑ pendent biological replicates are presented (top and bottom panels). H2A.L.2 and Y‑ChrH2A.L.2 are expected to be expressed at similar lev‑ els between Sly‑KD and WT spermatids [64] and peptide P29, shared by both variants, was used to normalize the abundance of peptides specific to H2A.L and subH2B (H2B.L.1) variants. The abundance of the other histone variants was normalized to H4 (P50–52). For more details, please refer to the “Methods” section
missed cleavages. Despite this challenge, we were able to select 55 peptides (Fig. 3). Transitions were selected to identify the best quantifiable ions to evaluate the abun-dance of histone variants. The validation of the selected transitions was aided by the addition of isotopically labeled peptides.
The SRM methodology was applied to a tryptic digest of histones extracted from mouse testis using up to six signature peptides per protein or small group of iso-forms. The method was effective in detecting five H2A variants in addition to H2A.L.1 isoforms and all H2B variants in the whole testis despite the complexity of the sample, estimated to be around 1000–1500 proteins by discovery analysis. Compared to traditional western blot analysis, the developed SRM assay is extremely time-effective, as it allows in a 1-h analysis to follow several H2A and H2B variants while simultaneously following H4 for normalization.
The developed SRM assay was converted into a PRM assay. This acquisition mode is more time-effective because it does not require selecting transitions to be followed, but records a whole MS/MS spectrum. Moreo-ver, the use of an MS instrument from the latest genera-tion (Q-Exactive) provided better sensitivity that allowed identification of a variant not detected by SRM on a Qtrap instrument, namely H2A.L.1 (encoded by gene
H2al1b). The differences between PRM and SRM have
been recently investigated, using model isotope-labeled peptides and tryptic digests of yeast proteins [32]. Both methods exhibited the same linearity, but PRM per-formed better with a higher resolution and selectivity on the peptides of interest [66, 67].
Trypsin has been shown to be the most effective protease compared to others [68]. The use of another enzyme such as Glu-C or ArgC, of comparable speci-ficity level and digestion efficacy, would likely help cover additional specific peptides and thus more H2A and H2B histones, particularly H2A.X and testis-spe-cific variants TS H2A.1 and H2A.B. It may also allow addressing the case of H3 variants. Finally, a newer-generation instrument with increased sensitivity would probably allow detecting in lower amounts of spe-cific germ cells additional variants such as H2A.B.3 and H2B.L.2 to assess their abundance variation in the course of spermatogenesis.
Conclusions
The developed assay is a valuable analytical method to monitor 22 H2A and 3 H2B variants. Our method ena-bled the comparative quantification of histone variants in spermatocytes, round spermatids and elongating/ condensing spermatids. Because histones have been very well conserved from mouse to human, this method can
be easily transposed to target human histone variants in a range of applications, including cancers, in which sev-eral variants have already been found to be deregulated [69–71].
Methods
Analysis of histone variant sequences
The sequences of mouse histones and their variants were obtained from our recently published MS_histoneDB [8]. Putative variants and splicing variants were excluded from the analysis to limit its complexity, and 22 H2A, 3 H2B, and 6 H3 variants were considered (listed in Table 1). Canonical forms of core histones were included in the analysis. Multiple sequence alignments of the selected histones were performed using Clustal Omega on the EMBL-EBI Web site [39], from which the percent-age of similarity between sequences was downloaded and processed with R-Studio to create the plots displayed in Fig. 2.
Histone extraction from mouse testes and digestion for their MS analysis
Histones were extracted as previously described [14]. Suspensions of whole testis cells were obtained from mice older than 2 months. Enriched fractions of spermat-ocytes, round spermatids, and elongated spermatids were obtained as described previously [62, 72].
The purification of histones was obtained by resus-pending washed cell pellets in 0.2 M sulfuric acid. The solution was sonicated to shear DNA and was placed on ice for 30 min. Non-soluble proteins were pelleted by 15-min centrifugation at 20,000g. The supernatant with solubilized histones was collected and proteins were precipitated with Trichloroacetic acid (TCA) 20% v/v. After 90-min incubation on ice, proteins were pelleted by 15-min centrifugation at 16,000g. They were then washed with acidified acetone (HCl 0.1%) and then with pure acetone. Pellets were air-dried at room temperature and resuspended in 1× protein loading buffer. The quality of the purification was then analyzed by Coomassie-stained SDS–PAGE gels.
For targeted proteomic analyses, histones were only migrated over about 5 mm in the stacking region of the gel, before reduction, alkylation of Cys residues with iodoacetamide and trypsin digestion, as described previ-ously [73]. For the in-depth search for PTMs on signature peptides, histone samples were fully migrated, seven gel slices corresponding to histones were cut, individually digested and analyzed by discovery LC–MS/MS using an UltiMate 3000 system coupled to a Q-Exactive HF instru-ment (Thermo Fisher Scientific): The lower complexity of the resulting samples indeed allowed more exhaustive characterization of the modified peptides.
Analysis of standard peptides to build a spectral library for SRM analysis
Forty-six synthetic peptides of “crude quality” with a C-terminal [13C,15N]- labeled lysine, arginine, alanine,
or tyrosine were purchased from Thermo Fisher Scien-tific. They were pooled at an estimated concentration of 0.029–321 pmol/μL (Additional file 6), due to differ-ences in ionization efficiency. By spiking the labeled pep-tides at these concentrations in histone samples extracted from mouse testis, their signal intensity was close to the endogenous peptides. The labeled peptide mixture was subjected to LC–MS/MS analyses on a C18 column (PepMap C18, 100 Å porosity, 3 μm particles, 25 cm length × 75 μm inner diameter) coupled to a QTRAP 5500 or an LTQ-Orbitrap Velos system to constitute a spectral library. Peptides were separated at a flow rate of 300 nL/min with a gradient starting with solvent A = acetonitrile/formic acid/water (2/0.1/97.9, v/v/v), then developing 0–40% of solvent B = acetonitrile/for-mic acid/water (80/0.08/19.92, v/v/v) over 35 min, fol-lowed by 40–90% solvent B over 10 min and maintaining 90% solvent B for 10 min. Based on these LC–MS/MS analyses, transitions were selected and validated for LC-SRM analysis. Quality control samples (cytochrome c, GFP) were analyzed at the beginning and at the end of a series of injections to verify instrument performances.
SRM analyses of histones spiked with standards on the Qtrap instrument
Two biological samples were analyzed in three technical replicates, where technical replicates started at the time of histone loading on an SDS–PAGE gel. SRM measure-ments were performed on a Qtrap mass spectrometer (QTrap 5500, Sciex). For each analysis, the equivalent of about 1/50 of the digested histones extracted from 4 mil-lion spermatocytes, 5 milmil-lion round spermatids, or 10 million condensing/elongating spermatids was analyzed. Tryptic peptides were separated on an analytical column with C18 Pepmap beads (3 μm diameter, 100 Å porosity, 25 cm length × 75 μm inner diameter), at a flow rate of 300 nL/min. Peptides were separated with the same gra-dient as the one described in the section “Peptides
selec-tion and synthesis.” The SRM analyses were performed
with a dwell time of 30 ms, a retention time window of 5 min, and a fixed cycle time of 3 s.
The linearity curves were obtained by preparing, in trip-licate, a dilution series (0.01; 0.03; 0.1; 0.25; 0.5; 0.75; 1) of the labeled peptide mixture or of the biological matrix into a constant amount of mouse testis histone extract or a con-stant amount of labeled peptide mixture, respectively. To each diluted sample, 2 μL of either the set of 46 peptides or biological matrix were spiked to make up to 10 μL total
sample volume. The samples were transferred to injection vials, and 6 μL were injected on the LC-SRM system.
PRM analyses of histones on a Q‑Exactive Instrument
PRM analyses were performed using a Q-Exactive hybrid quadrupole-orbitrap mass spectrometer (Thermo Fisher Scientific). The UltiMate 3000 HPLC system was equipped with a capillary column containing ReproSil-Pur C18-AQ beads (1.9 μm, 25 cm length, 75 μm inner diameter). The acquisition method consisted of acquiring one MS spectrum and 10 PRM spectra. The same LC gra-dient as for LC-SRM analyses was used. For PRM spectra, a target resolution of 60,000, an automatic gain control (AGC) value of 5.5 × 10⁵, and a maximum injection time
of 100 ms were specified. Fragmentation was performed with a normalized collision energy of 27, and MS/MS scans were acquired with a starting mass of m/z 100.
Discovery LC–MS/MS data interpretation
Mass spectrometry RAW files were submitted to Mas-cot Daemon (version 2.5.1). MS/MS data acquired on histones were matched to the mouse MS_HistoneDB [8] and to a list of about 500 contaminants including keratins, trypsin, etc. The following modifications were considered as variable ones: N-terminal protein acety-lation; Lys acetyacety-lation; Lys and Arg mono- and dimeth-ylations, Ser and Thr phosphorylation, Met oxidation. Cys carbamydomethyl was considered as a fixed modi-fication. For RAW files of full MS/MS spectra acquired on the Qtrap and LTQ-Orbitrap Velos instruments, the tolerance on mass measurement was set to 5 ppm for peptides and to 0.8 Da (Qtrap) and 0.6 Da (LTQ-Orbit-rap Velos) for fragment ions. For analysis performed on The Q-Exactive instrument, 5 ppm for peptides and 0.025 Da for fragment ions were considered. For all MS/MS data interpretations using Mascot, the enzyme trypsin was specified, while allowing up to five tryptic missed cleavages.
Selection of SRM transitions from experimental LC–MS/MS data
A spectral library was built in the academic open-source software Skyline [74]. MS/MS data used for that purpose had been obtained on histones extracted from mouse testis and digested by trypsin, as well as from standard peptides, analyzed on Qtrap and LTQ-Orbitrap instru-ments (see analyses conditions described above). We then selected the best responding fragments ranked by intensity. We globally selected y-type fragment ions, and in particular those ending with a Proline residue. In SRM analyses using heavy-isotope-labeled sequences, only y-type ions were used for quantification.
Targeted proteomics data interpretation
The acquired SRM and PRM data were processed using Skyline 2.6. Transitions selected for each peptide in SRM were used as quantifiers (the process of transition selection is presented in Additional file 9). They were manually integrated based on the chromatographic traces extracted by the program, so as to avoid possible co-eluting contaminants. Both for PRM and SRM data, the transition selection was systematically verified and adjusted when necessary to ensure that no co-eluting contaminant distorted quantification. The visual filtering was performed as follows: (1) selection of peaks present-ing an intensity five times higher than the noise signal; (2) verification that near-identical relative intensities were observed for the transitions of the endogenous and of the standard peptides. When these criteria were met by no transition, no quantification values were reported.
Data normalization to be at constant nucleosome amounts in the compared samples
The abundance of peptides at different stages of sper-matogenesis was usually normalized by the sum of H4 peptides (P50–52 in Table 1). However, this normaliza-tion was not adapted when comparing the expression levels of histone variants extracted from round sper-matids of WT or Sly-KD mice. Indeed, the purity of the round spermatids was different in the two biological replicates, even though it was above 84%. The contami-nation by spermatocytes could profoundly impact the histone variant quantification in round spermatids, since spermatocytes contain about four times more chromatin than round spermatids. We then only considered vari-ants that are specifically expressed in spermatids for nor-malization: we used peptide P29 shared by H2A.L.2 and Y-ChrH2A.L.2, whose abundance was not expected to be affected by knocking down sly.
Abbreviations
CID: collision‑induced dissociation; EC: elongating and condensing sperma‑ tids; ESI: electrospray ionization; HPLC: high‑pressure liquid chromatography; MS: mass spectrometry; MS/MS: fragmentation by tandem mass spectrom‑ etry; PRM: parallel reaction monitoring; PTM: post‐translational modification; R: round spermatids; RT: retention time; Sc: spermatocytes; SID: stable isotope dilution; SRM: selected reaction monitoring; QQQ: triple quadrupole; q‑OT: hybrid quadrupole‑orbitrap.
Author details
1 INSERM U1038, CEA, BIG‑BGE, Univ. Grenoble Alpes, Grenoble, France. 2 INSERM U1016, Institut Cochin, CNRS UMR8104, Université Paris Descartes,
Sorbonne Paris Cité, Paris, France. 3 CNRS, FR CNRS 3425, Biosciences and Bio‑
technology Institute of Grenoble, Grenoble, France.
Authors’ contributions
SEK, JG, and DP designed the study; CIR and JC prepared all cells from which histones were extracted; SEK, AMH, and AA acquired SRM and PRM data; SEK, OP, MF, VB, JG, and DP interpreted SRM and PRM data; SEK, JG, JC, and DP wrote the manuscript. All authors read and approved the final manuscript.
Acknowledgements
We thank Yohann Couté, Michel Jaquinod, Benoit Gilquin, Sylvie Jaquinod‑ Kieffer, and Encarna García‑Oliver for their assistance in the design of the study, and Sandrine Miesch‑Fremy for collecting testis samples. We are
Additional files
Additional file 1. Sequence analysis of histone H3 variants. An in silico analysis predicts that only five peptides discriminating H3 variants could be followed by mass spectrometry (these peptides are highlighted in blue boxes). None of them passed the filters used to develop the SRM assay on H2A and H2B variants. For more details, please refer to the section “Theoretical histone peptides relevant for a targeted proteomic analysis” of the "Methods" section.
Additional file 2. Validation criteria for each signature peptide. Peptide number, protein names, peptide sequence, ESP predictor score, and length of peptides are indicated. The criteria detailed in the results sec‑ tions (Theoretical histone peptides relevant for a targeted proteomic analysis and Trypsin missed cleavages in signature peptides) were also reported for each peptide. They include their status as fully tryptic or non‑tryptic (e.g., C‑terminal of the histone variant), if their length is within 6–23 amino acids, if they are not chemically modified, and if the monitored peptides have no neighboring K/R residue.
Additional file 3. Abundance of H4 peptides used for normalization. The nucleosome contains two copies of each histone. No H4 variant has been described in mammals [8], so that H4 was logically chosen to normalize the abundance of H2A and H2B variants between samples. The MS signals for three H4 peptides (P50–52) are presented for the analysis of histones extracted from spermatocytes (Sc), round spermatids (R), and elongating and condensing spermatids (EC). They were brought to the same scale as for spermatocytes to allow easier inter‑peptide signal comparisons. Three technical replicates of LC–MS/MS analyses were analyzed. The relative MS signals measured on peptides P50–P52 are similar in the three cell types.
Additional file 4. Details of the SRM transitions for each signature pep‑ tide. SRM assay parameters including precursor and fragment ion type, charge state, elution time as well as raw data are provided in Suppl. data. (*) Indicates peptides monitored only in their endogenous form.
Additional file 5. Composition of the mixture of standard peptides.
Additional file 6. Reproducibility of the LC‑SRM analysis. R² values are indicated for each technical replicate with increasing matrix amounts or increasing standard peptide amounts. Plotted data are presented in Fig. 5.
Additional file 7. PRM transition results. List of transitions used to quan‑ tify each monitored peptide. Precursor charge, fragment ion, light precur‑ sor m/z ratio, light product m/z ratio, light retention time are indicated.
Additional file 8. Abundances of modified and non‑modified forms of H2B and H4 signature peptides in round spermatids extracted from WT and Sly‑KD mice testis. Two biological replicates are presented.
Additional file 9. Rules used to select or reject peptides using their transition profiles. The validation of the best transitions was performed using a signal‑to‑noise ratio (> 5) and a perfect co‑elution of the heavy standard peptide with the endogenous peptide. Three fragment ions (F1, F2, and F3) are represented for the heavy and the endogenous peptides. a All fragment ions can be integrated because the heavy and endogenous fragment ions co‑elute in the same intensity order. b In that case, only F2 can be integrated because the ratio heavy/endogenous is different for F1 and F3. c The fragment F2 is contaminated by another analyte eluting at a slightly later time; it has to be excluded from the analysis. d Here, the signal‑to‑noise ratio is below five, no fragment ion can be integrated. e. The endogenous peptide traces do not co‑elute with the heavy peptide traces.
grateful to colleagues in EDyP for their informatics support and for technical help on the MS instruments.
Competing interests
The authors declare that they have no competing interests.
Availability of data and materials
The datasets supporting the conclusions of this article are included within the article and its additional files. SRM data have been deposited in PeptideAtlas under the accession number PASS01118 and PRM data under PASS01124. All other MS data have been deposited to the ProteomeXchange Consortium via the PRIDE [75] partner repository with the dataset identifier PXD008358 and
https://doi.org/10.6019/pxd008358.
Consent for publication
Not applicable.
Ethics approval and consent to participate
Animal procedures were subjected to local ethical review (Comite d’Ethique pour l’Experimentation Animale, Universite Paris Descartes; registration num‑ ber CEEA34.JC.114.12).
Funding
This work was supported by CEA by a PhD fellowship to SEK, by the Fond d’Intervention of the Univ. Grenoble Alpes (to JG), the French National Research Agency (ANR‑11‑PDOC‑0011 EpiGam to JG, ANR‑14‑CE19‑0014‑01 to DP, ANR‑12‑JSV2‑0005‑01 to JC, ANR‑10‑INBS‑08 ProFI and ANR‑10‑LABX‑49‑01 GRAL) and the European Union FP7 Marie Curie Action “Career Integration Grant” (304003 to JG).
Publisher’s Note
Springer Nature remains neutral with regard to jurisdictional claims in pub‑ lished maps and institutional affiliations.
Received: 27 October 2017 Accepted: 20 December 2017
References
1. Luger K, Mäder AW, Richmond RK, Sargent DF, Richmond TJ. Crystal structure of the nucleosome core particle at 2.8 A resolution. Nature. 1997;389:251–60.
2. Venkatesh S, Workman JL. Histone exchange, chromatin structure and the regulation of transcription. Nat Rev Mol Cell Biol. 2015;16:178–89. 3. Seeber A, Gasser SM. Chromatin organization and dynamics in double‑
strand break repair. Curr Opin Genet Dev. 2017;43:9–16.
4. Almouzni G, Cedar H. Maintenance of epigenetic information. Cold Spring Harb Perspect Biol. 2016;8:a019372.
5. Böhmdorfer G, Wierzbicki AT. Control of chromatin structure by long noncoding RNA. Trends Cell Biol. 2015;25:623–32.
6. Hota SK, Bruneau BG. ATP‑dependent chromatin remodeling during mammalian development. Development. 2016;143:2882–97. 7. Talbert PB, Henikoff S. Histone variants–ancient wrap artists of the epig‑
enome. Nat Rev Mol Cell Biol. 2010;11:264–75.
8. El Kennani S, Adrait A, Shaytan AK, Khochbin S, Bruley C, Panchenko AR, et al. MS_HistoneDB, a manually curated resource for proteomic analysis of human and mouse histones. Epigenetics Chromatin. 2017;10:1–18.
9. Perez‑Burgos L, Peters AHFM, Opravil S, Kauer M, Mechtler K, Jenuwein T. Generation and characterization of methyl‑lysine histone antibodies. Methods Enzymol. 2004;376:234–54.
10. Turner BM, Fellows G. Specific antibodies reveal ordered and cell‑cycle‑ related use of histone‑H4 acetylation sites in mammalian cells. Eur J Biochem. 1989;179:131–9.
11. Fernandez‑Capetillo O, Mahadevaiah SK, Celeste A, Romanienko PJ, Camerini‑Otero RD, Bonner WM, et al. H2AX is required for chromatin remodeling and inactivation of sex chromosomes in male mouse meio‑ sis. Dev Cell. 2003;4:497–508.
12. Sporn JC, Kustatscher G, Hothorn T, Collado M, Serrano M, Muley T, et al. Histone macroH2A isoforms predict the risk of lung cancer recurrence. Oncogene. 2009;28:3423–8.
13. Sporn JC, Jung B. Differential regulation and predictive potential of Mac‑ roH2A1 isoforms in colon cancer. Am J Pathol. 2012;180:2516–26. 14. Govin J, Escoffier E, Rousseaux S, Kuhn L, Ferro M, Thevenon J, et al. Peri‑
centric heterochromatin reprogramming by new histone variants during mouse spermiogenesis. J Cell Biol. 2007;176:283–94.
15. Fuchs SM, Krajewski K, Baker RW, Miller VL, Strahl BD. Influence of combi‑ natorial histone modifications on antibody and effector protein recogni‑ tion. Curr Biol. 2011;21:53–8.
16. Egelhofer TA, Minoda A, Klugman S, Lee K, Kolasinska‑zwierz P, Aleksey‑ enko AA, et al. An assessment of histone‑modification antibody quality. Nat Struct Mol Biol. 2010;18:91–3.
17. Baker M. Reproducibility crisis: blame it on the antibodies. Nature. 2015;521:274–6.
18. Bonenfant D. Characterization of histone H2A and H2B Variants and their post‑translational modifications by mass spectrometry. Mol Cell Proteom‑ ics. 2005;5:541–52.
19. Plazas‑Mayorca MD, Zee BM, Young NL, Fingerman IM, LeRoy G, Briggs SD, et al. One‑pot shotgun quantitative mass spectrometry characteriza‑ tion of histones. J Proteome Res. 2009;8:5367–74.
20. Olszowy P, Donnelly MR, Lee C, Ciborowski P. Profiling post‑translational modifications of histones in human monocyte‑derived macrophages. Proteome Sci. 2015;13:24.
21. Tvardovskiy A, Wrzesinski K, Sidoli S, Fey SJ, Rogowska‑Wrzesinska A, Jensen ON. Top‑down and middle‑down protein analysis reveals that intact and clipped human histones differ in post‑translational modifica‑ tion patterns. Mol Cell Proteomics. 2015;14:3142–53.
22. Molden RC, Bhanu NV, LeRoy G, Arnaudo AM, Garcia BA. Multi‑faceted quantitative proteomics analysis of histone H2B isoforms and their modi‑ fications. Epigenetics Chromatin. 2015;8:15.
23. Cannon J, Lohnes K, Wynne C, Wang Y, Edwards N, Fenselau C. High‑ throughput middle‑down analysis using an orbitrap. J. Proteome Res. 2010;9:3886–90.
24. Boyne MT, Pesavento JJ, Mizzen CA, Kelleher NL, Boyne MT 2nd, Pesavento JJ, et al. Precise characterization of human histories in the H2A gene family by top down mass spectrometry. J Proteome Res. 2006;5:248–53.
25. Pesavento JJ, Kim Y. Bin, Taylor GK, Kelleher NL. Shotgun annotation of histone modifications: a new approach for streamlined characteriza‑ tion of proteins by top down mass spectrometry. J Am Chem Soc. 2004;126:3386–7.
26. Siuti N, Roth MJ, Mizzen CA, Kelleher NL, Pesavento JJ. Gene‑specific characterization of human histone H2B by electron capture dissociation. J Proteome Res. 2006;5:233–9.
27. Minshull TC, Dickman MJ. Mass spectrometry analysis of histone post translational modifications. Drug Discov Today Dis Model. 2014;12:41–8. 28. Lange V, Picotti P, Domon B, Aebersold R. Selected reaction monitoring
for quantitative proteomics: a tutorial. Mol Syst Biol. 2008;4:222. 29. Picotti P, Aebersold R. Selected reaction monitoring–based proteom‑
ics: workflows, potential, pitfalls and future directions. Nat Methods. 2012;9:555–66.
30. Maccoss MJ, Toth MJ, Matthew E. Evaluation and optimization of ion‑cur‑ rent ratio measurements by selected‑ion‑monitoring mass spectrometry. Anal Chem. 2001;73:2976–84.
31. Brun V, Masselon C, Garin J, Dupuis A. Isotope dilution strategies for absolute quantitative proteomics. J. Proteomics. 2009;72:740–9. 32. Peterson AC, Russell JD, Bailey DJ, Westphall MS, Coon JJ. Parallel reaction
monitoring for high resolution and high mass accuracy quantitative, targeted proteomics. Mol Cell Proteomics. 2012;11:1475–88.
33. Gallien S, Duriez E, Crone C, Kellmann M, Moehring T, Domon B. Targeted proteomic quantification on quadrupole‑orbitrap mass spectrometer. Mol Cell Proteomics. 2012;11:1709–23.
34. Zhang K, Schrag M, Crofton A, Trivedi R, Vinters H, Kirsch W. Targeted pro‑ teomics for quantification of histone acetylation in Alzheimer’s disease. Proteomics. 2012;12:1261–8.
35. Darwanto A, Curtis MP, Schrag M, Kirsch W, Liu P, Xu G, et al. A modified “cross‑talk” between histone H2B Lys‑120 ubiquitination and H3 Lys‑79 methylation. J Biol Chem. 2010;285:21868–76.