HAL Id: hal-00655023
https://hal.archives-ouvertes.fr/hal-00655023
Submitted on 25 Dec 2011HAL is a multi-disciplinary open access archive for the deposit and dissemination of sci-entific research documents, whether they are pub-lished or not. The documents may come from teaching and research institutions in France or abroad, or from public or private research centers.
L’archive ouverte pluridisciplinaire HAL, est destinée au dépôt et à la diffusion de documents scientifiques de niveau recherche, publiés ou non, émanant des établissements d’enseignement et de recherche français ou étrangers, des laboratoires publics ou privés.
GIS Evaluation of the Impacts on the Built and the
’Natural’ Environment of the 11 March 2011 Tsunami in
Rikuzentakata, Iwate Prefecture, Japan
Christopher Gomez, Patrick Wassmer, Claire Kain, Marie de Villiers, Kelli
Campbell, Stephen Ward, Arash Moghaddam
To cite this version:
Christopher Gomez, Patrick Wassmer, Claire Kain, Marie de Villiers, Kelli Campbell, et al.. GIS Evaluation of the Impacts on the Built and the ’Natural’ Environment of the 11 March 2011 Tsunami in Rikuzentakata, Iwate Prefecture, Japan. 2011. �hal-00655023�
GIS Evaluation of the Impacts on the Built and the ‘Natural’ Environment of the 11 March 2011 Tsunami in Rikuzentakata, Iwate Prefecture, Japan
C. Gomez1,2*, P. Wassmer3,4, C. L. Kain1, M. De Villiers1, K. Campbell1, S. Ward1, A. Moghaddam1
1. University of Canterbury, College of Sciences, Dept. of Geography, Private Bag 4800, Christchurch 8140, New Zealand.
2. University of Canterbury, Natural Hazards Research Centre, Private Bag 4800, Christchurch 8140, New Zealand.
3. Laboratoire de Géographie Physique, CNRS UMR8591, Université Paris 1 Panthéon-Sorbonne, France
4. Université de Strasbourg, faculté de Géographie et d’aménagement, Strasbourg, Strasbourg, France.
Abstract
The 11 March 2011 a Mw 9.0 earthquake triggered a tsunami off the Tohoku coast (Japan). To the north of the infamous Sendai plain area, a series of small bays stretches from the North of Miyagi prefecture to mid-Iwate prefecture. At the border between both prefectures, the municipality of Rikuzentakata lies close to the river-mouth of the Kesen River. Both the built and the ‘natural’ environment of the municipality have been wiped off the map. In order to create more resilient communities, it is important to reduce the costs of reconstruction and restructuration by integrating lessons learned from the present tsunami. Therefore, this contribution provides a GIS evaluation of the different impacts in order to improve further planning. We have used remote-sensing based GIS - ESRI ArcGIS suite – using spatial data from July 2010 and March 2011. The GIS analysis has been completed using data collected in Japan during the period 2006 – 2010. The results show that the shoreline has retreated up to 501 m with the disappearance of the lagoon barrier. Scouring has also occurred along the banks and the point-bars of the Kesen River. The point-bars located within 1 Km to the coast were totally eroded. The scouring occurred on low-vegetation land but it also occurred in forested areas, with the total destruction of forests in some areas. The ~0.26 km2 well-known coastal forest of the Takata Matsubara park has totally disappeared. We have also observed forested lands that have been flattened down along the river. The forested areas at higher elevations saw very little damage.
The built environment in Japan comprises different types of concrete buildings, metallic structures and timber-structures. The latter two building types, which rely on their low weight to resist earthquakes, have been totally destroyed within 3.5 km from the coast. Indeed the low weight increases the floatability and the light walls have poor resistance to the load of the tsunami waves. Therefore buildings that resisted the tsunami within 3.5 km of the shoreline are all concrete buildings. Nevertheless some concrete buildings also disappeared, because of the scouring around their base. These elements call for the reconstruction of a more resilient community, in order to decrease the cost of reconstruction in the event of another tsunami strike.
Keywords
Tsunami impacts; Environment; GIS; Aerial photographs; Japan; Tohoku; Iwate Prefecture; Rikuzentakata;
1. Introduction
The impact of a tsunami in any given environment depends strongly not only on the magnitude and intensity of the tsunami wave, but on local factors such as nearshore bathymetry, onshore topography, level and structure of urbanisation, and coastal vegetation patterns (Kumar et al., 2008, Dawson, 1994). The influence of geomorphology and bathymetry on the height and velocity of the wave at different locations along the same coastline has been widely recognised when studying patterns of damage related to the 2004 Indian Ocean tsunami (Umitsu et al., 2007, Leone et al., 2010, Kumar et al., 2008, Hentry et al., 2010).
Inundation distances and patterns are affected by the elevation and surface roughness of the land, which is often a function of land cover and land use in populated environments (Kumar et al., 2008). Flat topography allows more widespread inundation and greater inland penetration, as described by (Kumar et al., 2008)regarding the effect of the 2004 tsunami in Southeast India. Low-lying areas of shrimp ponds and rice fields in Banda Aceh were badly affected by the 2004 tsunami and were difficult to drain, as a consequence of their elevation and constraining topography (Lavigne et al., 2009). Frictional effects are also key, with tsunami waves penetrating a much greater distance when able to travel up rivers (Kumar et al., 2008) or encounter other low friction environments. For example, the large penetration distance of the 1923 Kamchatka tsunami is attributed to its run-up over snow-covered land, instead of a higher-friction vegetated environment (Minoura et al., 1996). In an urban setting, wave energy may be dissipated on contact with coastal buildings and structures, thus slowing the wave progression and preferentially protecting buildings further inland (Leone et al., 2010, Lavigne et al., 2009).
The protective nature of raised features to dissipate wave energy is important, whether they be natural features such as sand dunes and beach ridges (Hentry et al., 2010, Umitsu et al., 2007), hard engineered structures designed with a protective purpose (Kumar et al., 2008, Srivastava and Babu, 2009) or appropriate coastal vegetation (Sirikulchayanon et al., 2008, Tanaka, 2009, Tanaka et al., 2009). However, it has been noted by several authors that should these features fail, or vegetation be destroyed, then the opposite effect occurs, with consequent floating debris creating more damage to the infrastructure behind than would have resulted from the wave otherwise (Tanaka, 2009, Leone et al., 2010). Additionally, a gap in this protective barrier (for example, due to a road, river or a difference in elevation) can cause amplification of the tsunami current and water velocity increase as it preferentially travels through the gap (Tanaka, 2009). Despite the dissipative nature of sand dune systems, large tsunamis commonly result in erosion of or complete reorganisation of sandy barriers, back-barrier drainage systems and coastline structure (Dawson, 1994).
Impacts of tsunami are not limited to the run-up phase of the event, with significant erosion possible from the backwash phase also (Dawson, 1994). The backwash patterns of a tsunami are not always a reversal of the run-up course: for example, Lavigne et al. (2009) and Paris et al. (2009) described the backwash in Banda Aceh’s west coast (where there was obstructive topography between the inundated area and the coast), which preferentially followed local river channels and led to the creation of new erosional rills and widening of the river channels. At 2.46PM (JST), March 11th, 2011, a powerful 9.0 M. earthquake (24 km depth) shook East Japan. According to the Japanese Earthquake Research and Promotion, the fault movement was 400 km in the NS direction. In turn, the mega-thrust earthquake triggered a tsunami with waves of 9 to 15 m at the shore, which engulfed the major part of the coastal areas of Iwate and Miagi prefectures (Japan). Maximum wave-heights reached >35 m to 39 m in funnelled topographic areas – such as Ryouriwan -, according to Lin et al., (2011) and Mimura et al.
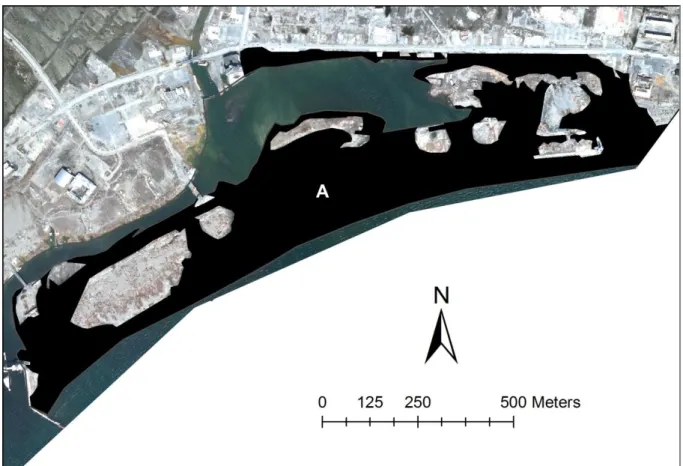
(2011) respectively. As at 1st May 2011, 24,000 people were reported dead or missing and 350,000 were living in refuge areas. One of the areas with the worst damage is the municipality of Rikuzentakata, which is located in Iwate Prefecture on the east coast of the Tohoku region (Fig. 1). It is situated at the back of a 3 km wide bay that opens to the Pacific Ocean, and on the estuary of the Kesen River. The municipality extends over 232.29 km2 with 23,302 inhabitants in 2010. The population was mainly making a living from oyster farming (40 million yen revenue in 2010) and from the location as a scenic attraction; with the Takata Matsubara Park declared a ‘Place of Scenic Beauty’ by the Japanese Ministry of Environment from the year Showa 2 (y.1927). The position of Rikuzentakata and the distribution on lowland of the principal infrastructure such as the City Hall and the schools, which are used as refuge location during natural disasters, increased the tsunami vulnerability. As per the mass-media broadcast, most of the city has been wiped from the map (Fig. 2).
Fig.1 Location of the municipality of Rikuzentakata and distribution of the major public constructs and communication at the study location.
Within less than 10 years, the two most deadly tsunamis of historic times have occurred: the 2004 Andaman tsunami and the 2011 Tohoku tsunami. These events remind us of the importance of studying the impacts of extreme-tsunamis (Gomez and Wassmer, 2011a), in order to improve the mitigation procedures.
Therefore, this contribution aims at providing an assessment of the tsunami impacts on the built and the ‘natural’ environment in Rikuzentakata, in order to examine potential remediation (presented in a companion paper to be published).
Fig. 2 View of the bay in front of Rikuzentakata (A) and zoom of the rubble in the destroyed municipality (source: images extracted and adapted from Al Jazeera, 2011)
2. Methodology
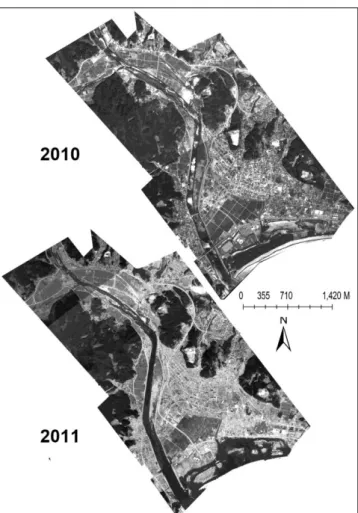
For this research, we have collected the March 13, 2011 aerial photographs provided by the Geospatial Information Authority of Japan in the wake of the 11/3 tsunami (www.gsi.go.jp) and the 23 July 2010 Geoeye satellite imagery (0.5 – 1 m resolution) of the area (Fig. 3). Remote-sensing methodology has been inefficient in assessing tsunami impacts for ‘small tsunamis’ such as the one that struck Java Island in 2006 (Lavigne et al., 2007), but it has proven effective for large tsunamis such as the Boxing Day tsunami around the Indian Ocean (e.g. Olwig et al., 2011; Wikantika et al., 2011)
The images have been orthorectified following a plane, this method, known to create distorsions over steep elevation areas, can be used without any problem in this research strictly focused on flat areas. The images have also been georeferenced in UTM WGS84; the choice of UTM was driven by the numerous metric calculations involved. Both processes were conducted using the ESRI® ArcGIS® software. Based on this data, we have measured and quantified the planform modifications due to the tsunami. Firstly, we measured the displacement of the shoreline, the river-banks and the related loss of land for both
geomorphologic features. The geostatistics associated with the geomorphology have been carried out using Matlab and simple scripts (available online with the extracted data as extra-material for reference). Secondly, we mapped and calculated the lost surface area of riparian forest, woods and tree plantations. Thirdly, we mapped and calculated the destruction of the built environment. We also analysed the role of building clustering and its role using the density function in ArcMap®. Finally, these various indicators were studied in a combined geo-analysis.
We completed this GIS analysis with data collected in the field on Honshu Island between 2006 and 2010. This dataset concerns the way buildings are constructed and the type of materials that are commonly used.
Fig. 3 The 2010 Geoeye imagery and the 2011 aerial photographs mounted, orthorectified and georeferenced for the area of Rikuzentaka and the Kesen River.
3. Results
3.1 Geomorphological impacts
The length shoreline studied here is approximately 1,800 m for a measure done with a control vertex every 100 m. We have observed an average retreat of the seashore of 345 min this area, with a high standard deviation of 110 m, meaning that some areas hold well against the tsunami, whereas were highly eroded. Areas where the shoreline did not retreat correspond to the areas where concrete wave-breaker protected the shore. On the contrary, areas such as the lagoon barrier and the lagoon recorded a draw-back of up to 501 m. For these highly eroded areas, the retreat of the shoreline was stopped due to the presence of roads parallel to the coast, which played the role of a ‘stop-bank’. This shoreline retreat doesn’t however mean that a corresponding amount of land has been lost (Fig. 4), because of the presence of the lagoon. This retreat has also created a series of 9 main islands that are disconnected from the mainland. The total surface of land lost to the tsunami is 0.37 km2 (Fig. 4).
Fig. 4 Area lost to the tsunami in March 2011 (A). The exact causes of this loss cannot be solely determined from aerial photographs as it could be a mix of subsidence and erosion. The 4.8 km length of the Kesen River studied here has been impacted by the tsunami. The average width of the active channel has increased from 79 m to 88 m on average (Fig. 5), with a maximum width of 163 m in 2010 that became 180 m after the tsunami. Minimum values have also increased from 26 m to 30 m. The maximum peak of erosion is 94 m for the right bank against 60 m on the left. This exceptionally high value on the right bank is due to the total disappearance of a pointbar located between 50 and 60 m from the river mouth. The maximum erosion for the left bank is also due to a pointbar that developed against the stop-bank in the active channel. It is interesting to note that there is no clear gradient – away from the sea - in the lateral erosion along the 4.8 km, which one would have expected with the progressive energy dissipation. However, the influence of the mingling between build and natural environment makes quantification difficult, and the erosion that took place along the river was all contained between the concrete stop-banks.
The position of the active channel within the limits of the stop-banks is at the origin of an erosive dissymmetry between the left and right banks (Fig. 6). The left bank (to the East on the figures) has lost 10 m on average, whereas the right bank lost 7 m on average. We can find a similar ratio for the minimum erosion data: 0.16 m and 0.4 m (right and left banks respectively).
Fig. 5 Planform changes of the Kesen River along 4.8 km. (1) Width of the active channel in July 2010; (2) Width of the active channel on March 13, 2011; (3) Lateral erosion of the right bank; (4) Lateral erosion of the left bank.
Fig. 6 Correspondence of the lateral erosion between the right bank and left bank. The scatter plot shows that there is no strict relation between the lateral erosion of the right and left bank for each sampled transect.
3.2 Impacts on the riparian forested areas and tree plantation
Along the 4.8 km of the Kesen River, all riparian trees have been uprooted and transported or flattened down by the tsunami. The loss of riparian forested area has been 0.29 km2 along the Kesen river and 0.34 km2 along the Kesen River and its tributary. The tsunami has destroyed both large and small clusters of forested land. The largest of these is 51,000 m2, located between 3 km and 3.8 km from the mouth of the Kesen River. Destruction extends laterally
195 m from the closest bank and 250 m to the active channel central line. The largest area of flattened trees (1 on Fig. 7) measures 42,000 m2. It is located on a left pointbar, along the Kesen River, only 2.5 km from the river mouth. The second area, where trees have been flattened is located on a right bar (2 on Fig. 7). It is 5,500 m2 and it is located 3.6 km from the river mouth.
Because of the physical destruction of the lagoon’s barrier, forested land in the area subsequently disappeared as well. This forested area was composed of two curtains of vegetation located on one or both sides of the lagoon with one interruption (Fig. 7). The total loss of forested area is 0.26 km2, which is a 100% lost, except for one of the pine-tree. Only 66,000 m2 of the land that hosted this forested area hasn’t been colonized by sea-water, and 38,000 m2 of this land is located at the back of the lagoon in an area that was protected by a stopbank and around the high-school ground.
Fig. 7 Impacts of the tsunami on forested areas in the municipality of Rikuzentakata; (1) and (2) are areas where the trees has been flattened down.
Forested land over riparian areas and the lagoon barrier were most affected because they extended in the low-land areas. The high level of destruction of the riparian forest far inland is due to the tsunami flow that was partially canalized within the river stopbanks with less
friction at the bottom and therefore conserving more energy. Forested lands growing on topographic highs were less affected, if it is not for the edges. These areas represent 0.4 km2.
3.3 Characteristics and distribution of the built environment pre- and post-tsunami
The characteristics of buildings are strictly controlled in Japan by the Building Standard Act, which has seen 4 generations. Each modification of this act has occurred after the lessons learned after major earthquakes. The first generation concerns buildings before 1971. The second generation concerns buildings between 1971 and 1981, and it was emplaced after the Tokachi Earthquake in 1968. Thissecond generation standard focuses on securing the safety of people inside of buildings. Buildings had to be able to resist an impact of 6 or higher on the JMA seismic scale, which is as follows: 0 Nobody feels the tremor; 1: some people indoors may feel the tremor; 2 Hanging features may shake; 3: Electrical wires shake; 4: Hanging fixtures considerably shake and dishes rattle; lower 5: People feel the need to get to safety; dishes and books fall off shelves; higher 5: A sense of extreme danger, heavy furniture tips over, brick walls may topple; Lower 6: people cannot maintain a standing position, doors will not open and window glass will break; Upper 6: Impossible to move without crawling; brick walls fall down; 7: Unable to move or act by will, furniture will move or ‘fly around’. The third generation of the building act concerns the period 1981 – 2000 and specified that all large buildings needed to be investigated and structurally improved. Thefourth generation of the Building Standard Act concerns modifying timber-framed buildings to improve their resistance to earthquake and it also makes ground investigation mandatory before starting a construction. Thanks to such a strict regulation the earthquake that preceded the tsunami did not trigger any major damage to most buildings. However, those structures are not well-fitted against tsunamis.
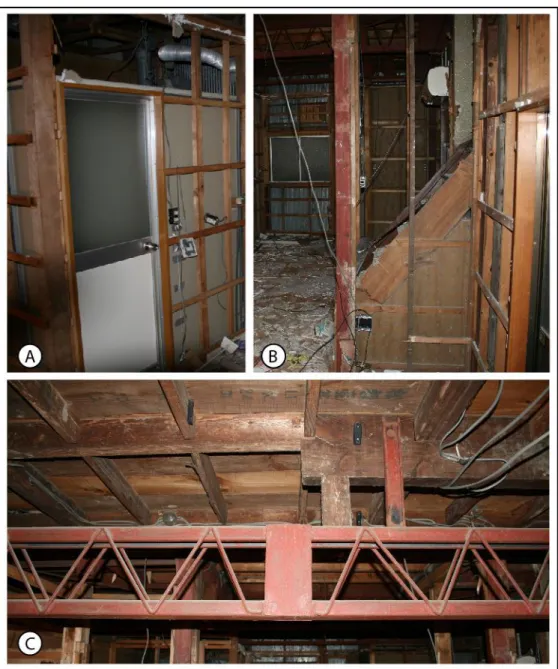
Constructions in Japan are either supported: (1) by a timber-frame structure – typically traditional buildings and one to two storeys habitation buildings; (2) by a metallic structure – recent habitations or commercial buildings: or (3) by a reinforced concrete (RC) structure or a steel reinforced concrete structure (SRC). Some buildings also display a mixture of these, often with a metallic structure superimposed on the traditional timber structure. This type of improvement is adopted to reinforce buildings or further the life of aging buildings (Fig. 8). Such improvement is part of the process called ‘refo-mu’ in Japanese, which consists in modifying, repairing and restoring houses instead of rebuilding a new one. Hooked to the timber and metallic structure, external walls are traditionally light and may be made of wood planks, compressed wood panels, aluminium (Fig. 8-B at the back of the photograph) or plastic sheets (Fig. 9). Light panelling is also found in the houses with either plaster-board, projected plaster on boards or traditionally on bamboo webs, well-known ‘light wood and paper’ mobile /or not separations. The structures are usually anchored to a concrete slab or concrete walls. For the buildings less than 3 storeys high that form the majority of the constructions in the area of Rikuzentakata, the links between the structure and the foundations are either metallic threads less than 2 cm in diameter or bolts, which do not resist the upward and lateral load well.
In Rikuzentakata, the ‘light’ constructions have responded poorly to the vertical load and the upward forces produced by the tsunami waves. Based on the image analysis, we have identified different types of destruction: (1) destruction due to sliding over the foundations and/or overturning of the structure, in such a way that we can still observe the concrete slab on the ground; (2) scouring of the surrounding land and of the place where a building was standing. Such destruction has mostly affected timber and steel frame buildings. High-rise buildings (4 storeys and more), with a RC or SRC structure resisted the tsunami (Fig. 10-B)
Fig. 8 Typical timber-frame structure house, which has been reinforced by a metallic structure during the Showa period (1926-1989). We can also appreciate the external wall panels made of painted steel. (Photos: C. Gomez, 2006)
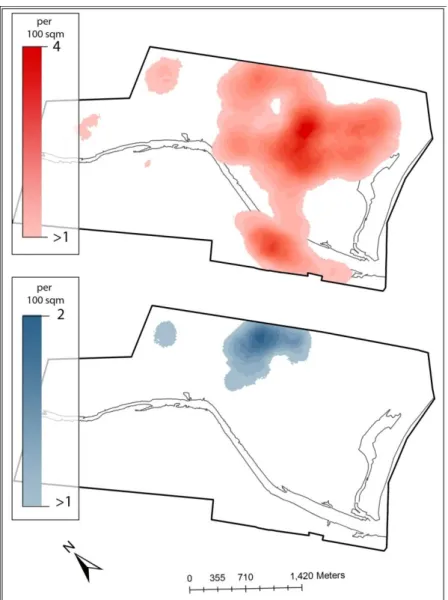
Fig. 9 Buildings’ external walls: (A) Concrete building; (B) Wood panels covered by plastic sheets; (C) Aluminium sheets; (D) Traditional wood boards. (Photos: C. Gomez, 2007) The area of maximum destruction of buildings is encountered in the lowland plain up to 3 km inland. Buildings have been destroyed (Fig. 10) regardless of the density of the built environment, the orientation of the houses and for most of them their structure (wood or metallic structures). Buildings of the city council, sport-centres and part of school buildings have structurally survived the tsunami. This has moved the barycentre of the Rikuzentakata buildings from 1400 m to 2400 m from the shoreline, modifying the spatial distribution of building density (Fig. 11).
Fig. 10 Location of destroyed buildings (black points) and still standing buildings (grey points); Black arrows are orientation associated with the uprush; Grey arrows are orientations associated with the backwash. The complexity of orientations marker is interesting; however they are very difficult to understand at this stage.
Fig. 11 Change in building density (number of building in a radius of 150 m, data provided in 100 m2).
4. Discussion
Large tsunamis can result in a complete reorganisation of the structure of sandy coasts (Dawson, 1994), which has occurred here with the destruction of the lagoon barrier resulting in loss of the lagoon and the creation of nine offshore islands. In addition, 0.37 km2 of land has been lost to the sea since the tsunami. However, the degree to which this loss can be attributed to erosion and reorganisation of the shoreline is not currently known, as the area has experienced significant subsidence as a result of the 9.0 M earthquake that preceded the tsunami (Mimura et al., 2011). This subsidence could also contribute to the permanent inundation of these coastal areas and further research is required to quantify the effects of subsidence and erosion on shoreline changes. In Banda Aceh, at the northern extremity of Sumatra, the 9.3 earthquake that preceded the 2004 tsunami produced a subsidence estimated locally to 2 to 3 m. This imprecision led to the same uncertainty concerning the respective role of subsidence or erosion to explain the retreat of the shore, especially at the western end of the large bay of Lok Ngah.
The location of the township at the head of a bay contributed to the level of damage experienced here. The effect of funnelling and amplification of tsunami waves as they propagate in bay environments is documented in the literature (Sugawara et al., 2005, Poisson
et al., 2009, Lavigne et al., 2009, Kumar et al., 2008, Hentry et al., 2010) and this occurred here, culminating in the high run-up heights and wave energy experienced in Rikuzentakata. This, coupled with the concentration of the population on the low-lying and narrow coastal plain, resulted in high levels of damage and mortality.
The intensity of the tsunami at Rikuzentakata was such that the coastal forest vegetation and riparian vegetation along 4.8 km of the Kesen River was destroyed. Had these forested areas remained standing, they may have dissipated some of the energy of the tsunami, but as they did not it is likely that the floating debris caused by uprooted trees combined with destroyed buildings would have impacted the buildings further inland and enhanced the damage potential (Tanaka, 2009, Leone et al., 2010). Tanaka et al. (2009) also notes that the nature of the vegetative cover is important in determining its protective capacity and that well developed woody forested areas (such as those found in Rikuzentakata) are not sufficiently low, dense or consistent for this purpose. The nature of the trees may have played a role as well. On the lagoon barrier, pine-trees were planted, but not as a protection against tsunami or storms but to reduce the impacts of sea-salt on the agricultural land behind. After the 2011 tsunami, just one of the pine trees has survived.
The Kesen River acted as an important conduit for tsunami propagation inland, resulting in damage several kilometres from the coast and allowing some areas to become inundated from the side or behind, rather than or as well as from the direction of the coast (Mimura et al., 2011). The reason for the river becoming a ‘tsunami highway’ is likely a combination of elevation and surface roughness. Friction plays an important role in dissipating wave energy and slowing the tsunami wave (Minoura et al., 1996, Lavigne et al., 2009) and the low-friction water surface would allow the wave to travel further and faster before dispersing. In addition, the elevation of the river is lower than surrounding land, providing a gap that could potentially amplify the waves, playing the role of a wave trap. This river propagation effect is consistent with that documented along India’s coastline in response to the 2004 tsunami (Kumar et al., 2008, Hentry et al., 2010), however we could not observe such a severe difference on the extremely flat coast of Banda Aceh, excepted further inland, where the channelled valleys open to the wide coastal plain.
Significant erosion and widening of the Kesen River channel occurred as a consequence of this event. The energy of the tsunami during the run-up phase was sufficient to destroy riparian vegetation and therefore erode riverside sediment, but it is likely that significant erosion also occurred due to backwash and draining of the land into the river channel, as described by Lavigne et al. (2009) in relation to the backwash phase of the 2004 tsunami in Banda Aceh. A greater degree of erosion occurred on the true left bank of the Kesen River, and this can be explained at least in part by differing elevations of the land alongside the two banks. Land on the true left bank was lower-lying than that of the right and surface area of the coastal plain was also greater to the left, likely causing a greater volume of water exchange on this side according to the observations of tsunami transmission described in the literature (Umitsu et al., 2007, Poisson et al., 2009, Lavigne et al., 2009, Kumar et al., 2008, Hentry et al., 2010, Dawson, 1994).
After the 2004 Boxing Day Andaman tsunami, extensive appraisals of the impacts of the tsunami on the buildings have been conducted (e.g. Dias et al., 2006). Although the building code (present or not), building materials and the types of construction vary from one country to another, one can identify elements that can be transposed to the Japanese case.
Indeed, Dias et al (2006) recognized the importance of ‘tying down structures against upward and lateral loads as well as the need to anticipate and reduce soil scour around foundations’. These destructive processes seem to have played an important role in Rikuzentakata.
For the buildings constructed on the lagoon barrier, scouring has played a major role, since the foundations of some of the buildings have also disappeared.
Overturning and sliding of structures have also been observed on videos around Sendai, Yamata and Rikuzentakata (Gomez and Wassmer, 2011a,b). Single to two storeys habitation buildings in Rikuzentakata have a light structure and a light envelope, in order to resist earthquake induced damages. Therefore constructions are characterized by timber- or metallic-framed structure with either wood, either aluminium or plastic exterior walls. Interior walls are either made of spread plaster over a bamboo structure, light-wood and paper mobile partitions, or for more recent constructions plaster boards.
The importance of overturning and sliding was evident after the 2004 tsunami. Single storey masonry houses were destroyed in Sri Lanka except for the parts of the houses that had important weights such as concrete water-tanks located on the roof. The extra-weight prevented sliding and overturning (Dias et al., 2006). Thusyanthan and Gopal (2008) used flume simulation to demonstrate the effect of uplift forces applied on roofs due to water that curls, which may cause damage even when the tsunami wave height is lower than the roof level.
Large events also prove that humans are ill-prepared against extreme events. Even tsunami resistant houses tested in Thusyanthan and Gopal (2008) assume a tsunami height that does not exceed the height of a one-storey house. Most engineering simulations also ignore the role of debris that impacts buildings (Dias et al., 2006; Thusyanthan and Gopal, 2008).
This series of findings calls for considering a reconstruction process that takes into consideration the lessons learned from the recent tsunami.
5. Conclusion
The municipality of Rikuzentaka is located in an area vulnerable to tsunami due to the funnel shape topography and low-land configuration. The Kesen River has also acted as a highway for the tsunami, bringing destruction and inundation far inland. We argue that this is mainly due to the reduced friction in the water body. Planted and natural forest areas, which are often considered as natural barrier against tsunamis, have also proven ineffective in the face of such a large tsunami, and the debris may have actually increased the destructive ability of the tsunami.
For the reconstruction of the city and the communication infrastructure, one must take into consideration this dataset in order to provide the local population with a more secure built and natural environment. These reconstruction concerns are to be published in a companion paper.
References
Dawson, A., 1994. Geomorphological effects of tsunami run-up and backwash. Geomorphology, 10, 83-94.
Dias, P., Dissanayake, R., Ravihansa, C., 2006. Lessons learned from tsunami damage in Sri Lanka. Civil Engineering 159, 74-81.
Gomez, C., Wassmer, P., 2011(a). A New Insight on the 2004 Boxing Day Tsunami in North Sumatra through the Analysis of Videos of the 2011 Tohoku Tsunami: Preliminary Results. European Geophysical Union General Assembly, Vienna. Abstract proceeding.
Gomez, C., Wassmer, P., 2011(b). The 2011 Tohoku Tsunami in Japan and the 2004 Tsunami in North Sumatra: assessment of inland behaviour and of the post-tsunami. Natural Hazards and Earth-System Sciences (submitted).
Hentry, C., Chandrasekar, N., Saravanan, S., Dajkumar Sahayam, J., 2010. Influence of geomorphology and bathymetry on the effects of the 2004 tsunami at Colachel, South India. Bulletin of Engineering Geology and the Environment, 1-12.
Kumar, C. S., Murugan, P. A., Krishnamurthy, R., Batvari, B. P. D., Ramanamurthy, M., Usha, T., Pari, Y., 2008. Inundation mapping–a study based on December 2004 Tsunami Hazard along Chennai coast, Southeast India. Natural Hazards and Earth System Sciences, 8. Lavigne, F., Gomez, C., Giffo, M., Wassmer, P., Hoebreck, C., Mardiatno, D., Priyono, J., Paris, R. 2007. Field observations of the 17 July 2006 Tsunami in Java, Natural Hazards and Earth System Sciences 7, 177-183.
Lavigne, F., Paris, R., Grancher, D., Wassmer, P., Brunstein, D., Vautier, F., Leone, F., Flohic, F., Coster, B., Gunawan, T., 2009. Reconstruction of tsunami inland propagation on December 26, 2004 in Banda Aceh, Indonesia, through field investigations. Tsunami Science Four Years after the 2004 Indian Ocean Tsunami, 259-281.
Leone, F., Lavigne, F., Paris, R., Denain, J. C., Vinet, F., 2010. A spatial analysis of the December 26th, 2004 tsunami-induced damages: Lessons learned for a better risk assessment integrating buildings vulnerability. Applied Geography.
Lin, A., Gao, G., Ikuta, R., 2011. Run-up height distribution of tsunami caused by the 2011 Mw 9.0 Off Pacific Coast of Tohoku earthquake and the associated fault movement. Japan Geoscience Union Meeting 2011, May 22-27, Makuhari, Chiba, Japan.
Mimura, N., Yasuhara, K., Kawagone, S., Yokoki, H., Kazama, S., 2011. Damage from the Great East Japan Earthquake and Tsunami-A quick report. Mitigation and Adaptation Strategies for Global Change, 1-16.
Minoura, K., Gusiakov, V. G., Kurbatov, A., Takeuti, S., Svendsen, J. I., Bondevik, S., Oda, T., 1996. Tsunami sedimentation associated with the 1923 Kamchatka earthquake. Sedimentary Geology, 106, 145-154.
Olwig, M.F., Sorensen, M.K., Rasmussen, M.S., Danielsen, F., Selvan, V., Hansen, L.B., Nyborg, L., Vestergaard, K.B., Parish, F., Karunagaran, V.M., 2011. Using remote sensing to assess the protective role of coastal woody vegetation against tsunami waves. International Journal of Remote Sensing 28, 3153-3169.
Paris, R., Wassmer, P., Sartohadi, J., Lavigne, F., Barthomeuf, B., Desgages, É., Grancher, D., Baumert, Ph., Vautier, F., Brunstein, D., Gomez, Ch., 2009. Tsunamis as geomorphic crisis: lessons from the December 26, 2004 tsunami in Lhok Nga, west Banda Aceh (Sumatra, Indonesia). Geomorphology 104, 59-72.
Poisson, B., Garcin, M., Pedreros, R., 2009. The 2004 December 26 Indian Ocean tsunami impact on Sri Lanka: cascade modelling from ocean to city scales. Geophysical Journal International, 177, 1080-1090.
Sirikulchayanon, P., Sun, W., Oyana, T. J., 2008. Assessing the impact of the 2004 tsunami on mangroves using remote sensing and GIS techniques. International Journal of Remote Sensing, 29, 3553-3576.
Srivastava, A., Babu, G. L. S., 2009. Analysis and design of reinforced earth wall for shore protection system against tsunami. Science of Tsunami Hazards, 28, 186.
Sugawara, D., Minoura, K., Imamura, F., Takahashi, T., Shuto, N., 2005. A huge sand dome formed by the 1854 earthquake tsunami in Suruga Bay, central Japan. ISET Journal of earthquake technology, 42, 147-158.
Tanaka, N., 2009. Vegetation bioshields for tsunami mitigation: review of effectiveness, limitations, construction, and sustainable management. Landscape and Ecological Engineering, 5, 71-79.
Tanaka, N., Nandasena, N., Jinadasa, K., Sasaki, Y., Tanimoto, K., Mowjood, M., 2009. Developing effective vegetation bioshield for tsunami protection. Civil Engineering and Environmental Systems, 26, 163-180.
Thusyanthan, N.I., Gopal, S.P., 2008. Tsunami wave loading on coastal houses: a model approach. Civil Engineering 161, 77-86.
Umitsu, M., Tanavud, C., Patanakanog, B., 2007. Effects of landforms on tsunami flow in the plains of Banda Aceh, Indonesia, and Nam Khem, Thailand. Marine geology, 242, 141-153. Wikantika, K., Sinaga, A., Hadi, F., Darmawan, S., 2011. Quick assessment on identification of damaged building and land-use changes in the post-tsunami disaster with a quick-look image of IKONOS and Quickbird (a case in Meulaboh City, Aceh). International Journal of Remote Sensing 28, 3037-3044.
Loops to calculate distances (reference variables available upon request and at www.gomezchristopher.com):
% calculate the distance between True left banks for a=1:48 dRv10L(a)=(Rv11Ly(a)-Rv10Ly(a))^2+(Rv11Lx(a)-Rv10Lx(a))^2; dRV10L(a)=sqrt(dRv10L(a)); end clear a dRv10L dRV10L=dRV10L';
% calculate the distance between True Right banks for a=1:48 dRv10R(a)=(Rv11Ry(a)-Rv10Ry(a))^2+(Rv11Rx(a)-Rv10Rx(a))^2; dRV10R(a)=sqrt(dRv10R(a)); end clear a dRv10R dRV10R=dRV10R';
% calculate the width of the river in 2010 for a=1:48 larg10(a)=(Rv10Ry(a)-Rv10Ly(a))^2+(Rv10Rx(a)-Rv10Lx(a))^2; Larg10(a)=sqrt(larg10(a)); end clear a larg10 Larg10=Larg10';
% calculate the width of the river in 2011 for a=1:48 larg11(a)=(Rv11Ry(a)-Rv11Ly(a))^2+(Rv11Rx(a)-Rv11Lx(a))^2; Larg11(a)=sqrt(larg11(a)); end clear a larg11 Larg11=Larg11';