Contents lists available atScienceDirect
Talanta
journal homepage:www.elsevier.com/locate/talanta
Targeted proteomics reveals serum amyloid A variants and alarmins
S100A8-S100A9 as key plasma biomarkers of rheumatoid arthritis
Gwenaël Nys
a, Gaël Cobraiville
a,b, Anne-Catherine Servais
a, Michel G. Malaise
b,
Dominique de Seny
b, Marianne Fillet
a,∗aLaboratory for the Analysis of Medicines, Center for Interdisciplinary Research on Medicines (CIRM), ULiege, Quartier Hopital, Avenue Hippocrate 15, 4000 Liege, Belgium
bLaboratory of Rheumatology, GIGA-Inflammation, Infection & Immunity, ULiege and CHU de Liege, Quartier Hopital, Avenue Hippocrate 15, 4000 Liege, Belgium
A R T I C L E I N F O Keywords:
Serum amyloid A isoforms Rheumatoid arthritis S100A8 S100A9 Bottom-up proteomics Mass spectrometry A B S T R A C T
Serum amyloid A (SAA) and S100 (S100A8, S100A9 and S100A12) proteins were previously identified as bio-markers of interest for rheumatoid arthritis (RA). Among SAA family, two closely related isoforms (SAA-1 and SAA-2) are linked to the acute-phase of inflammation. They respectively exist under the form of three (α, β, and γ) and two (α and β) allelic variants. We developed a single run quantitative method for these protein variants and investigated their clinical relevance in the context of RA. The method was developed and validated ac-cording to regulations before being applied on plasma coming from RA patients (n = 46), other related in-flammatory pathologies (n = 116) and controls (n = 62). Depending on the activity score of RA, SAA1 isoforms (mainly of SAA1α and SAA1β subtypes) were found to be differentially present in plasma revealing their dual role during the development of RA. In addition, the weight of SAA1α in the total SAA response varied from 32 to 80% depending on the pathology studied. A negative correlation between SAA1α and SAA1β was also high-lighted for RA early-onset (r = −0.41). SAA2 and S100A8/S100A9 proteins were significantly overexpressed compared to control samples regardless of RA stage. The pathophysiological relevance of these quantitative and qualitative characteristics of the SAA response remains unknown. However, the significant negative correlation observed between SAA1α and SAA1β levels in RA early-onset suggests the existence of still unknown regulatory mechanisms in these diseases.
1. Introduction
Rheumatoid arthritis (RA) is an autoimmune disease that mostly affects women resulting in painful and swollen peripheral joints leading to irreversible cartilage and bone destruction. RA disease activity is monitored by the determination of composite indices such as the dis-ease activity score calculated on 28 joints (DAS28) which integrates the
number of tender and of swollen joints, and the ESR or CRP serum levels. Disease activity is categorised as low (2.6 < DAS28< 3.2),
moderate (3.2 ≤ DAS28≤5.1) or severe (DAS28≥5.1) [1].
Serum amyloid A (SAA) and S100 (S100A8, S100A9 and S100A12) proteins have previously been highlighted as potential biomarkers of interest of RA [2,3]. The SAA family is composed of four isoforms, among which two (SAA1 and SAA2) are associated with acute-phase of inflammation [4,5]. SAA3 is believed to be a pseudo gene and SAA4 is constitutively expressed in the liver. Structurally, SAA1 and SAA2 share
up to 90% of sequence homology and therefore cannot be distinguished by immunoassays as the antibody reacts indistinctly with both SAA isoforms [6]. In addition, SAA1 and SAA2 proteins are polymorphic with three (α, β and γ) and two (α and β) major allelic variants, re-spectively [4,6] (Table 1). Plasma concentration of SAA is higher in RA patients than in healthy individuals [4,7]. Synovial fluid levels of SAA are significantly higher than in corresponding serum, suggesting local joint production [7,8]. Serum concentration of SAA increases with RA severity [9,10] and in various tumours [11,12], which has led re-searchers to conclude that SAA concentration was very sensitive but not specific for diagnosis, prognosis and monitoring of patients with in-flammatory diseases [4,11–14]. Although SAA has been widely studied in many diseases, the quantification of its respective isoforms remains poorly known. Sung et al. used LC-MS to separate SAA1 and SAA2 in lung cancer patients [15]. Kim et al. discriminated SAA1α, SAA1β, SAA1γ, SAA2α, and SAA2β for the same disease and highlighted
https://doi.org/10.1016/j.talanta.2019.06.044
Received 4 April 2019; Received in revised form 7 June 2019; Accepted 10 June 2019
∗Corresponding author. Laboratory for the Analysis of Medicines, Department of Pharmacy, CIRM, ULiege, CHU, B36, Quartier Hopital, Avenue Hippocrate 15,
4000 Liege, Belgium.
E-mail address:marianne.fillet@uliege.be(M. Fillet).
Talanta 204 (2019) 507–517
Available online 11 June 2019
0039-9140/ © 2019 The Authors. Published by Elsevier B.V. This is an open access article under the CC BY license (http://creativecommons.org/licenses/BY/4.0/).
differences in the expression of each subtype [6]. However, to the best of our knowledge, this is the first study investigating SAA variants in the context of RA.
S100A8 and S100A9 are produced by neutrophils and macrophages upon interaction with activated endothelial cells [3,16–19]. Physiolo-gically, they are associated under the form of a dimer, which forms heterotetramers in the presence of calcium [18,20]. The dimeric form of S100A8/S100A9 (calprotectin) is a known biomarker for inflammatory bowel disease [21], although increases of S100A8/S100A9 concentra-tions have also been observed in RA, in psoriatic arthritis and in an-kylosing spondylitis (AS) [3,22,23]. S100A12 is produced by granulo-cytes and acts independently of S100A8 and S100A9 to induce pro-inflammatory signals [24].
In this work, we present the development of a method analyzing SAA variants and S100A8, S100A9, and S100A12 proteins using a single targeted bottom-up proteomics LC-MS/MS. Compared to pre-viously developed methods, we extended the analysis to other proteins (S100 variants). We also comprehensively present the development and optimization of the sample preparation and protein digestion as well as the challenges associated to multiplexed bottom-up proteomics. Furthermore, an innovative approach was employed to access the ab-solute concentration of proteins of interest using a digestion curve translating a concentration of peptide into a concentration of protein. This strategy was then fully validated according to regulation to ensure reliability of the results. Finally, this method was subsequently em-ployed to study the differential expression of each of SAA variants and
S100A8 and S100A9 in healthy controls (HC) and in patients suffering from various immune-mediated inflammatory diseases (IMID) in-cluding RA and osteoarthritis (OA).
2. Methods
2.1. Materials
Acetonitrile (ACN), methanol (MeOH), water (H2O), formic acid
(FA), trifluoroacetic acid (TFA) of ULC-MS grade were obtained from Biosolve (Valkenswaard, the Netherlands). Ammonium bicarbonate (ABC), trypsin from bovine pancreas, calcium chloride (CaCl2) and
ammonia were obtained from Sigma-Aldrich (Saint-Louis, MI, USA). Oasis MAX 10 mg 96 well plates were purchased from Waters (Dublin, Ireland). Standard and internal standards peptides (ISTD) were syn-thesised by Eurogentec (Seraing, Belgium) with a purity > 98%. SAA1α and Apo-SAA proteins (both with purity > 98%) were obtained from Peprotech (London, UK). S100A12, S100A9, and S100A8 proteins (purity > 90%) were obtained from Abcam (Cambridge, UK).
2.2. Preparation of standard solutions
Standard peptides, ISTD, S100A8, S100A9 and S100A12 proteins were individually dissolved in H2O/ACN/FA (90:10:0.1, v/v) at a
concentration of 100 μg mL−1. Apo-SAA and SAA1α proteins were
dissolved in the same solvent at a concentration of 500 μg mL−1and
List of abbreviations
ABC Ammonium bicarbonate ACN Acetonitrile
AS Ankylosing spondylitis CRP C-reactive protein DAS Disease activity score DoE Design of experiments FA Formic acid
HC Healthy controls
IMID Immune-mediated inflammatory diseases
LC-MS/MS Liquid chromatography-tandem mass spectrometry LOQ Limit of Quantitation
MeOH Methanol
MRM Multiple reaction monitoring OA Osteoarthritis
RA Rheumatoid arthritis SAA Serum amyloid A
SLE Systemic lupus erythematosus TFA Trifluoroacetic acid
UHPLC Ultra-high-pressure liquid chromatography
Table 1
Sequence of studied proteins. Differences among each family are highlighted in orange. Underlined sequences represent the peptides that are being generated by tryptic digestion and analysed by LC-MS/MS.
1 mg mL−1, respectively. Solutions were aliquoted and kept at −80 °C
until analysis. The preparation of calibration and validation solutions is presented in S2.
2.3. LC-MS conditions
Ultra-high-pressure liquid chromatography (UHPLC) separation was performed with a 1290 infinity system (Agilent Technologies, Waldbronn, Germany) on an Aeris C18 column (1.7 μm particle sise, 100 × 2.1 mm ID) (Phenomenex, Torrance, CA, USA) thermostated at 60 °C. The separation was achieved in gradient mode with mobile phase A (H2O/FA, 100:0.1, v/v) and B (ACN/H2O/FA, 90:10:0.1, v/v) at
0.5 mL/min. The gradient was as follows: 0–2.5 min, from 6% to 8.5% B; 2.5–3 min, from 8.5 to 18.25% B, 3–6 min, from 18.25 to 19% B, 6–8 min, from 19 to 60% B; 8–8.1 min, from 60 to 95% B; 8.1–9, 95% B; 9–9.1 min, from 95% to 6% B (2.2 min post-time). The injection volume was 5 μl. MS/MS detection was performed on a 6495 LC-MS Triple Quadrupole equipped with the iFunnel Technology (Agilent Technologies) and operated using positive electrospray ionization. The source conditions were optimized via the Agilent Source Optimizer software and were as followed. The capillary and the nozzle voltages were set at 3000 V and 1500 V, respectively. Nitrogen was used as drying (230 °C, 19 l/min) and sheath gas (250 °C, 12 l/min). The high and low-pressure funnels were operated at 70 V and 40 V, respectively. Multiple reaction monitoring (MRM) transitions were individually op-timized for each standard and ISTD peptides using Skyline software.
2.4. Sample preparation
The optimized sample preparation protocol was the following. 25 μl of each calibration solution were mixed with 25 μl of bovine plasma and loaded in duplicate on a 96 well plate. 25 μl of sample were mixed with 25 μl of H2O/ACN/FA (80:20:0.1, v/v). Then, 300 μl of 100 mM (pH
8.1) of ammonium bicarbonate (ABC) solution containing 33.3% of MeOH and 25 μl of 500 ng mL−1ISTD solution were added in each well
before incubation at 100 °C for 10 min. Then, 25 μl of 0.7 mg mL−1
trypsin solution (in 100 mM ABC) was added before incubation at 37 °C/600 RPM overnight. 25 μl of 25% ammonia was added to quench the reaction. Extraction was realized using an Oasis MAX SPE plate (10 mg sorbent, Waters Corporation, Dublin, Ireland). The protocol is present in S3A.
The second was of the SPE was optimized by varying the pH of the second wash (acid, neutral of basic); the proportion of MeOH in the second wash solution (from 20 to 80%) and the proportion of ACN in the elution solution (from 10 to 95% ACN) using 25 μl of 500 ng mL−1
peptide solution mixed with 25 μl of bovine plasma. Results were modelled using SAS JMP (Cary, NC, USA) to find the optimal condi-tions. To optimize the resuspension solution, 25 μl of 500 ng mL−1
peptide solution mixed with 25 μl of bovine plasma were extracted, evaporated to dryness and resuspended with 100 μl of solutions com-posed either of 0.1% FA or 0.1% TFA containing increasing amounts of ACN (from 0 to 40%).
2.5. Optimization of digestion conditions
Tryptic digestion was optimized using a design of experiment (DoE) achieved with 5 commercially available proteins (SAA1α, Apo-SAA, S100A8, S100A9, and S100A12) spiked at 1 μg mL−1in bovine plasma
processed as described in paragraph 2.1. The DoE was performed considering nature (MeOH or ACN) (X1) and proportion of organic
modifier in the digestion solution (5, 17.5 and 30%) (X2), and the
quantity of trypsin to use (17.5, 96.25 and 175 μg per sample, corre-sponding to 1:100 to 1:10 trypsin-to-proteins ratio) (X3). Responses
(peak areas of peptides) were modelled using SAS JMP (Cary, NC, USA). The equation is presented in supplementary data. The equation of the model (full factorial design) was as follows.
= + + + + + + + + + Y X X X X X X X X X X X 0 1 1 2 2 3 3 12 1 2 23 2 3 13 1 3 11 22 22 32
where 0is the intercept, 1, , and 3the main effect terms, 12, 23, and 13 the interaction terms, 11, and 22 the quadratic terms, and the error term. Each experimental condition was run in triplicate and the central point was replicated 4 times.
2.6. Analytical validation
For the analytical validation, 8 independent calibration series (each composed of 8 levels) and 8 independent validation series (each com-posed of 6 levels) were realized. Within the calibration series, the peptides SAA1α, SAA1β, SAA1γ, SAA2, SAA2α and SAA2β were present as well as the Apo-SAA, S100A8 and S100A9 proteins. Within the va-lidation series, the peptides SAA1β, SAA1γ, SAA2, SAA2α and SAA2β were present as well as the SAA1α, S100A8 and S100A9 proteins.
Each calibration series was composed of 8 levels (1, 5, 10, 50, 200, 500, 2000 and 5000 ng mL−1for SAAs peptides; 2, 10, 20, 100, 400,
1000, 4000 and 10000 ng mL−1for S100 proteins; 20, 100, 200, 1000,
4000, 10000, 40000 and 80000 ng mL−1for Apo-SAA). Each validation
series was composed of 6 levels (4, 20, 100, 500, 1250 and 5000 ng mL−1for SAA peptides except SAA1α; 8, 40, 200, 1000, 2500
and 10000 ng mL−1for S100 proteins; 50, 250, 1250, 8000, 2000 and
80000 ng mL−1for SAA1α protein). For SAA1α only, the concentration
of the generated peptide was first calculated using the quantitation curve built with SAA1α peptide in the calibration solution. Then, this concentration was transformed into the initial concentration of SAA1α protein using the digestion curve built with Apo-SAA. A statistical ap-proach based on the total error concept for validation was employed. The E.Noval software (Arlenda, Liège, Belgium) was used to assess trueness, precision, accuracy and limit of quantification of the method. Acceptance limits were set at ± 20% except for LOQ where ± 30% was accepted. The selectivity of the method was evaluated by extracting and analyzing blank bovine plasma. The suitability of bovine plasma as surrogate of human plasma was proved by spiking internal standards at a concentration of 500 ng mL−1 in both fluids (n = 5). They were
subsequently processed as described in paragraph 2.4. The peak areas obtained for both fluids were compared using Mann-Whitney t-tests (α = 0.05). The stability in the autosampler was evaluated by analyzing solutions of 500 ng mL−1of peptides regularly during 45 h. Freeze-thaw
stability was evaluated by freezing and defrosting bovine plasma so-lutions (n = 3) containing 5000 ng mL−1SAA peptides, 80000 ng mL−1
SAA1α protein and 10000 ng mL−1S100 proteins. Samples were left on
ice for 2 h to defreeze. 3 cycles were realized. To evaluate the impact of the matrix, neat standards (A) were realized at three different con-centrations (40, 400 and 4 μg mL−1) for each analyte (peptides) in a
mixture of H2O/ACN/FA (80:20:0.1, v/v). Post-extraction spiked
ma-trix (B) was realized by processing 25 μl of blank bovine plasma and reconstituting with the appropriate concentration of analyte. Pre-ex-traction spiked matrix (C) were realized by diluting stock solution to appropriate concentration in plasma and extracting 25 μl of this solu-tion using the previously described protocol. The peaks were integrated and used to calculate the matrix effect (ME), extraction recovery (ER) and process efficiency (PE) according to the following equations:
= × ME(%) B/ A 100 = × ER(%) C/ B 100 = × PE(%) C/ A 100
2.7. Choice of biological fluid
Paired plasma and serum coming from 9 RA patients and 10 controls were selected to choose the optimal fluid. Each of them was processed
in triplicate as detailed in paragraph 2.1 and injected twice in the LC-MS/MS system. Differences between groups were tested using para-metric t-tests.
2.8. Clinical investigation
The developed method was used for clinical investigation of SAA and S100 variants in various patient groups suffering from immune-mediated inflammatory diseases (IMIDs) pathologies (age and sex-paired). The study included HC (n = 62), early-onset RA (disease duration less than 6 month) (n = 14), RA with weak/moderate (2.6 ≤ DAS28≤5.1) (n = 20) or severe disease (DAS28> 5.1) (n = 12),
ankylosing spondylitis (AS) (n = 30), systemic lupus erythematous (SLE) (n = 23), systemic sclerosis (n = 20) and osteoarthritis (OA) (n = 43). Samples were randomised and processed as described in paragraph 2.1. Statistics were realized using Graphpad Prism 7 (La Jolla, CA, USA). Results were log10 transformed and Kruskal-Wallis
followed by Dunn's multiple comparisons (α = 0.05) were used for statistical comparison. Pearson's correlation coefficients and ROC curves were computed using SAS JMP software (significance tested using two-tailed t-tests, α = 0.05) using log10transformed
concentra-tions.
3. Results and discussion
The objective of this study was to evaluate the clinical interest of 8 potential biomarkers of rheumatoid arthritis, namely SAA1α, SAA1β, SAA1γ, SAA2α, SAA2β, S100A8, S100A9, and S100A12. A targeted bottom-up approach was optimized for the quantitation of those protein biomarkers, including the digestion of the proteins in proteotypic peptides and their analyses by LC-MS/MS. Special attention was paid to select peptides specific to each SAA variants, which only differ from one another by few amino acids (Table 1). An original analytical method was thus developed and validated, and then the clinical relevance of those biomarkers was investigated.
3.1. Optimization of biomarker separation
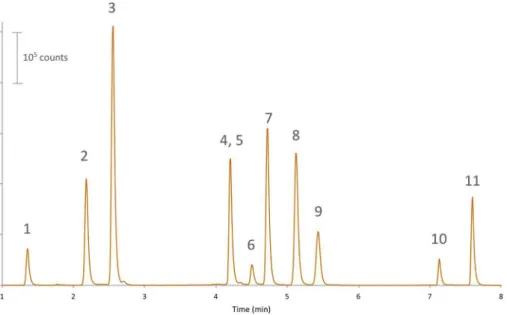
The beginning of the LC run permitted to separate SAA2β and SAA2α peptides, which was crucial to prevent cross talk since their product ion is common (Fig. 1). Then, the gradient slope increased to separate S100A8, SAA1γ, Apo-SAA, SAA1α, SAA2, and SAA1β peptides. Apo-SAA is a fusion protein whose sequence is hybrid between SAA1α and SAA2 (Table 1). It was used for quantitation purpose (see section
3.4). Despite being different SAA1γ and S100A8 peptides could not be resolved. However, their coelution was not considered as problematic since their MRM transitions were different (Supplementary data S1). The next gradient step was the most critical as SAA1α and SAA1β are isobaric and differ from SAA2 by 0.4 Da. Finally, S100A9 and SAA-tot (representing the SAA regardless of the variant) peptides were eluted. Noticeably, the presence of ammonia in the sample preparation phase did not cause deamidation to peptides containing sensitive amino acids such as asparagin (N) or glutamine except for the peptide coming from Apo-SAA, where a mass shift of +1 Da was observed on the doubly-charged precursor (+ 0.5 m/z). The y10 fragment ion used as quantifier was observed at 1089.4 instead of 1088.4 (+1 mass shift). Similarly, the y9 fragment ion used as qualified was observed at 903.4 m/z instead of 902.4 (+1 mass shift). However, this was not considered as pro-blematic since it did not hamper the quantitation process.
3.2. Optimization of sample preparation
The acidic character of the studied peptides (median of isoelectric points: 4.54) indicated that the anion-exchange sorbents would yield better extraction yields than cation-exchange ones. Consequently, am-monia (at a final concentration of 5%) was first added to the solution before loading on the SPE plate to quench the trypsin reaction and ensure the negative ionization of the peptides. The first wash solution (composed of 5% ammonia in water) removed unspecific components and the nature of the second wash solution was optimized to remove as many unwanted interferants as possible. The use of slightly acidic conditions (0.01% FA) was investigated since it could have removed weak bases and improved the overall sample clean up. However, its presence, albeit at a low concentration, was found to be detrimental to the desirability (representing the goodness of compromise between the individual responses). (Supplementary data S3B). No significant dif-ferences were observed between neutral and basic conditions hence a mixture of MeOH/H2O (80:20) was selected as second wash since it
provided the highest desirability (0.79 ± 0.04). For the elution solu-tion, a mixture of ACN/H2O/FA (85:15:2, v/v) yielded the optimal
desirability (0.88 ± 0.03) and was consequently selected for further experiments (Supplementary data S4B). Finally, the resuspension so-lution was optimized to maximise the retention of highly hydrophilic peptides (S100A12, SAA2α and SAA2β) and prevent the adsorption of hydrophobic peptides (S100A9 and SAA-tot). The presence of 0.1% TFA combined to 20% ACN was found to be the optimal conditions since TFA improved the retention of hydrophilic peptides and 20% ACN prevented the adsorption of SAA-tot peptide (Supplementary data S3C). Fig. 1. Typical chromatogram (combined MRM traces) obtained after processing of calibration solu-tion in bovine plasma and injecsolu-tion in LC-MS/MS. Peaks are unique peptides originating from S100A12 (1), SAA2β (2), SAA2α (3), S100A8 and SAA1γ (4, 5), Apo-SAA (6), SAA1α (7), SAA2 (8), SAA1β (9), S100A9 (10) and SAA-tot (11).
Finally, the resuspension solution used for further experiments was composed of ACN/H2O/TFA (80:20:0.1, v/v).
3.3. Optimization of biomarker digestion
Preliminary experiments involving different trypsin-compatible de-naturants (trifluoroethanol, solvents, heat, MS-compatible surfactants) did not significantly improve the digestion yield. However, they re-vealed that the presence of an organic solvent during tryptic digestion was required in order to prevent adsorption of peptides on surfaces and maximise their release from proteins. However, organic solvents lower the activity of trypsin [25]. DoE strategy was therefore employed to find the optimal conditions. DoE strategy was selected for optimization in this study since different proteins, having different characteristics, had to be digested. Furthermore, their signature peptides had different physico-chemical properties and some (SAA-tot and S100A9 peptides) were prone to adsorption. As a consequence, the DoE strategy permitted to optimize crucial parameters all-in-once.
As shown in Supplementary data S4, results indicate that MeOH is more desirable than ACN (desirability of 0.64 compared to 0.51, re-spectively) although ACN was more favourable for S100A9 and S100A8 proteins. Finally, the optimal conditions maximising sensitivity were 25% of MeOH combined to 17.5 μg of trypsin per sample.
3.4. Biomarker quantitation strategy
Two strategies coexist in the literature to quantitate proteins in sample in targeted bottom-up proteomics. Calibration curves can be built with the proteins (in our case, only Apo-SAA and SAA1α were commercially available) or with synthetic peptides from which the protein concentration can be subsequently deduced if the digestion step
is completed. However, this was not the case since the tryptic digestion yield of 10 μg mL−1SAA1α was calculated at 21.4 ± 0.2% (n = 3). To
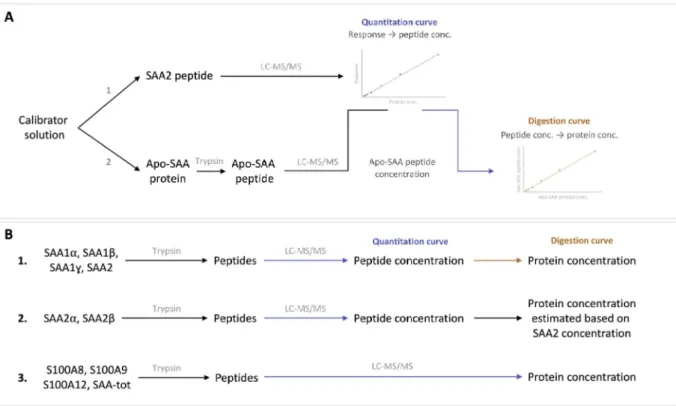
quantitate every variant at the proteins level, we developed a strategy employing the synthetic protein Apo-SAA to construct digestion curve transforming the concentration of SAA peptides in their initial protein concentration (Fig. 2A). Calibration solutions contained Apo-SAA, S100 proteins and the synthetic peptides specific for each SAA variant.
First, the concentration of the peptide generated by Apo-SAA after tryptic digestion was calculated using the calibration curve built with SAA2 peptide. The peak area of the Apo-SAA peptide was corrected by the peak area of the SAA2 internal standard prior to calculation using the calibration curve built with the peptide SAA2. Then, this con-centration (in peptide) was plotted against the initial concon-centration of Apo-SAA (protein) to construct a curve which converts a concentration of peptide in a concentration of protein. This curve could subsequently be used to transform concentrations of SAA peptides into their initial protein concentrations. Apo-SAA was employed since it differs by SAA1α by only two amino-acids thus its solubility and resistance to tryptic digestion were expected to be close to those of other SAA pro-teins. In addition, the peptide generated after digestion is almost identical to those generated by the isoforms of SAAs. As a consequence, Apo-SAA was considered as a suitable surrogate to construct this di-gestion curve. This approach was employed to quantitate SAA1α, SAA1β, SAA1γ and SAA2 (Fig. 2B). However, this strategy could not be used for SAA2α and SAA2β since the followed peptides were coming from another part of the protein and were therefore not produced at the same yield as Apo-SAA peptide. Nonetheless, given that SAA2α and SAA2β both arise from SAA2 their individual concentrations were es-timated by the following equation:
Fig. 2. Strategy employed for the quantitation of the studied proteins. (A) Construction of the digestion curve using Apo-SAA protein. The concentration of the peptide generated by the Apo-SAA protein was measured using a calibration curve built with SAA2 peptide. Then, this concentration was plotted against the initial concentration of Apo-SAA protein resulting in a digestion curve converting a concentration of peptide in a concentration of protein. (B1) strategy employed to quantitate SAA1α, SAA1β, SAA1γ and SAA2. Proteins were digested in peptide which were quantitated using their respective quantitation curves. Following this, the initial concentration of protein was calculated using the digestion curve. (B2) for SAA2α and SAA2β, the quantitation was only possible at the peptide level. The proportion of each peptide was used to estimate their absolute protein concentrations. (B3) S100A8, S100A9, S100A12 and SAA-tot were directly quantitated at the protein level owing the availability of the standard proteins.
=
+
[SAA2 protein]
[SAA2 peptide]
[SAA2 peptide] [SAA2 peptide] *[SAA2 protein]
=
+
[SAA2 protein]
[SAA2 peptide]
[SAA2 peptide] [SAA2 peptide] *[SAA2 protein]
Finally, S100 and SAA-tot concentrations were directly calculated at the protein level using a quantitation curve constructed using the synthetic proteins as calibrators. Apo-SAA protein was employed as calibrator to quantitate SAA-tot since the peptide common to all SAA variants was also generated by Apo-SAA.
3.5. Importance of the biological fluid chosen for the assay
The choice of biological fluid was investigated using paired plasma and serum coming from control (n = 10) and RA patients (n = 9). On average, concentrations were slightly higher in serum compared to plasma for SAA1α (1.45 ± 0.38 times), SAA2 (1.87 ± 0.16 times), SAA1β (2.00 ± 0.51 times) and for SAA-tot (1.63 ± 0.44 times) al-though significant differences observed between RA and patient groups were similar between plasma and serum. On the contrary, for S100A8, differences observed were significant in plasma, but not in serum. S100A9 was uniquely detected in plasma. These differences might arise due to the formation of the heterodimer calprotectin in the presence of calcium in serum. Calprotectin then self-assembles into hetero-tetramers, which was shown to be extremely protease resistant [20,26,27]. However, the chelation of calcium by EDTA in plasma prevents the formation of calprotectin thereby consequently allowing the digestion of S100A8 and S100A9. Interestingly, a recent study re-vealed that calprotectin should also preferably be measured in EDTA-plasma when using ELISA because its concentration is overestimated in serum due to the release of calprotectin by neutrophils when coagula-tion occurs [28]. S100A8/S100A9 should therefore be measured in plasma regardless of the measurement technique employed. For LC-MS/ MS, this is due to the fact that trypsin cannot generate the signature
peptide in serum, although the concentration is in theory paradoxically higher than in plasma. For ELISA, this is due to the overestimation of calprotectin due to its massive release by neutrophils, which affects the quality of the final results. In the light of our results, plasma was se-lected for the assay of the biomarkers of interest.
3.6. Analytical validation
Validation was performed at protein level for S100A8, S100A9, SAA1α, SAA-tot, and at the peptide level for SAA1β, SAA1γ, SAA2, SAA2α, and SAA2β. Since SAA1α was the only commercially available protein, it was used to validate the quantitation strategy detailed in paragraph 3.3. Apo-SAA could not be employed in the validation since it is used to construct the digestion from which the concentrations of proteins are deduced. As shown in Supplementary data S4, no sig-nificant interferences were detected at the retention time of the pep-tides of interest when compared to blank bovine plasma therefore en-suring the selectivity of the method. Moreover, the stability inside the thermostated autosampler was found satisfactory since no significant degradation could be observed after up to 45 h stay (corresponding to the time needed to process a complete 96-well plate) in the tray. Additionally, the freezing/defrosting of the samples did not impact the results. Calibration solutions for SAA1α were built using signature peptide, and validation solutions were built with the protein. The re-sulting accuracy profile of SAA1α (S5) proves the reliability of the quantitation strategy based on a digestion curve to access the initial concentration of protein. Validation results concerning trueness, pre-cision, accuracy, matrix effect, recovery, response function, linearity and stability are presented in supplementary data S5. The quantitation of S100A12 did not match acceptance criteria and S100A12 results were therefore not further considered for the study. For the other considered proteins, the maximum observed relative bias was 9.3% and the maximum precision variability was 19.4%. As beta-expectation tolerance limits never exceeded acceptance limits ( ± 20% except LOQ where ± 30% was accepted), the method was considered as accurate over the tested dosing range for the quantitation of S100A8, S100A9, and SAA variants.
As shown inFig. 3, no significant interferences were detected at the Fig. 3. Chromatograms showing the overlay of spe-cific transition after injection of QC solution. Injected concentrations were 4 ng mL−1for SAA1β, SAA1γ,
SAA2, SAA2α and SAA2β (peptides); 50 ng mL−1for
SAA1α and SAA-tot (proteins) and 8 ng mL−1 for
S100A8 and S100A9 (proteins) (blue trace) and blank bovine plasma (orange trace). Traces are extracted MRM transitions. (For interpretation of the refer-ences to colour in this figure legend, the reader is referred to the Web version of this article.)
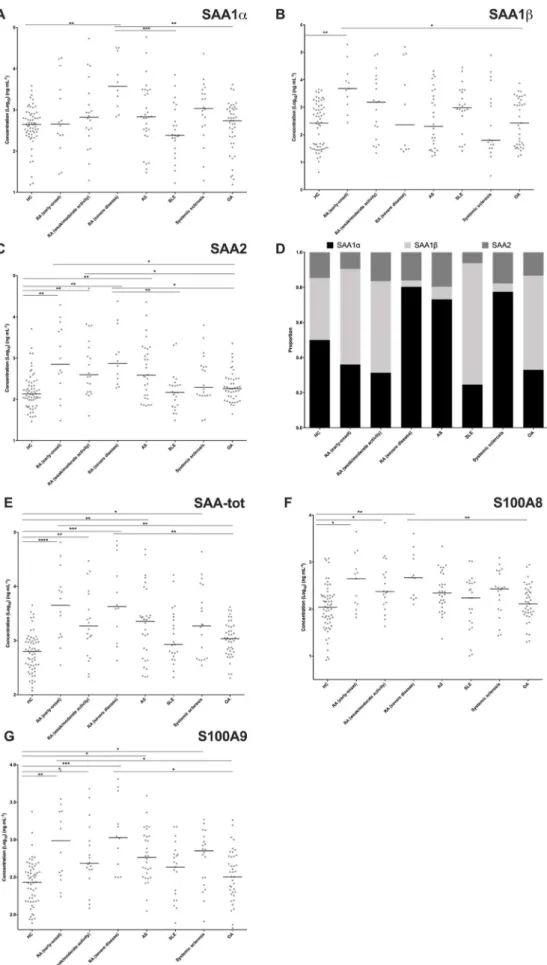
Fig. 4. Evolution of concentration of studied proteins sorted by pathology. (A) SAA1α; (B) SAA1β; (C) SAA2; (D) proportion of each isoform of SAA; (E) SAA-tot; (F) S100A8 and (G) S100A9. Bars represent median value. * represents p-value < 0.05; ** (p-value < 0.01); *** (p-values < 0.001) and **** (p-value < 0.0001) (Kruskal-Wallis followed by Dunn's test).
retention time of the peptides of interest when compared to blank bo-vine plasma therefore ensuring the selectivity of the method. Bobo-vine plasma was considered as a suitable surrogate matrix for human plasma since no significant differences in terms of peak areas of the internal standards were observed between bovine and human plasma groups. Results are presented in S5H. Calibration and validation solutions were therefore mixed with bovine plasma prior tryptic digestion to ensure
that calibrators were processed similarly to patient samples and hence ensure the reliability of the results generated for patients.
3.7. Clinical investigation
As shown inFig. 4E, the clinical investigation showed that SAA-tot concentrations were significantly higher in the three subsets of RA
patients, early-onset, weak/moderate and severe disease activity, in AS and in systemic sclerosis compared to HC. Similarly to CRP, SAA-tot levels were not increased in SLE [29]. SAA-tot levels also significantly increased in RA, early-onset and severe disease activity compared to OA patients.
Concerning SAA variants, significant differences were observed between groups for SAA1α, SAA1β, and SAA2. SAA1α levels were only significantly increased in RA patients with severe disease activity compared to HC, whereas not significantly different in RA early-onset and RA with weak/moderate disease activity (Fig. 4A), contrasting with what has been observed with SAA-tot levels in these three categories of RA compared to HC. They were also significantly higher in RA with severe disease activity than in SLE and OA (Fig. 4A). On the contrary, SAA1β levels were only increased in RA early-onset compared to HC and OA patients, but surprisingly not different than the levels observed in SLE (Fig. 4B). Opposite to SAA1α, SAA1β levels were not sig-nificantly different in RA patients with weak/moderate or severe dis-ease activity compared to HC (Fig. 4B, Supplementary data S6). Inter-estingly, a statistically significant negative correlation was observed between SAA1α and SAA1β levels in RA early-onset (r = −0.41) and in OA (r = −0.56) patients (Fig. 5). The weight of SAA1α, representing the contribution of SAA1α in the total SAA response (sum of con-centration of SAA1α, SAA1β and SAA2), varied among groups (min-max 32–80%) (Fig. 4D, Supplementary data S6). The weight of SAA1β also varied similarly (min-max 4–69%) (Fig. 4D, Supplementary data S6). SAA1α made up to 80% (median) of the total concentration of SAA variants in RA with severe disease activity, while SAA1β represented only 4% (median). Although the SAA response remains weak in SLE, SAA1β made up to 69% (median) of the total concentration of SAA variants while SAA1α represented only 25% (median). SAA1γ con-centrations remained constant in all the groups (Supplementary data S6).
SAA2 levels were significantly higher in the 3 categories of RA as compared to HC (Fig. 4C, Supplementary data S6). SAA2 was also significantly increased in RA (early-onset) and RA (severe disease)
compared to SLE and OA patients, implying that SAA2 might represent a marker of interest to differentiate RA from related pathologies. SAA2 levels were highly correlated to SAA1β, S100A8, and S100A9 at all stages of RA (Fig. 5). Within SAA2, SAA2α was the dominant subtype compared to SAA2β, the latter being detected at a constant level in each group (Supplementary data S6). SAA2α levels were also significantly higher in the three subsets of RA and in AS patients compared to HC (Supplementary data S6).
As a conclusion, the acute phase response was not only quantita-tively different among the pathologies studied, but also qualitaquantita-tively by different representation of isoforms. Indeed, SAA2 (mainly SAA2α subtype) concentrations were increased in the 3 subsets of RA patients, early-onset, weak/moderate and severe disease activity, while SAA1β only increased in RA early-onset and SAA1α only increased in RA pa-tients with severe disease activity. Importantly, the weights of SAA1α and SAA1β levels in the SAA response were different according to the pathologies studied. Noticeably, no correlation with SAA1α was ob-served in any diseases. Compared to the literature, similar observations were realized by Kim et al. concerning SAA1γ and SAA2β for lung cancer patients, for which SAA1γ was mostly not detected and SAA2β significantly less present than SAA2α [6]. Even if the pathophysiolo-gical relevance of these quantitative and qualitative characteristics of the SAA response remains unknown, the significant negative correla-tion observed between SAA1α and SAA1β levels in RA early-onset (and OA patients) suggests the existence of still unknown regulatory me-chanisms in these diseases.
Alarmins S100A8 and S100A9 concentrations were highly corre-lated in all categories studied, including HC (Fig. 5and Supplementary data S6), due to their coexistence under the form of a dimer in phy-siological media. Their concentrations were significantly increased only in the 3 subsets of RA patients, compared to HC (Fig. 4F). S100A8 levels in RA with severe disease activity were also significantly higher than in OA patients (Fig. 4F). Lastly, S100A9 levels of RA patients with early-onset and with severe disease activity patients were also significantly higher than in SLE and in OA patients (Fig. 4G). Levels of alarmins were
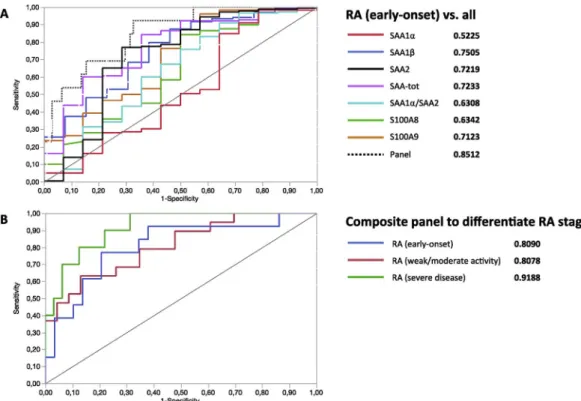
Fig. 6. Representation of ROC curves. (A) Discrimination of RA (early-onset) from other IMID pathologies using biomarkers taken individually and the composite panel. (B) Ability of the same composite panel to correctly assign the severity grade of RA. AUCs are indicated in bold and represent how well the model is performing at distinguishing between groups.
unrelated to any of the SAA variants levels in controls (Fig. 5). On the contrary, complex correlations were observed in diseases. First, their concentrations were strongly correlated with SAA2 concentrations in the 3 stages of RA, moderately correlated in SLE, systemic sclerosis, and in AS patients and not in OA patients. Second, their concentrations were strongly correlated to SAA1β in established RA, whether low/moderate or severe disease activity. Third, curiously, SAA1α, a major component of the acute phase response in RA with severe disease activity, is never correlated with S100A8/9 levels neither in RA, nor in any others dis-eases. Fourth, S100A8 and S100A9 levels were significantly correlated with SAA-tot in RA patients with weak/moderate or with severe disease activity as well as in OA patients (Fig. 5) whereas S100A9 alone did in early-onset RA. These observations suggest reciprocal influence of regulatory mechanisms between SAA variants and S100A8/A9 proteins. This elevation of S100A8 and S100A9 levels in plasma RA in the present work contrasts with other work that identified S100A8 and S100A9 in the serum of RA patients at equal levels as compared to OA, AS and SLE patients [30]. Differences may be explained either by differences in the proteomic technique and the biological fluids used. This study confirms previous results obtained by our group where S100A8, S100A9, and SAA protein levels were significantly higher in RA sera (and in AS and psoriatic arthritis) as compared to HC using semi-quantitative SELDI-TOF-MS [3]. In addition, this work extends to the isoforms the corre-lation previously highlighted between S100A8 and S100A9 levels and SAA variants found in the serum of RA, AS and psoriatic arthritis pa-tients.
Finally, the ability of each biomarker to discriminate between RA (early-onset) and other studied pathologies (considered as non-RA) was tested with ROC curves. Curves and individual area under curves (AUC) for each biomarker are given in Fig. 6A. The AUC of the panel was 0.8512. The probability of correctly classify patients was higher with the ratio of SAA1α/SAA2 (AUC 0.8512) than without (AUC 0.7848). Interestingly, the composite panel of biomarkers increased the prob-ability of correctly classify patients compared to the best biomarker (SAA-tot) considered individually, thereby underlying the interest of selectively quantitating SAA variants to differentiate between RA at early-onset and other related inflammatory pathologies.
The panel including the ratio of SAA1α/SAA1β was introduced to discriminate the three grades of RA. AUC were respectively 0.8090, 0.8078, and 0.9188 for RA (early-onset), RA (weak/moderate activity), and RA (severe disease) (Fig. 6B). Without introducing the ratio of SAA1α/SAA1β in the panel, the AUC were respectively 0.7454, 0.7712, and 0.8438 for RA (early-onset), RA (weak/moderate activity), and RA (severe disease). The ratio of SAA1α/SAA1β added to the previous panel therefore significantly enhanced the probability of classify pa-tients in the correct severity stage. Although in this case clinical signs might be sufficient to differentiate the three stages of RA, it is inter-esting to notice that this classification can be achieved based solely on the quantitation of the biomarkers. However, this needs to be con-firmed on larger cohorts to train and confirm the classification algo-rithm.
These results suggest that SAA isoforms, especially SAA2 and
4. Conclusion and perspectives
In conclusion, we have developed an assay to selectively quantitate SAA variants and alarmins S100A8 and S100A9 using tryptic digestion, SPE and LC-MS/MS. A novel approach was employed to access the absolute concentrations of non-commercially available proteins. The method was developed using DoE and subsequently validated according to regulations. Successively, SAA variants and S100A8/S100A9 were studied in plasma of HC and patients suffering from several in-flammatory diseases. Results indicated that SAA-tot levels were sig-nificantly higher in systemic inflammatory pathologies such in the 3 subsets of RA patients, in AS, and in systemic sclerosis than in OA pa-tients or in HC. Interesting profiles were discovered in RA papa-tients where quantitative and qualitative differences among SAA variants were highlighted. SAA2 (mainly SAA2α subtype) concentrations were increased in the 3 subsets of RA patients, early-onset, weak/moderate and severe disease activity, while SAA1β only increased in RA early-onset and SAA1α only increased in RA patients with severe disease activity. The weights of SAA1α and SAA1β levels in the SAA response were different according to the pathologies studied. Compared to con-trols, S100A8 and S100A9 levels were exclusively increased in the 3 subsets of RA patients. Further, while S100A8 and S100A9 levels were unrelated to any of the SAA variants levels in controls, complex cor-relations were observed with SAA1β, SAA2 and SAA-tot in diseased patients. Noticeably, no correlation with SAA1α was observed in any diseases. These proteins performed better at discriminating RA (early-onset) than other IMID when in composite panel as compared to pro-teins put individually. These results underline the benefits of using LC-MS/MS to discriminate closely-related isoforms, which would not have been differentiated otherwise. The careful optimization of the protocol allowed to analyze these proteins in a single method thus taking ad-vantage of the multiplexed capacities of LC-MS/MS.
Altogether, these results highlight the added-value of the selective quantitation of SAA variants in the context of RA and pave the way for treatment follow-up studies and theranostic applications since the ex-pression of the studied biomarkers seem to be related to the severity of the pathology. For instance, regular monitoring of SAA and S100 pro-teins could provide insights on the effectiveness of the given treatment which could be modified and adapted accordingly if needed.
Conflict of interest disclosure
The authors declare no conflict of interest.
Funding support
This work was supported by the National Fund for Scientific Research (FNRS), the Fondation Léon Frédéricq.
Acknowledgements
[2] D. De Seny, M. Fillet, M.A. Meuwis, P. Geurts, L. Lutteri, C. Ribbens, V. Bours, L. Wehenkel, J. Piette, M. Malaise, Discovery of new rheumatoid arthritis bio-markers using the surface‐enhanced laser desorption/ionization time‐of‐flight mass spectrometry ProteinChip approach, Arthritis Rheum. 52 (12) (2005) 3801–3812. [3] D. De Seny, M. Fillet, C. Ribbens, R. Marée, M.-A. Meuwis, L. Lutteri, J.-P. Chapelle, L. Wehenkel, E. Louis, M.-P. Merville, Monomeric calgranulins measured by SELDI-TOF mass spectrometry and calprotectin measured by ELISA as biomarkers in ar-thritis, Clin. Chem. 54 (6) (2008) 1066–1075.
[4] M. De Buck, M. Gouwy, J. Ming Wang, J. Van Snick, G. Opdenakker, S. Struyf, J. Van Damme, Structure and expression of different serum amyloid A (SAA) var-iants and their concentration-dependent functions during host insults, Curr. Med. Chem. 23 (17) (2016) 1725–1755.
[5] C. Paret, Z. Schön, A. Szponar, G. Kovacs, Inflammatory protein serum amyloid A1 marks a subset of conventional renal cell carcinomas with fatal outcome, Eur. Urol. 57 (5) (2010) 859–866.
[6] Y.J. Kim, S. Gallien, V. El‐Khoury, P. Goswami, K. Sertamo, M. Schlesser, G. Berchem, B. Domon, Quantification of SAA1 and SAA2 in lung cancer plasma using the isotype‐specific PRM assays, Proteomics 15 (18) (2015) 3116–3125. [7] D. de Seny, G. Cobraiville, E. Charlier, S. Neuville, N. Esser, D. Malaise, O. Malaise,
F.Q. Calvo, B. Relic, M.G. Malaise, Acute-phase serum amyloid a in osteoarthritis: regulatory mechanism and proinflammatory properties, PLoS One 8 (6) (2013) e66769.
[8] M. Connolly, A. Marrelli, M. Blades, J. McCormick, P. Maderna, C. Godson, R. Mullan, O. FitzGerald, B. Bresnihan, C. Pitzalis, Acute serum amyloid A induces migration, angiogenesis, and inflammation in synovial cells in vitro and in a human rheumatoid arthritis/SCID mouse chimera model, J. Immunol. (2010) ji_0902941. [9] G. Cunnane, S. Grehan, S. Geoghegan, C. McCormack, D. Shields, A. Whitehead,
B. Bresnihan, O. Fitzgerald, Serum amyloid A in the assessment of early in-flammatory arthritis, J. Rheumatol. 27 (1) (2000) 58–63.
[10] B. Targońska-Stępniak, M. Majdan, Serum amyloid A as a marker of persistent in-flammation and an indicator of cardiovascular and renal involvement in patients with rheumatoid arthritis, Mediat. Inflamm. (2014) 2014.
[11] E. Cocco, S. Bellone, K. El-Sahwi, M. Cargnelutti, F. Casagrande, N. Buza, F. Tavassoli, E. Siegel, I. Visintin, E. Ratner, Serum amyloid A (SAA): a novel bio-marker for uterine serous papillary cancer, Br. J. Canc. 101 (2) (2009) 335. [12] S. Urieli-Shoval, Z. Finci-Yeheskel, S. Dishon, D. Galinsky, R.P. Linke, I. Ariel,
M. Levin, I. Ben-Shachar, D. Prus, Expression of serum amyloid a in human ovarian epithelial tumors: implication for a role in ovarian tumorigenesis, J. Histochem. Cytochem. 58 (11) (2010) 1015–1023.
[13] J.-Y. Wang, Y.-Z. Zheng, J. Yang, Y.-H. Lin, S.-Q. Dai, G. Zhang, W.-L. Liu, Elevated levels of serum amyloid A indicate poor prognosis in patients with esophageal squamous cell carcinoma, BMC Canc. 12 (1) (2012) 365.
[14] M. Kimura, Y. Tomita, T. Imai, T. Saito, A. Katagiri, Y. Ohara‐Mikami, T. Matsudo, K. Takahashi, Significance of serum amyloid A on the prognosis in patients with renal cell carcinoma, Cancer 92 (8) (2001) 2072–2075.
[15] H.-J. Sung, S.-A. Jeon, J.-M. Ahn, K.-J. Seul, J.Y. Kim, J.Y. Lee, J.S. Yoo, S.-Y. Lee, H. Kim, J.-Y. Cho, Large-scale isotype-specific quantification of Serum amyloid A 1/ 2 by multiple reaction monitoring in crude sera, J. Proteom. 75 (7) (2012) 2170–2180.
[16] L. De Rycke, D. Baeten, D. Foell, E. Kruithof, E.M. Veys, J. Roth, F. De Keyser, Differential expression and response to anti‐TNFα treatment of infiltrating versus resident tissue macrophage subsets in autoimmune arthritis, J. Pathol.: J. Pathol. Soc. Great Britain Ireland 206 (1) (2005) 17–27.
[17] M. Frosch, A. Strey, T. Vogl, N.M. Wulffraat, W. Kuis, C. Sunderkötter, E. Harms, C. Sorg, J. Roth, Myeloid‐related proteins 8 and 14 are specifically secreted during interaction of phagocytes and activated endothelium and are useful markers for
monitoring disease activity in pauciarticular‐onset juvenile rheumatoid arthritis, Arthritis Rheum.: Off. J. Am. Coll. Rheumatol. 43 (3) (2000) 628–637. [18] K. Sunahori, M. Yamamura, J. Yamana, K. Takasugi, M. Kawashima, H. Yamamoto,
W.J. Chazin, Y. Nakatani, S. Yui, H. Makino, The S100A8/A9 heterodimer amplifies proinflammatory cytokine production by macrophages via activation of nuclear factor kappa B and p38 mitogen-activated protein kinase in rheumatoid arthritis, Arthritis Res. Ther. 8 (3) (2006) R69.
[19] D. Foell, H. Wittkowski, T. Vogl, J. Roth, S100 proteins expressed in phagocytes: a novel group of damage‐associated molecular pattern molecules, J. Leukoc. Biol. 81 (1) (2007) 28–37.
[20] J.R. Stephan, E.M. Nolan, Calcium-induced tetramerization and zinc chelation shield human calprotectin from degradation by host and bacterial extracellular proteases, Chem. Sci. 7 (3) (2016) 1962–1975.
[21] N. Lügering, R. Stoll, T. Kucharzik, K.W. Schmid, G. Rohlmann, G. Burmeister, C. Sorg, W. Domschke, Immunohistochemical distribution and serum levels of the Ca2+-binding proteins MRP8, MRP14 and their heterodimeric form MRP8/14 in Crohn's disease, Digestion 56 (5) (1995) 406–414.
[22] P.L. van Lent, L. Grevers, A. Blom, A. Sloetjes, J.S. Mort, T. Vogl, W. Nacken, W. Van Den Berg, J. Roth, Myeloid related proteins S100A8/S100A9 regulate joint in-flammation and cartilage destruction during antigen-induced arthritis, Ann. Rheum. Dis. (2007).
[23] Y.-S. Chen, W. Yan, C.L. Geczy, M.A. Brown, R. Thomas, Serum levels of soluble receptor for advanced glycation end products and of S100 proteins are associated with inflammatory, autoantibody, and classical risk markers of joint and vascular damage in rheumatoid arthritis, Arthritis Res. Ther. 11 (2) (2009) R39. [24] T. Vogl, C. Pröpper, M. Hartmann, A. Strey, K. Strupat, C. van den Bos, C. Sorg,
J. Roth, S100A12 is expressed exclusively by granulocytes and acts independently from MRP8 and MRP14, J. Biol. Chem. 274 (36) (1999) 25291–25296. [25] M.A. Kuzyk, D.B. Hardie, J. Yang, D.S. Smith, A.M. Jackson, C.E. Parker,
C.H. Borchers, A quantitative study of the effects of chaotropic agents, surfactants, and solvents on the digestion efficiency of human plasma proteins by trypsin, J. Proteome Res. 9 (10) (2010) 5422–5437.
[26] W. Nacken, C. Kerkhoff, The hetero‐oligomeric complex of the S100A8/S100A9 protein is extremely protease resistant, FEBS Lett. 581 (26) (2007) 5127–5130. [27] M. Riva, Z. He, E. Källberg, F. Ivars, T. Leanderson, Human S100A9 protein is
stabilized by inflammatory stimuli via the formation of proteolytically-resistant homodimers, PLoS One 8 (4) (2013) e61832.
[28] H.H. Nordal, M.K. Fagerhol, A.-K. Halse, H.B. Hammer, Calprotectin (S100A8/A9) should preferably be measured in EDTA-plasma; results from a longitudinal study of patients with rheumatoid arthritis, Scand. J. Clin. Lab. Invest. 78 (1–2) (2018) 102–108.
[29] S. Gaitonde, D. Samols, I. Kushner, C‐reactive protein and systemic lupus er-ythematosus, Arthritis Care Res. 59 (12) (2008) 1814–1820.
[30] A. Baillet, C. Trocmé, S. Berthier, M. Arlotto, L. Grange, J. Chenau, S. Quétant, M. Sève, F. Berger, R. Juvin, Synovial fluid proteomic fingerprint: S100A8, S100A9 and S100A12 proteins discriminate rheumatoid arthritis from other inflammatory joint diseases, Rheumatology 49 (4) (2010) 671–682.
[31] K.D. Deane, C.I. O'Donnell, W. Hueber, D.S. Majka, A.A. Lazar, L.A. Derber, W.R. Gilliland, J.D. Edison, J.M. Norris, W.H. Robinson, The number of elevated cytokines and chemokines in preclinical seropositive rheumatoid arthritis predicts time to diagnosis in an age‐dependent manner, Arthritis Rheum. 62 (11) (2010) 3161–3172.
[32] H. Liao, J. Wu, E. Kuhn, W. Chin, B. Chang, M.D. Jones, S. O'neil, K.R. Clauser, J. Karl, F. Hasler, Use of mass spectrometry to identify protein biomarkers of disease severity in the synovial fluid and serum of patients with rheumatoid arthritis, Arthritis Rheum. 50 (12) (2004) 3792–3803.