HAL Id: hal-00877868
https://hal.archives-ouvertes.fr/hal-00877868
Submitted on 29 Oct 2013
HAL is a multi-disciplinary open access
archive for the deposit and dissemination of
sci-entific research documents, whether they are
pub-lished or not. The documents may come from
teaching and research institutions in France or
abroad, or from public or private research centers.
L’archive ouverte pluridisciplinaire HAL, est
destinée au dépôt et à la diffusion de documents
scientifiques de niveau recherche, publiés ou non,
émanant des établissements d’enseignement et de
recherche français ou étrangers, des laboratoires
publics ou privés.
Crosstalk analysis in complex aeronautical bundle
Charles Jullien, Philippe Besnier, Michel Dunand, Isabelle Junqua
To cite this version:
Charles Jullien, Philippe Besnier, Michel Dunand, Isabelle Junqua. Crosstalk analysis in complex
aeronautical bundle. EMC Europe 2013, Sep 2013, Bruges, Belgium. pp.Page 253-258. �hal-00877868�
Crosstalk analysis in complex aeronautical bundle
Charles Jullien
(2), Philippe Besnier
(1)Université Européenne de Bretagne(1), INSA, IETR, UMR CNRS 6164,
Rennes, FRANCE [email protected]
Michel Dunand
(2) Dept. R&T (2) LABINAL/Safran Engineering ServicesVillemur sur Tarn, FRANCE
Isabelle Junqua
(3)ONERA/DEMR/CEM ONERA – The French Aerospace Lab,
F-31055, Toulouse, France
Abstract— An analysis of crosstalk inside a complex aeronautical
bundle from an experimental and from a numerical point of view is proposed. The numerical model is built as a succession of uniform transmission lines generated randomly. Modeling of the geometrical pattern of twisted pairs is included. Crosstalks between these twisted pairs and single wires inside the bundle are measured and computed. In order to save computation time, a simplified model of the bundle is developed and validated.
Keywords-component; Cable Bundle; Crosstalk; Multiconductor Transmission Line; Statistical; Random; Simplified model
I. INTRODUCTION
With the increasing use of composite materials in aircrafts, EMC requirements and especially internal coupling in bundles must be re-examined. Indeed, these harnesses include a large number of functions performed by various cable types and in particular twisted cables and non-shielded twisted pair cables. These cables are very well known to be a potential solution for reducing electromagnetic interference, but their effect depends on various parameters such as their relative position within a bundle and arrangement of cable extremities.
Since the late 70’s, important theoretical work has been done to model twisted pair cables. Since the end of the 80’s, theoretical and numerical models are focused on multi-conductor harnesses. We may first mention the work done to describe distributions of multiconductor interconnections based on the electromagnetic topology principles [1-3]. This theory splits the complex problem into sub-elementary problems and uses the equations of transmission line theory to handle calculation of electromagnetic interactions in bundles. Since the late 90’s, modeling the effects of non-uniformity in bundles to consider interlacing and twisting has become essential to correctly evaluate electromagnetic interactions on realistic geometries of cables bundles.
ONERA has developed a software based on the formalism of Electromagnetic Topology [4], named CRIPTE. It enables to build up the representation of a cable network as a topological network composed of tubes (short uniform transmission line) and junctions (that connect tubes between them and terminal loads). Each tube is characterized by matrices of per unit length (p.u.l.) electrical parameters, namely the p.u.l. resistance (R), inductance (L), conductance (G) and capacitance (C) matrices. These (RLGC) parameters are derived from the geometrical description of each conductor inside the bundle and their electrical features by solving the Laplace equation. Geometry
of cross sections of bundles can be randomly generated as in the TWISTCAB tool presented later on.
A study of a simple case with a non-shielded twisted pair cable (TPC) and a victim wire has shown that the behavior of the current resulting from the coupling between these two cables is very specific and can be simply explained [5,6]. This study led to the development of a simplified model to reduce the size of the topological network by averaging each term of p.u.l. matrices along the non-uniform bundle. Here, in this paper, we investigate crosstalk in a more complex configuration of bundles. We first designed and set up a complete test bench to handle a very large number of cables. This test bench enabled to collect various crosstalk measurement results. Second, we had to find a way to build up a reference model, looking for the best possible agreement with measurements. Then we investigated a possible validation of the previously mentioned simplified model at the scale of such a large bundle.
After a presentation of the complex bundle (Section II), we describe the test bench. Measurements are gathered in Section III. These measurements refer to current induced on a victim single cable considering an incident interference as a differential voltage generator on unshielded twisted pair cables. Then we model the whole bundle and simulate the test bench to have reference results. The reference model is introduced in section IV. Finally we discuss in Section V the application and validation of the simplified model to reduce the time computing and data storage as in [6].
II. DESCRIPTION OF CASE STUDY
The complex bundle must fulfill different requirements: It has to be built by an aeronautical harness
manufacturer like LABINAL to be representative of avionic technology.
Aeronautical connectors are used to ensure good contact between the base and the back shell.
It has to be composed of different types of twisted cables and single wires to take into account the diversity of conductors as in a real bundle.
Consequently, the selected bundle manufactured by LABINAL (Fig. 1) is made of 41 composed cables:
From AWG 24 to 18 for copper cables and from AWG 24 to 20 for aluminum cables as found in sensitive harnesses.
32 cables are single wires, 5 non-shielded twisted pair cables (3 different pitches: two with 67twists/m, two with 50twists/m and one with 50twists/m) and 4 non-shielded twisted quadrifilar cables with a pitch of 25twists/m, that is to say 58 elementary conductors (or 41 composed cables).
Length is arbitrary fixed to 3m to limit the extension of the test bench.
Each conductor is identified by labels at its extremities. In addition; tyraps are placed along the bundle to keep the compactedness.
Aeronautical connectors have been included at each extremity.
Figure 1. Picture of the complex bundle composed of 58 cables
We have chosen to analyze 9 crosstalk configurations between 3 twisted pair cables and 3 single wires, examining the current induced on each single wire for a differential excitation on one of the twisted pairs.
The twisted cables are ended by differential 100Ω loads at each extremity and the single cables are ended by 50Ω loads connected to the ground plane. Other cables are loaded by resistances which have been evaluated by taking into account aircraft manufacturer rules. Under these considerations, 3 groups of loads have been defined:
R < 5Ω, low impedance circuits, R is set to a short-circuit,
5Ω < R < 29Ω, R is set to 10Ω R > 29Ω R is set to 50Ω
The bundle and its connectors are finally installed on the test bench above a metallic ground plane (Dimensions: 3.500 x 0.750 x 0.003m) and between 2 metallic equipment boxes in which neighboring cables are connected to the pre-defined
loads, the twisted pair and victim single wire to SMA connections as shown in Fig.2.
Figure 2. Schematic of the bench for the complex bundle
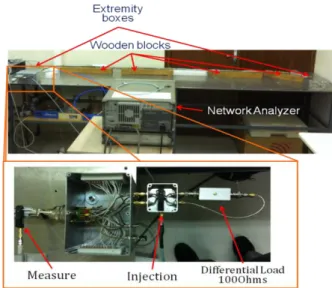
Instrumentation boxes are connected to the equipment boxes. They include a current clamp which is used to inject a pure differential source with no common mode current noise on the twisted pair, terminal impedances on cables under study (a differential 100Ohm for the twisted pair and 50Ohm for the victim single cable) as shown in Fig. 3.
Figure 3. Description of the experimental bench
III. MEASUREMENTS OF CROSSTALKS BETWEEN TWISTED PAIRS AND SINGLE WIRES
Considering a differential injection via a current clamp on a twisted pair, 2 types of measurements have been performed:
- Measurement of the common mode current on the twisted pair. This measure enables to fully control the injection.
- Measurement of the current induced on a single wire which characterizes crosstalk between the twisted pair and the single wire.
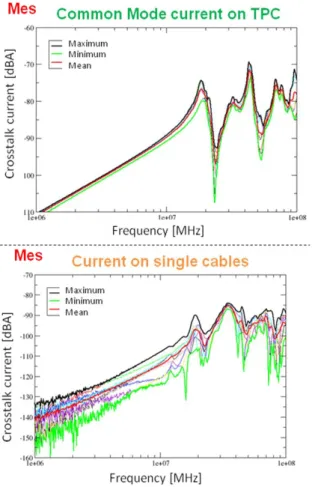
These measurements are carried out with a network analyzer as B/A where A and B are respectively connected to the injection current clamp and to the receiving current clamp. The frequency range is 1MHz to 100MHz due to measurement constraints. Fig. 4 illustrates the variation of the common mode current on the twisted pair cable and the crosstalk current for all coupling configurations measured between each of the 3 TPC and the 3 victim cables, therefore 9 induced current curves (versus frequency) in total. Maximal, minimal and mean values of these currents have been extracted from this set of data.
Figure 4. Measurement of common mode currents on twisted pairs and crosstalk current on single cables for the 9 coupling configurations from TPC
to victim cables
The common mode current on the twisted pair which carries the electromagnetic source is quite constant for all twisted pairs inside the bundle in the whole frequency range. Induced currents on victim cables follow the same pattern as a function of the frequency.
The distribution of the currents induced on victim cables is typical of a crosstalk between a TPC and a victim wire. The
different levels of current between configurations can be explained by geometrical considerations and relative positions between the twisted pair and the single cable inside the bundle.
IV. NUMERICAL MODELLING AND RESULTS
Bundle Model
The model of the bundle as a succession of uniform transmission lines represented as tubes in the CRIPTE network is built in 2 steps. Firstly, a cross section of the bundle is randomly generated by TWISTCAB: Each cable is randomly placed in free space respecting a constraint of non-superimposition of cables and a constraint of compactedness of the bundle [7]. In this first geometry, TWISTCAB takes into account the fact that a pair is twisted by considering a bulk volume around it for future twisting as in Fig. 5.
Figure 5. First geometry of the complex bundle
The second step consists in generating the following geometries. In these geometries, we take into account only the twist of twisted cables. We made the hypothesis that other cables could be modeled as straight cables and are therefore located at the same positions in all cross sections. It had been shown in [6] by a convergence study that a twist may be discretized as a succession of 8 uniform transmission line sections (or tubes), each one being associated with its uniform cross-section geometry. Here, there are 4 different pitches of twisting, defined for 1m of cable. Considering that the minimum number of discretization has to be applied for the smallest pitch (67 twists/m), 536 geometries are necessary to model 1m of the bundle. The last 2m can be modeled with the same regular pattern.
Finally let us note that resistive and conductive losses have been introduced as R and G per unit length parameters.
Bench Model
The CRIPTE software has been used to model the test bench. The minimal topological network would be made of 1608 tubes (536x3). But in order to reduce the computation time, the notion of compaction available in the software has been exploited. Indeed, the software can compact a network as
a “black box” to give an equivalent junction characterized by its S-parameters and which can be re-used in any network. Here, two levels of compaction were considered:
The first level consists in computing 54 equivalent junctions.
At a second level we split again the remaining network to compute 9 equivalent junctions.
These 9 equivalent junctions represent 1m of the bundle. The final network is composed of 27 (3x9) equivalent junctions to model the bundle on the ground plane and 16 tubes to model extremity boxes (all loads and source) as illustrated in Fig. 6.
Figure 6. Principle of compacting and final network
The differential injection via the current clamp in the experimentation is modeled in the topological network as a localized voltage generator applied on one wire of the twisted pair. This excitation is labeled on the red-colored tube in Fig. 6.
Simulation and results
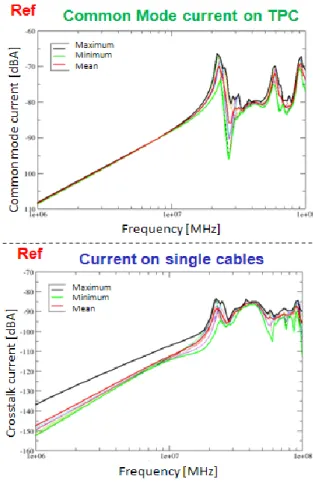
As in the experimentation, common mode current on the twisted pair carrying the source and induced current on the single victim wire are computed between 1MHz and 100MHz at one extremity of the bundle. 9 crosstalk situations are also computed for each coupling between the 3 twisted pair cables and the 3 victim cables. Maximal, minimal and mean values over this set of data are plotted on Fig. 7.
Figure 7. Computation of common mode current on twisted pair cables and of current on victim single cables
The behavior and levels of the current are similar in simulations and measurements. The level of crosstalk current is the same for maximum and minimum value. The computed and measured mean induced current on the victim single cable are slightly different in terms of magnitude. Finally, one can note some discrepancies in the resonance domain. But these similarities between experimental and simulation results show that it is not necessary to represent the random position of conductors in this case of coupling.
Difficulties
Even if the modeling of this test case can be considered as very satisfactory in terms of results and comparisons to measurements, two main difficulties appeared:
Computing all tubes has taken 5.6 days to get resistive, conductive, capacitive and inductive matrices. The two levels of compacting lasted 2.4 days. Finally each simulation required 1h for the computation of the last network to obtain the crosstalk results. All these calculus are made on a computer using CPU Pentium 4 3.4GHz and 1Go RAM.
The storage of all tubes represents 8Go on HDD and all results of compacting networks and final networks need 500Mo.
Let us remember that the bundle under study is only 3m long and is made of 58 elementary conductors. In aeronautical, harnesses can be composed of more than 300 cables and can reach 30m long which would lead to huge networks and unrealistic computation time. These difficulties can be revised by reducing the number of cables or decreasing the number of tubes. Here, the second solution has been considered as a possible trail of simplification.
V. SIMPLIFIED MODEL APPROACH
A non-negligible part of computational time is spent in operations of compaction. If we reduce the total number of tubes, we may avoid to use compacted sub-networks. The model that we propose consists in arithmetically averaging per unit length parameters of the (L,C) matrices along the 536 tubes modeling 1m. This simplification strategy is named AVE and the objective is, here, to reduce the number of tubes [5-6-8-9] to a single tube containing the averaged parameters and to apply this model to crosstalk problems. In fact, this model consists of computing the average value of each element of the capacitance and inductance matrices. Eq (1) highlights this procedure for the p.u.l. inductance matrix. In this equation N stands for the number of tubes (N=536 in the case depicted in this paper) and i,j are indices related to individual wires. . . . . ... . . ... . . . . . . . . 1 1 N L L N L L L L N jj jj N ij ij AVE jj AVE ij (1)
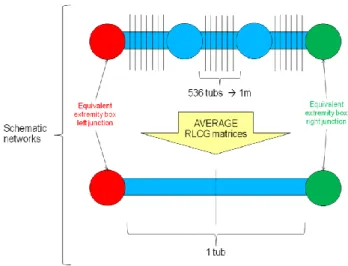
This averaging procedure suggests that the mutual terms as seen from the two wires of a same TPC could be identical since the neighboring cables are straight ones. It takes however into account the other twisted pairs which do not have the same pitch. In fact these mutual terms are within the same range of magnitude. If one would try therefore to identify the fictive position of the two conductors they would appear as, at least partly overlapped. We must be aware that we lose details inside each twist; as a consequence of this model. With this type of equivalent model, there is a single
fictive geometry to describe the TPC for any length. The consequence is a reduction from 536 tubes for 1m of the bundle to 1 tube for 3m of the bundle as illustrated in Fig. 8.
Figure 8. Application of the simplified model to the case study
Fig. 9 illustrates the variation of the crosstalk current for all distribution of coupling between TPC and victim cables computed with the reference model previously detailed in section IV and the averaging simplified model.
Figure 9. Comparison of crosstalk current on single cables for the 9 coupling from TPC to victim cables between reference model and AVE model
In this figure, we observe that currents on victim cables from the simplified AVE model are superimposed with currents from the reference detailed model. They have the same behavior and same resonances. The benefits are:
In time computing, for 536 tubes 5.6 days with reference model for 1tube 15min with AVE model, for all network 2.44 days with reference model for all network 4h with AVE model In data storage, for 536tubes 8Go with reference model for 1tube 15Mo with AVE model In fact, these simulations results confirm the good agreement with measurement with reasonable time computing and data storage.
VI. CONCLUSION
In this paper, we have presented an experimental and numerical study of a complex aeronautical bundle. As a first step, the bundle under study and the test bench have been designed by taking into account realistic constraints in terms of terminal impedances, selection of cables and connectors. The numerical reference model has been built in order to consider the full discretization of twisting cables based on previous articles [5-6] in order to match as closely as possible the fine details of the geometry of industrial bundles. This reference model has been validated by comparison of crosstalks between twisted pairs and single victim cable to measurements. This reference model being time and memory consuming, a simplification that consists in averaging RLCG matrices, terms by terms, has been proposed. This model is based on a reduction of number of tubes representing the global model of the bundle. It has been also validated by comparison to the reference model and the gain is substantial in terms of memory
storage and computation time. Results extracted from this bundle under study, look very promising.
Additional work would be also necessary to extend the comparison between AVE model and experimental results to a statistical study in order to evaluate the confidence interval of computed and measured crosstalks inside such aeronautical bundles.
REFERENCES
[1] L.Paletta, ”Démarche Topologique pour l'étude des couplages
électromagnétiques sur des systèmes de câblages industriels de grande dimension”, Thesis, September 1998
[2] C.E Baum, T.K. Liu, F.M. Tesche, ”On the Analysis of General
Multiconductor Transmission Line Networks Interactions Notes”, Notes 350, January 1988
[3] C.E Baum, “Electromagnetic Topology for the Analysis and Design of
Complex Electromagnetic System”, Fast Electrical and Optical Measurements, Vol. 1, pp. 467-547, Martinus Nijhoff, Dordrecht, 1986
[4] J.P. Parmantier, S. Bertuol, “CRIPTE: User guide”, s.l. :
ONERA/DEMR -009/06 – S,2006. Vol. CRIPTE 4.2
[5] C. Jullien, P. Besnier, M. Dunand and I. Junqua, “Advanced modeling of
crosstalk between an unshielded twisted pair cable and an unshielded wire above a ground plane”, IEEE Transactions on EMC, July 2012
[6] C. Jullien, P. Besnier, M. Dunand and I. Junqua, “Analysis of the
Current Distribution Induced on a Victim Wire by a Differential Voltage Source applied onto a Twisted Pair Cable”, Asia-Pacific EMC Symposium, Singapore, May 2012
[7] C. Jullien, P. Besnier, M. Dunand and I. Junqua, “Towards the
generation of industrial bundles through a random process under realistic constraints”, EMC Europe, Wroclaw, September 2010
[8] Bellan, D., Spadacini, G. et Pignari, S. A., “Prediction of twist
nonuniformity and twist-residual effects on crosstalk in twisted-wire pairs.”, Zurich, Proceedings EMC Zurich International Symposium Electromagntic Compatibility, 2003. pp. 181-186.
[9] Pignari, Sergio A. et Spadacini, Giordano., “Plane-Wave Coupling to a
Twisted-Wire Pair Above Ground.”, s.l. : IEEE Transactions on Electromagnetic Compatibility, Mai 2011. Vol. 53, 2.