HAL Id: pasteur-02865376
https://hal-pasteur.archives-ouvertes.fr/pasteur-02865376
Submitted on 11 Jun 2020
HAL is a multi-disciplinary open access
archive for the deposit and dissemination of
sci-entific research documents, whether they are
pub-lished or not. The documents may come from
teaching and research institutions in France or
abroad, or from public or private research centers.
L’archive ouverte pluridisciplinaire HAL, est
destinée au dépôt et à la diffusion de documents
scientifiques de niveau recherche, publiés ou non,
émanant des établissements d’enseignement et de
recherche français ou étrangers, des laboratoires
publics ou privés.
Distributed under a Creative Commons Attribution - NonCommercial - ShareAlike| 4.0
International License
Taewan Kim, Angelo Veronese, Flavia Pichiorri, Tae Jin Lee, Young-Jun Jeon,
Stefano Volinia, Pascal Pineau, Agnès Marchio, Jeff Palatini, Sung-Suk Suh,
et al.
To cite this version:
Taewan Kim, Angelo Veronese, Flavia Pichiorri, Tae Jin Lee, Young-Jun Jeon, et al.. p53 regulates
epithelial–mesenchymal transition through microRNAs targeting ZEB1 and ZEB2. Journal of
Exper-imental Medicine, Rockefeller University Press, 2011, 208 (5), pp.875-883. �10.1084/jem.20110235�.
�pasteur-02865376�
The Rockefeller University Press $30.00
Br ief Definitive Repor t
MicroRNAs (miRNAs) are small, noncoding
RNAs. They function in various cellular
pro-cesses by targeting the 3 untranslated regions
(UTRs) of target mRNAs (Bartel, 2004; He
and Hannon, 2004). Differentially expressed
miRNAs in tumors inhibit or promote tumor
development, progression, and metastasis by
regu-lating oncogenes or tumor suppressor genes
(Calin and Croce, 2006).
The tumor suppressor p53 is a
transcrip-tion factor that induces or represses a large set
of genes and miRNAs (Vogelstein et al., 2000;
Hermeking, 2007; Chari et al., 2009).
Previ-ous studies have shown that deletions or
mu-tations of p53 are frequently found in cancers
(Soussi, 2007; Chari et al., 2009), and that
p53 is involved in tumor metastasis as well
as tumor progression (Lewis et al., 2005;
Ridgeway et al., 2006; Chen et al., 2007; Hansen
et al., 2007).
Epithelial–mesenchymal transition (EMT)
is necessary for many developmental processes,
such as neural tube and mesoderm formation
during embryogenesis, and has been
high-lighted as a key process in tumor invasion,
me-tastasis and tumorigenicity (Yang and Weinberg,
2008; Wellner et al., 2009). EMT, which
repro-grams transcription of tumor cells, is promoted
by transforming growth factors (TGFs), such as
TGFB1 (TGF1) and TGFB2 (TGF2; Thiery
and Sleeman, 2006). Several EMT-activating
transcription factors: ZEB1 (dEF1, TCF8, and
AREB6), ZEB2 (SIP1), SNAI1 (Snail), SNAI2
(Slug), and TWIST involved in this process have
been previously identified (Yang and Weinberg,
2008). Recently, it was reported that the
miR-200 family targets ZEB1 and ZEB2 and is
significantly down-regulated in TGF-induced
mesenchymal cells and cancer cells with
mesen-chymal characteristics (Gregory et al., 2008; Park
et al., 2008). Here, we have expanded the
knowledge about EMT and p53. We show first
CORRESPONDENCE Carlo M. Croce: carlo.croce@osumc.edu Abbreviations used: EMT, epithelial–mesenchymal transi-tion; miRNA, microRNA; mut, mutant; p53BS, p53 binding site; qRT-PCR, quantita-tive real-time PCR; sh, short hairpin RNA; sqRT-PCR, semiquantitative RT-PCR; TSS, transcriptional start site; UTR, untranslated region.
C.-G. Liu’s present address is Dept. of Experimental Thera-peutics, Division of Cancer Medicine, University of Texas MD Anderson Cancer Center, Houston, TX, 77030.
p53 regulates epithelial–mesenchymal
transition through microRNAs targeting
ZEB1 and ZEB2
Taewan Kim,
1,2Angelo Veronese,
1Flavia Pichiorri,
1Tae Jin Lee,
1Young-Jun Jeon,
1,2Stefano Volinia,
1Pascal Pineau,
3Agnès Marchio,
3Jeff Palatini,
1Sung-Suk Suh,
1Hansjuerg Alder,
1Chang–Gong Liu,
1Anne Dejean,
3and Carlo M. Croce
11Department of Molecular Virology, Immunology and Medical Genetics, Comprehensive Cancer Center, 2Molecular, Cellular,
and Developmental Biology Program, The Ohio State University, Columbus, OH 43210
3Nuclear Organization and Oncogenesis Unit, Institut National de la Santé et de la Recherche Médicale U579, Institut Pasteur,
75724 Paris Cedex 15, France
p53 suppresses tumor progression and metastasis. Epithelial–mesenchymal transition (EMT)
is a key process in tumor progression and metastasis. The transcription factors ZEB1 and
ZEB2 promote EMT. Here, we show that p53 suppresses EMT by repressing expression of
ZEB1 and ZEB2. By profiling 92 primary hepatocellular carcinomas (HCCs) and 9 HCC cell
lines, we found that p53 up-regulates microRNAs (miRNAs), including miR-200 and
miR-192 family members. The miR-200 family members transactivated by p53 then repress
ZEB1/2 expression. p53-regulated miR-192 family members also repress ZEB2 expression.
Inhibition or overexpression of the miRNAs affects p53-regulated EMT by altering ZEB1
and ZEB2 expression. Our findings indicate that p53 can regulate EMT, and that
p53-regulated miRNAs are critical mediators of p53-p53-regulated EMT.
© 2011 Kim et al. This article is distributed under the terms of an Attribution– Noncommercial–Share Alike–No Mirror Sites license for the first six months after the publication date (see http://www.rupress.org/terms). After six months it is available under a Creative Commons License (Attribution–Noncommercial–Share Alike 3.0 Unported license, as described at http://creativecommons.org/licenses/ by-nc-sa/3.0/).
The Journal of Experimental Medicine
876 p53-mediated EMT regulation through miRNAs | Kim et al.
morphology (i.e., cells become thin and elongated.). We found
that p53 deletion causes significant changes in cell
morphol-ogy and dissemination corresponding to EMT characteristics
(Fig. 1 A). In addition, p53 deletion or knock-down resulted in
enhanced cell invasion (Fig. 1 B) and migration (Fig. 1, C and D).
RESULTS AND DISCUSSION
p53 suppresses epithelial-mesenchymal transition
EMT-generated mesenchymal cells are characterized by
down-regulated CDH1 expression and up-down-regulated CDH2 and/or
Figure 1. p53 inhibition induces EMT resulting in increased cell invasion and migration. (A) Phase-contrast view of RKO (p53+/+ and p53/) cells. (B) C3A (stably expressing sh-control, sh-CTRL, or sh-p53) cells, RKO (p53+/+ and p53/) cells, and Hep3B (stably expressing empty vector, EV, or WT p53 expression vector [WTp53]) cells were subjected to in vitro invasion assay for 48 h. (C) RKO (p53+/+ and p53/) cells were subjected to in vitro migration assay for 24 h. (D) Wound-healing assay using RKO (p53+/+ and p53/) cells that were plated and disrupted with a 200-µl tip. 60 h after disruption, the cell layer was photographed. (E) Relative expression levels of CDH1 and VIM mRNA (left) and VIM protein (right) in RKO (p53+/+ and p53/) cells. (F) Relative expression of CDH1 and CDH2 mRNA (top) and protein (bottom) in C3A cells stably expressing sh-CTRL or sh-p53 and treated with DMSO or 10 µM nutlin-3 for 24 h. (top) Densitometry values of p53 protein levels were normalized with those of -actin protein levels. (A and D) A representative experiment out of three independent experiments. (B, C, E, and F) Data are mean ± SEM of three independent experiments and each measured in triplicate (**, P < 0.05; *, P ≤ 0.01). Bars, 50 µm.
Br ief Definitive Repor t
To verify that the changes in cell morphology and
dis-semination are caused by EMT, expression levels of epithelial
and mesenchymal markers were compared with p53
expres-sion level. The epithelial marker (CDH1) was consistently
re-pressed, whereas mesenchymal markers (CDH2 or VIM) were
induced by p53 inhibition (Fig. 1, E and F). In addition, p53
activation using nutlin-3 (Vassilev et al., 2004) also induced
CDH1, but reduced CDH2 expression levels (Fig. 1 F). These
observations indicate that p53 inhibits EMT and causes
de-creased tumor invasion and migration.
p53 represses ZEB1 and ZEB2 expression through miRNAs
To identify EMT regulators that are involved in the p53-
regulated EMT, we tested expression levels of the following
known EMT activators: SNAI1, SNAI2, TGFB1, TGFB2,
TWIST, ZEB1, and ZEB2. The expression levels of EMT
ac-tivators such as SNAI1, SNAI2, TGFB1, and TGFB2 were not
induced by p53 inhibition (
Fig. S1, A–D
). TWIST was not
de-tected at either the mRNA or protein level (unpublished data).
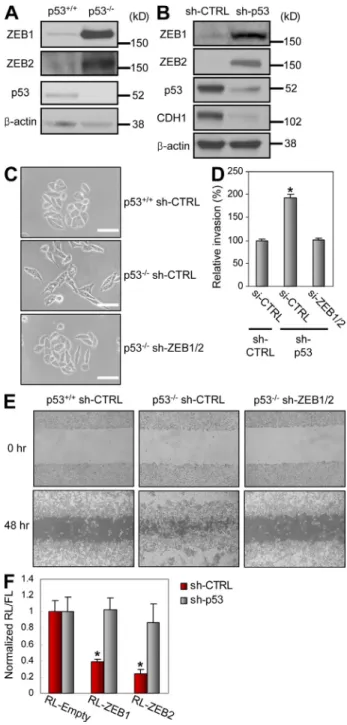
However, expression levels of ZEB1 and ZEB2 were
signifi-cantly repressed by p53 (Fig. 2, A and B and
Fig. S2 A
), suggesting
a potent role of ZEB1 and ZEB2 in p53-regulated EMT.
First, we attempted to determine whether ZEB1 and
ZEB2 are involved in p53-mediated EMT regulation. To
as-sess this hypothesis, ZEB1 and ZEB2 were knocked down in
p53
/RKO cells by stable expression of short hairpin RNA
(sh)-ZEB1 and sh-ZEB2. In p53
/RKO cells, the
simulta-neous repression of ZEB1 and ZEB2 significantly inhibited
mesenchymal cell morphology and dissemination (Fig. 2 C).
However, when ZEB1 or ZEB2 repression occurred
sepa-rately, that repression did not inhibit the mesenchymal
characteristics significantly (Fig. S2, B and C). Furthermore,
simultaneous ZEB1 and ZEB2 repression decreased cell
in-vasive and migratory capacity, which was increased by p53
knock-down or knock-out (Fig. 2, D and E). These results
suggest that, together, ZEB1 and ZEB2 play a key role in
p53-mediated EMT regulation.
Next, we examined the mechanism by which p53 represses
ZEB1 and ZEB2 expression. ZEB1 protein levels were
signifi-cantly induced by p53 inhibition (Fig. 2, A and B). At the
same time, ZEB1 mRNA levels were also significantly
up-regulated by p53 deletion or knock-down (
Fig. S3 A
). These
findings suggest that ZEB1 is repressed by p53 at either the
transcriptional or mRNA level. To examine whether ZEB1 is
repressed by p53 at the transcriptional level, luciferase
report-ers containing the 5 promoter regions of ZEB1 were
ex-pressed in p53-expressing C3A cells (C3A-sh-CTRL) and
p53 knocked-down C3A cells (C3A-sh-p53). Unexpectedly,
we found that luciferase activities were higher in p53-expressing
cells than in the p53 knocked-down cells (Fig. S3 B). This result
indicates that p53 may activate rather than repress the
transcrip-tion of ZEB1 mRNA. However, p53 represses ZEB1 protein
levels as we showed (Fig. 2, A and B). Thus, these results suggest
that ZEB1 is repressed by p53 at the mRNA level.
ZEB2 mRNA levels were not significantly altered by p53
(Fig. S3 A), although ZEB2 protein levels were dramatically
Figure 2. p53 inhibits EMT through ZEB1 and ZEB2 repression in a 3UTR-dependent manner. (A) Protein levels of ZEB1, ZEB2, and p53
in RKO (p53+/+ and p53/) cells. (B) Protein levels of ZEB1, ZEB2, p53, and CDH1 in C3A-sh-CTRL and C3A-sh-p53 cells. (C) Phase contrast view of RKO (p53+/+ and p53/) cells stably expressing CTRL or sh-ZEB1/2. (D) In vitro invasion assay using C3A-sh-CTRL and C3A-sh-p53 cells transfected with si-CTRL or si-ZEB1/2. (E) Wound-healing assay using RKO (p53+/+ and p53/) cells stably expressing CTRL or sh-ZEB1/2. A representative experiment out of three independent experi-ments. (F) Luciferase assay of ZEB1 (RL-ZEB1) or ZEB2 (RL-ZEB2) 3UTR in C3A-sh-CTRL and C3A-sh-p53 cells. RL, Renilla luciferase; FL, Firefly luciferase. (A–C) A representative experiment out of two independent experiments. (D and F) Data are mean ± SEM of three independent ex-periments and each is measured in triplicate (**, P < 0.05; *, P ≤ 0.01). Bars, 50 µm.
878 p53-mediated EMT regulation through miRNAs | Kim et al.
(
Fig. S4 A
) were expressed in cells stably expressing sh-CTRL
or sh-p53. This resulted in decreased luciferase activities in
p53-expressing cells (sh-CTRL) but not in p53
knocked-down cells (sh-p53; Fig. 2 F), indicating that miRNAs may be
involved in p53-repressed ZEB1 and ZEB2 expression.
miR-200 family members are regulated by p53
To identify miRNAs that are regulated by p53, we used
miRNA microarray analysis (Liu et al., 2004). We analyzed 92
primary hepatocellular carcinomas (HCCs) and 9 HCC cell
lines that were classified by p53 status (Materials and
meth-ods). The microarray data from the primary HCC samples
(
Table S1
) were compared with the data from the HCC cell
whether p53 regulates ZEB2 expression at the protein level,
ZEB2 expression vectors lacking the 3 UTR were
intro-duced into p53
/cells with either the empty or p53
expres-sion vectors. However, p53 did not reduce exogenous ZEB2
protein levels (Fig. S3 C). These results indicate that the ZEB2
expression is regulated by p53 at the translational level and
that the 3 UTR of ZEB2 mRNA may be implicated in the
mechanism of p53-repressed ZEB2 expression.
All of these findings indicate that the expression of ZEB1
and ZEB2 is regulated at the mRNA or translational level.
In addition, the findings are consistent with the knowledge
that miRNAs target mRNAs, resulting in degradation
or translational inhibition of the mRNAs (Bartel, 2004;
Figure 3. miR-200 and miR-192 family members are regulated by p53. (A) Expression levels of miR-141, miR-200c, and miR-34a in nine HCC cell
lines harboring WT p53, p53 deletion (Null), or mutant p53 (Mutant). (B) Relative expression of miR-200 family members, miR-34a (positive control), and miR-146b (negative control) in C3A-sh-CTRL and C3A-sh-p53 cells. (C) Relative expression levels of miR-200 family members, miR-192, miR-34a (positive control), and miR-146b (negative control) in Hep3B cells stably expressing WT p53, mutant (MUT) p53, or empty vectors. (D) Expression levels of miR-141, miR-200c, miR-192, and miR-215 in RKO (p53/ and p53+/+) cells. (E) Expression levels of miR-200 family members in MEF (p53/ and p53+/+) cells with (right) or without (left) doxorubicin (200 ng/ml) treatment for 24 h. (A–E) Data are mean ± SEM of three independent experiments and each is mea-sured in triplicate (**, P < 0.05; *, P ≤ 0.01).
Br ief Definitive Repor t
miR-200c, we found that the miRNAs are highly expressed
in HCC cell lines harboring WT p53 (Fig. 3 A). In addition,
miR-200 and miR-192 family members were repressed by
p53 inhibition and/or induced by p53 activation in various
cell types (Fig. 3, B-E; and
Fig. S5 A
).
To determine whether p53 regulates miR-200 family
mem-bers at the transcriptional level, various regions of miR-200
family members were amplified by semiquantitative RT-PCR
(sqRT-PCR). These include portions of the primary miRNAs
(primary transcripts) that are not located in the section
contain-ing precursor miRNAs (Fig. 4 A). Expression levels of these
lines (
Table S2
). From these comparisons, we identified nine
miRNAs (141, 192, 193b, 194,
miR-200b, miR-200c, miR-215, miR-224, and miR-34a) as p53
up-regulated miRNAs.
Although previously published data have shown that
34a and 192 family members (192 and
miR-215) can be regulated by p53 (Chang et al., 2007; He et al.,
2007; Raver-Shapira et al., 2007; Braun et al., 2008; Georges
et al., 2008; Pichiorri et al., 2010), the regulation of miR-200
family by p53 in tumor samples has never been investigated
before. By examining the expression levels of miR-141 and
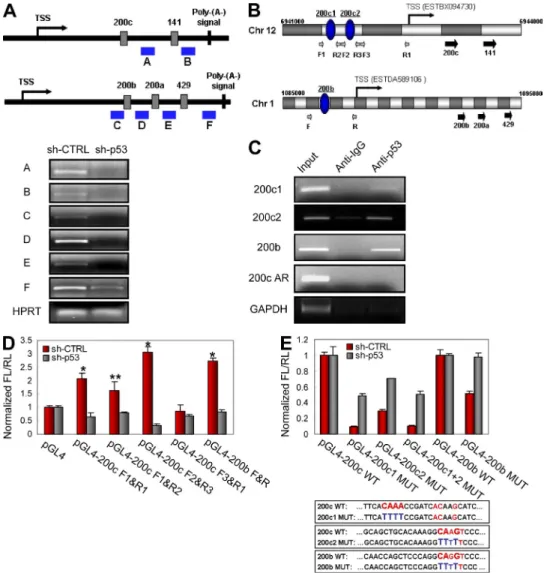
Figure 4. miR-200 family members are directly regulated by p53 at the transcriptional level. (A) sqRT-PCR of miR-200 family clusters. The
re-gions (A–F) amplified by sqRT-PCR are indicated with blue-colored bars in a schematic (top). (B) Schematic view of miRNA-200 family clusters and chro-mosomal locations of TSS and putative p53BS (blue ovals: 200c1, 200c2, and 200b). Gray and white fragments represent 500 bp in length. Small gray arrows indicate primers (F, forward; R, reverse) used for the constructs of luciferase assay (D). Large black arrows indicate locations of precursor miRNAs. (C) ChIP analysis using C3A cells. 200c1 and 200c2 designate p53BSs of miR-200c–141 cluster and 200b designates p53BS of miR-200b–429 cluster. 200c AR designates a region adjacent (200 bp from 200c2) to p53BS of miR-200c–141 cluster. 200c AR and GAPDH are used as negative controls. Input represents 1% of the total chromatin used in this analysis. (D) Luciferase assay of 5 promoters of miR-200 family clusters in C3A-sh-CTRL and C3A- sh-p53 cells. The regions inserted into luciferase reporters are depicted in B. RL, Renilla luciferase; FL, Firefly luciferase. (E, top) Luciferase assay of 5 pro-moter with WT or mutant (MUT) p53BSs of miR-200 family clusters in C3A-sh-CTRL and C3A-sh-p53 cells. (bottom) Sequence information on p53BSs mutations. (A and C) A representative experiment out of two independent experiments. (D and E) Data are mean ± SEM of three independent experiments and each is measured in triplicate (**, P < 0.05; *, P ≤ 0.01).
880 p53-mediated EMT regulation through miRNAs | Kim et al.
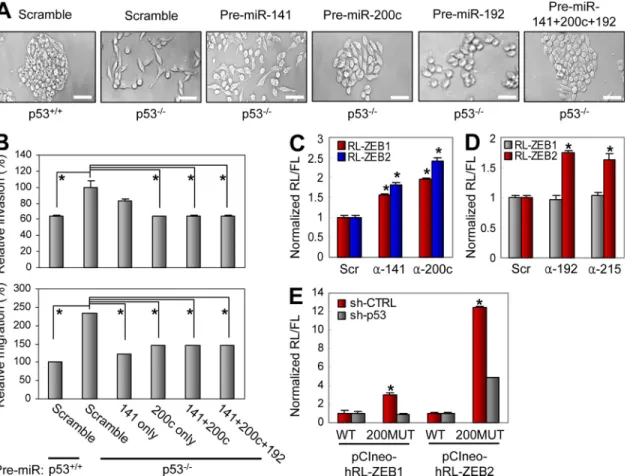
tivities of ZEB1 and ZEB2 3 UTRs (Fig. 5 C). Inhibition of
miR-192 or miR-215 induced luciferase activity of ZEB2
3 UTR (Fig. 5 D) and miR-192 inhibition induced ZEB2
protein levels (Fig. S5 D, right). To further test the function of
the miR-200 family in p53-repressed ZEB1 and ZEB2
ex-pression, C3A-sh-CTRL and C3A-sh-p53 cells were transfected
with luciferase reporters containing the ZEB1 or ZEB2 3 UTR
with mutations in miR-200 family binding sites (Fig. S4 B). The
mutations in the miR-200 family binding sites resulted in
more significant induction of luciferase activities in p53-
expressing cells than in p53 knocked-down cells (Fig. 5 E).
These results indicate that miR-200 and miR-192 family
members have a substantial function in p53-mediated ZEB1/2
repression. In addition, miR-141 and miR-200c expression
levels correlated to the CDH1 expression level in primary
HCC samples, supporting the role of endogenous miR-200
family in EMT (Fig. S5 E). Collectively, our results
demon-strate that the miR-200 and miR-192 family members
regu-lated by p53 play a critical role in p53-repressed EMT.
In summary, we show that p53-regulated miRNAs
pvent EMT by repressing ZEB1 and ZEB2 expression. Our
re-sults complement a recent study that shows p53-regulated EMT
through miR-200c-ZEB1 (Chang et al., 2011). By sequencing
and profiling 92 HCC samples, we further revealed that
miR-200 and miR-192 family members are p53-regulated miRNAs
and regulate ZEB1 and ZEB2 protein expression at the
posttranscriptional level. In addition, our results indicate that
both ZEB1 and ZEB2, which are targeted by a cohort of
p53-regulated miRNAs, are involved in p53-modulated EMT.
Many studies have shown that both p53 and EMT have a
critical role in tumor invasion, metastasis, and tumorigenicity
(Lewis et al., 2005; Ridgeway et al., 2006; Chen et al., 2007;
Hansen et al., 2007; Yang and Weinberg, 2008; Wellner et al.,
2009). Thus, our observations may provide new insights into
the role of p53 and miRNAs in tumor invasion, metastasis,
and tumorigenicity.
MATERIALS AND METHODS
Patients and primary HCC samples. This study was approved by an
In-stitutional Human Research Review Board (RBM 2005–019). We followed established protocols regarding informed consent and anonymity. Our re-search team collected and analyzed tissue from 92 HCC patients. Tissue specimens were obtained retrospectively under strict anonymity from histor-ical collections established in surgery or pathology units of hospitals. All samples were fresh-frozen in liquid nitrogen after surgery and kept at 80°C. Frozen tissue samples were homogenized using the Tissue Ruptor (QIAGEN) before RNA extraction. Total RNA was extracted using Tri- Reagent (MRC) in accordance with the manufacturer’s instructions. To deter-mine TP53 (p53) status of the primary HCC samples, PCR products of TP53 exons 4–11 from genomic DNA were directly sequenced because >95% of TP53 mutations in HCC occur in these exons. Of 92 samples, 62 harbored WT TP53. However, TP53 was mutated or deleted in 30 of the samples.
Migration and invasion assays. Cell migration and invasion assays were
performed with Cell Migration Assay kit (Millipore) and Cell Invasion Assay
200 family members at the transcriptional level.
It has been reported that the clusters of miR-200c–141
and miR-200b–429 are encoded by single polycistronic
tran-scripts, and putative transcriptional start sites (TSSs) of the
transcripts have also been identified (Bracken et al., 2008;
Burk et al., 2008). Here, we used MatInspector to analyze
putative p53 binding sites (p53BSs) in 5 promoter regions of
the transcripts (Cartharius et al., 2005). Using the prediction
tool, we found two putative p53BSs (200c1 and 200c2) and
one putative p53BS (200b) in the 5 promoter regions of the
miR-200c–141 and miR-200b–429 clusters (Fig. 4 B).
To verify the prediction for the p53BSs, we performed
chromatin immunoprecipitation (ChIP) assay in C3A cells
using p53-specific antibody. The result of ChIP assay shows
the direct binding of p53 on the p53BSs (Fig. 4 C). Luciferase
activities driven by the 5 promoter regions (Fig. 4 B) of
miR-200c–141 and miR-200b–429 clusters were induced in
p53-expressing (C3A-sh-CTRL) cells, but not in p53-knock-down
(C3A-sh-p53) cells (Fig. 4 D, lane 2 and 6). In addition,
lucif-erase reporters including each p53BS (Fig. 4 B) of miR-200c–
141 cluster also showed higher activities in C3A-sh-CTRL
than C3A-sh-p53 cells (Fig. 4 D, lane 3 and 4). To further
confirm the function of the p53BSs, they were mutated as
in-dicated (Fig. 4 E, bottom) and luciferase reporters containing
the 5 promoter region mutations were expressed in C3A-
sh-CTRL and C3A-sh-p53 cells. To compare the relative
re-duction of luciferase activity in the cells, luciferase activities of
the mutated luciferase reporters were normalized with those
of WT luciferase reporters. As a result, the mutations in the
p53BSs resulted in more significantly reduced luciferase
activi-ties in C3A-sh-CTRL cells than in C3A-sh-p53 cells (Fig. 4 E,
top). Collectively, these results indicate that p53 directly
acti-vates transcription of miR-200 family members.
p53-regulated miR-200–192 family is involved
in p53-mediated EMT
It has been reported that miR-200 family members target
ZEB1 and ZEB2 mRNAs (Burk et al., 2008; Gregory et al.,
2008; Park et al., 2008), and that miR-192 targets ZEB2
mRNA (Kato et al., 2007). We also observed that miR-200
family members repress ZEB1 and ZEB2 expression. This
resulted in increased CDH1 and decreased VIM expression
(Fig. S5, B and C). In addition, we observed that miR-192
re-presses ZEB2, but not ZEB1, expression (Fig. S5 D, left). We next
examined the role of miR-200 and miR-192 family members
in p53-mediated EMT regulation. By overexpressing miR-141,
miR-200c, and/or miR-192, mesenchymal characteristics
(e.g., changes to cell morphology and enhanced dissemination,
invasion, and migration) caused by p53 deletion were
signifi-cantly inhibited (Fig. 5, A and B). These results suggest that the
miR-200 family members and miR-192 are involved in
p53-mediated EMT regulation and that miR-192 targeting ZEB2
but not ZEB1 also has a role in p53-regulated EMT.
Br ief Definitive Repor t
OH). The cells were cultured in DME with 10% FBS. RKO cells stably transfected with sh-ZEB1 and sh-ZEB2 were generated by lentiviral sh-ZEB1 transfection and puromycin selection, followed by ZEB2 sh-RNA constructs transfection and hygromycin b selection. Control RKO (p53/ sh-CTRL
and p53+/+ sh-CTRL) cells were also generated by the same procedures using
lentiviral sh-CTRL and control sh-RNA constructs. 5-fluorouracil (5-FU) and Doxorubicin were purchased from Sigma-Aldrich. Nutlin-3a was ob-tained from Cayman Chemical Company. G418 was from purchased from Roche, and puromycin was purchased from Santa Cruz Biotechnology, Inc. Hygromycin b was obtained from Sigma-Aldrich.
Plasmids, oligonucleotides, and transfections. The p53 sh-RNA
plas-mid and lentiviral particles of sh-ZEB1, sh-ZEB2, and sh-CTRL were pur-chased from Santa Cruz Biotechnology, Inc. ZEB2 and control sh-RNA constructs were purchased from SA Biosciences. The Zeb2-HA expression plasmid was a gift from A.H. Lund (University of Copenhagen, Copenhagen, Denmark). Precursor miRNAs (Pre-miR) were obtained from Ambion, and LNA-miRNA inhibitors (LNA-miR) were obtained from Exiqon. p53 ex-pression plasmids (WT or mutant) were cloned from the cDNA of HepG2 (WT), Huh7 (Y220C), or SNU-449 (A161T) into pcDNA3.1 (Invitrogen) using BamH1 and EcoRI. For promoter assays, the 5 promoter regions indi-cated in the figures were amplified by PCR. The PCR products amplified kit (Millipore). Both procedures were carried out in accordance with the
manufacturer’s instructions. In brief, cells were starved in serum-free medium for 24 h, and then plated in the chamber (8 µm pole size) containing un-coated polycarbonate membrane (migration assay) or un-coated with a thin layer of polymerized collagen (invasion assay). The chamber was incubated in a well containing 10% serum-containing medium for 24 h (migration assay) or 48 h (invasion assay). The cells on the bottom of the chamber were stained and dislodged. We then measured those cells in accordance with the manu-facturer’s instructions.
Wound-healing assay. When cultured cells reached 90% confluence, they
were starved for 24 h by incubation in serum-free medium. After the 24 h starvation, cells were scratched with a pipette tip and cultured in medium containing 10% FBS. Recovery of the disruption was observed for up to 60 h.
Cells, reagents, and antibiotics. HCC cell lines (HepG2, C3A, Hep3B,
Huh7, PLC/PRF/5, SNU-387, SNU-423, SNU-449, and SNU-475) were cultured as recommended by the American Type Culture Collection. RKO (p53/ and p53+/+) cells were gifts from B. Vogelstein (Johns Hopkins
University, Baltimore, MD). The cells were maintained in Eagle’s Minimum Essential Medium with 10% FBS (Sigma-Aldrich). Mouse embryonic fibroblasts (MEFs) were gifts from G. Leone (The Ohio State University, Columbus,
Figure 5. miR-200 and miR-192 family members regulate p53-mediated EMT by targeting ZEB1 and ZEB2. (A) p53+/+ and p53/ RKO cells were transfected twice a week for 2 wk with indicated premiRs (50 nM). Cells were then photographed. A representative experiment out of three indepen-dent experiments is shown. (B) RKO (p53+/+ and p53/) cells transfected with indicated premiRs were subjected to in vitro invasion (top) and migration (bottom) assays. (C) C3A cells were transfected with luciferase constructs driven by 3UTRs of ZEB1 or ZEB2 (RL-ZEB1, RL-ZEB2), together with scrambled miRNA inhibitor (Scr) or inhibitors of miR-141 (-141) or miR-200c (-200c). RL, Renilla luciferase; FL, Firefly luciferase. (D) RKO (p53+/+) cells were trans-fected with luciferase constructs driven by 3UTRs of ZEB1 or ZEB2 (RL-ZEB1, RL-ZEB2), together with scrambled miRNA inhibitor (Scr) or inhibitors of miR-192 (-192) or miR-215 (-215). (E) Luciferase assay using C3A-sh-CTRL and C3A-sh-p53 cells transfected with pCIneo-hRL constructs containing ZEB1 or ZEB2 3UTR with (200MUT) or without (WT) mutations in miR-200 family binding sites. (B-E) Data are mean ± SEM of three independent experi-ments and each is measured in triplicate (**, P < 0.05; *, P ≤ 0.01). Bars, 50 µm.
882 p53-mediated EMT regulation through miRNAs | Kim et al.
After ChIP assay was performed, the DNA sample was amplified by PCR using the primers listed in Table S3.
Luciferase assay. Cells were plated in 24- or 48-well plates 24 h before
trans-fection. All plasmids constructed with pGL4-luc2 vectors were cotransfected with control Renilla luciferase plasmid (pGL4-hRluc/TK). pCIneo-hRL-ZEB constructs were cotransfected with control pGL3 vectors (firefly luciferase vec-tor). The ratio of experimental plasmid to control plasmid was 10:1. psiCHECK2 vectors with 3 UTR of ZEB1 or ZEB2 were transfected in a similar manner. Luciferase assays were performed using the Dual-Luciferase Reporter Assay System (Promega). In brief, 24–48 h after transfection, cell lysates were prepared by incubating with 1× passive lysis buffer for 15 min at room temperature. Cell lysates were transferred in triplicate to 96-well plates and analyzed using Glo-Max Luminometer (Promega) according to the manufacturer’s instructions.
Immunocytochemistry. Cells grown in chamber slides (Laboratory-Tek)
were washed three times with PBS and fixed with 4% formaldehyde for 15 min at room temperature. After three PBS washes, cells were permeabilized with 0.25% Triton X-100 in PBS. Cells were incubated in PBS containing 2% BSA, followed by overnight incubation at 4°C with VIM antibody. The sec-ondary antibody was incubated for 1 h at room temperature.
Statistics. All graph values represent means ± SEM from three independent
experiments with each measured in triplicate. The differences between two groups were analyzed with unpaired two-tailed Student’s t test. P < 0.05 was considered statistically significant and indicated with asterisks as described in figure legends.
Online supplemental material. Fig. S1 shows that known EMT-activators
other than ZEB1 and ZEB2 are not involved in p53-suppressed EMT. Fig. S2 shows p53-repressed ZEB1/2 expression in p53-null Hep3B cells and the effect of either ZEB1 or ZEB2 knock-down in p53-suppressed EMT. Fig. S3 shows that p53-repressed ZEB1 and ZEB2 expression occurs in the mRNA or translational level, but not in the transcriptional or posttranslational level. Fig. S4 shows the schematics of luciferase constructs used for luciferase ac-tivities of ZEB1 or ZEB2 3 UTR. Fig. S5 shows p53-mediated regulation of miR-200 and miR-192 family members and the regulation of ZEB1/2 and EMT markers (CDH1/VIM) through the miRNAs. Table S1 shows the list of p53-regulated miRNAs identified in primary HCC samples. Table S2 shows the list of p53-regulated miRNAs identified in nine HCC cell lines. Table S3 shows information of primers. Table S4 shows information of probes used for qRT-PCR. Online supplemental material is available at http://www.jem.org/cgi/content/full/jem.20110235/DC1.
We thank Dr. B. Vogelstein for p53+/+ and p53/ RKO cells, Dr. Gustavo Leone for
p53+/+ and p53/ MEFs, Dr. Gregory J. Goodall for pCIneo-hRL-ZEB1/2 constructs,
and Dr. Anders H. Lund for pcDNA3-Zeb2-HA constructs. We also thank Dr. Kay Huebner (The Ohio State University), Dr. Thomas D. Schmittgen (The Ohio State University), and Susan Lutz for careful editing of this paper, and Sharon Palko and Dorothee Wernicke-Jameson for the administrative support.
This work was funded by National Cancer Institute grant RC2 CA148302. The authors declare no competing financial interests.
Submitted: 31 January 2011 Accepted: 14 April 2011
REFERENCES
Bartel, D.P. 2004. MicroRNAs: genomics, biogenesis, mechanism, and func-tion. Cell. 116:281–297. doi:10.1016/S0092-8674(04)00045-5 Bracken, C.P., P.A. Gregory, N. Kolesnikoff, A.G. Bert, J. Wang, M.F. Shannon,
and G.J. Goodall. 2008. A double-negative feedback loop between ZEB1-SIP1 and the microRNA-200 family regulates epithelial-mesenchymal tran-sition. Cancer Res. 68:7846–7854. doi:10.1158/0008-5472.CAN-08-1942 429 cluster was inserted into pGL4-luc2P vectors using Kpn1 and NheI. The
plasmids containing mutations in p53BSs in pGL4-200c F1&R1 (p53BS-200c MUT) and pGL4-200b F&R (p53BS-200b MUT) were generated using QuikChange Site-Directed Mutagenesis kit (Stratagene) or QuikChange Multi Site-Directed Mutagenesis kit (Stratagene). For the 3UTR assay, the 3UTR regions for the mRNAs of interest were PCR amplified with the human cDNAs, followed by insertion into psi-CHECK2 vectors using XhoI and NotI (RL-ZEB1 and RL-ZEB2). hRL-ZEB1 WT, pCIneo-hRL-ZEB1 200b MUT, pCIneo-hRL-ZEB2 WT, and pCIneo-hRL-ZEB2 200b MUT (Gregory et al., 2008; Park et al., 2008) were a gift from G.J. Goodall (University of Adelaide, Adelaide, Australia). pCIneo-hRL-ZEB1 200 MUT and pCIneo-hRL-ZEB2 200 MUT were generated from pCIneo-hRL-ZEB1 200b MUT and pCIneo-hRL-ZEB2 200b MUT using QuikChange Multi Site-Directed Mutagenesis kit. All primers used for the constructs were shown in Table S3.
The plasmids and/or oligonucleotides were transfected into cells using Lipofectamine 2000 (Invitrogen) or Lipofectamine RNAiMAX (Invitrogen), and incubated for 24–48 h according to the manufacturer’s instructions. Stable cell lines were selected using the appropriate antibiotics for at least 48 h after transfection.
miRNA microarray analysis. Microarray analysis was performed as
de-scribed previously (Liu et al., 2004). Differentially expressed miRNAs in HCC cell lines were identified by using Student’s t test procedure within class comparison. Differentially expressed miRNAs in HCC tissue samples were also analyzed by class comparison using Student’s t test procedure to identify miRNAs up-regulated by WT p53. The data were deposited in the GEO Expression Omnibus under accession no. GSE2866.
Quantitative real-time (qRT)-PCR and sqRT-PCR. Total RNA was
prepared from cells using TRIZOL (Invitrogen) in accordance with manu-facturer’s instructions. Total RNA was subjected to qRT-PCR or sqRT-PCR. Mature miRNAs and other mRNAs were analyzed using the TaqMan miRNA Assays and Gene Expression Assays, respectively, in accordance with manufacturer’s instructions (Applied Biosystems). All RT reactions, including no-template controls and RT minus controls, were run in a GeneAmp PCR 9700 Thermocycler (Applied Biosystems). RNA concentrations were deter-mined with a NanoDrop (NanoDrop Technologies, Inc.). Samples were nor-malized to RNU44 or RNU48 for miRNAs and GAPDH or -actin for mRNAs (Applied Biosystems). Gene expression levels were quantified using the ABI Prism 7900HT Sequence detection system (Applied Biosystems). Comparative real-time PCR was performed in triplicate, including no-template controls. Relative expression was calculated using the comparative Ct method. Probes used for Taqman Assays were shown in Table S4.
For sqRT-PCR, total RNA was reverse-transcribed using the Thermo-Script RT-PCR System (Invitrogen) according to the manufacturer’s instruc-tions. sqRT-PCR was performed using the primers indicated in Table S3.
Western blot and antibodies. Total cell extracts prepared from cells using
RIPA buffer (Sigma-Aldrich) were resolved on 4–20% gradient SDS-polyacrylamide gel and transferred to PVDF membranes (Bio-Rad Laborato-ries). Membranes were blocked with blocking solution (5% skim milk in TBST) and incubated with primary antibody, followed by the incubation with appropri-ate HRP-conjugappropri-ated secondary antibody. The primary antibodies used in this study were as follows: anti-p53, anti-CDKN1A, anti--actin, anti-GAPDH, anti-HA-tag, anti-CDH1 (E-cadherin), anti-CDH2 (N-cadherin), anti-VIM (vimentin), anti-ZEB1, and anti-SNAI2 (all from Santa Cruz Biotechnology, Inc.); anti-SNAI1 (Abcam); and anti-ZEB2 (Novus Biologicals). The densi-tometry of Western blot results was measured using ImageJ software.
p53BS prediction and ChIP assay. Putative p53BSs were predicted by
MatInspector (Cartharius et al., 2005; Genomatix). The DNA from C3A cells
Br ief Definitive Repor t
Hermeking, H. 2007. p53 enters the microRNA world. Cancer Cell. 12:414– 418. doi:10.1016/j.ccr.2007.10.028
Kato, M., J. Zhang, M. Wang, L. Lanting, H. Yuan, J.J. Rossi, and R. Natarajan. 2007. MicroRNA-192 in diabetic kidney glomeruli and its function in TGF-beta-induced collagen expression via inhibition of E-box re-pressors. Proc. Natl. Acad. Sci. USA. 104:3432–3437. doi:10.1073/pnas .0611192104
Lewis, B.C., D.S. Klimstra, N.D. Socci, S. Xu, J.A. Koutcher, and H.E. Varmus. 2005. The absence of p53 promotes metastasis in a novel somatic mouse model for hepatocellular carcinoma. Mol. Cell. Biol. 25:1228–1237. doi:10.1128/MCB.25.4.1228-1237.2005
Liu, C.G., G.A. Calin, B. Meloon, N. Gamliel, C. Sevignani, M. Ferracin, C.D. Dumitru, M. Shimizu, S. Zupo, M. Dono, et al. 2004. An oligo-nucleotide microchip for genome-wide microRNA profiling in human and mouse tissues. Proc. Natl. Acad. Sci. USA. 101:9740–9744. doi:10 .1073/pnas.0403293101
Park, S.M., A.B. Gaur, E. Lengyel, and M.E. Peter. 2008. The miR-200 fam-ily determines the epithelial phenotype of cancer cells by targeting the E-cadherin repressors ZEB1 and ZEB2. Genes Dev. 22:894–907. doi:10 .1101/gad.1640608
Pichiorri, F., S.S. Suh, A. Rocci, L. De Luca, C. Taccioli, R. Santhanam, W. Zhou, D.M. Benson Jr., C. Hofmainster, H. Alder, et al. 2010. Downregulation of p53-inducible microRNAs 192, 194, and 215 im-pairs the p53/MDM2 autoregulatory loop in multiple myeloma devel-opment. Cancer Cell. 18:367–381. doi:10.1016/j.ccr.2010.09.005 Raver-Shapira, N., E. Marciano, E. Meiri, Y. Spector, N. Rosenfeld, N.
Moskovits, Z. Bentwich, and M. Oren. 2007. Transcriptional activation of miR-34a contributes to p53-mediated apoptosis. Mol. Cell. 26:731– 743. doi:10.1016/j.molcel.2007.05.017
Ridgeway, A.G., J. McMenamin, and P. Leder. 2006. P53 levels determine out-come during beta-catenin tumor initiation and metastasis in the mam-mary gland and male germ cells. Oncogene. 25:3518–3527. doi:10.1038/ sj.onc.1209391
Soussi, T. 2007. p53 alterations in human cancer: more questions than answers. Oncogene. 26:2145–2156. doi:10.1038/sj.onc.1210280 Thiery, J.P., and J.P. Sleeman. 2006. Complex networks orchestrate epithelial-
mesenchymal transitions. Nat. Rev. Mol. Cell Biol. 7:131–142. doi:10 .1038/nrm1835
Vassilev, L.T., B.T. Vu, B. Graves, D. Carvajal, F. Podlaski, Z. Filipovic, N. Kong, U. Kammlott, C. Lukacs, C. Klein, et al. 2004. In vivo activation of the p53 pathway by small-molecule antagonists of MDM2. Science. 303:844– 848. doi:10.1126/science.1092472
Vogelstein, B., D. Lane, and A.J. Levine. 2000. Surfing the p53 network.
Nature. 408:307–310. doi:10.1038/35042675
Wellner, U., J. Schubert, U.C. Burk, O. Schmalhofer, F. Zhu, A. Sonntag, B. Waldvogel, C. Vannier, D. Darling, A. zur Hausen, et al. 2009. The EMT-activator ZEB1 promotes tumorigenicity by repressing stemness- inhibiting microRNAs. Nat. Cell Biol. 11:1487–1495. doi:10.1038/ ncb1998
Yang, J., and R.A. Weinberg. 2008. Epithelial-mesenchymal transition: at the crossroads of development and tumor metastasis. Dev. Cell. 14:818–829. doi:10.1016/j.devcel.2008.05.009
Braun, C.J., X. Zhang, I. Savelyeva, S. Wolff, U.M. Moll, T. Schepeler, T.F. Ørntoft, C.L. Andersen, and M. Dobbelstein. 2008. p53-Responsive mi-crornas 192 and 215 are capable of inducing cell cycle arrest. Cancer Res. 68:10094–10104. doi:10.1158/0008-5472.CAN-08-1569
Burk, U., J. Schubert, U. Wellner, O. Schmalhofer, E. Vincan, S. Spaderna, and T. Brabletz. 2008. A reciprocal repression between ZEB1 and members of the miR-200 family promotes EMT and invasion in cancer cells.
EMBO Rep. 9:582–589. doi:10.1038/embor.2008.74
Calin, G.A., and C.M. Croce. 2006. MicroRNA signatures in human cancers.
Nat. Rev. Cancer. 6:857–866. doi:10.1038/nrc1997
Cartharius, K., K. Frech, K. Grote, B. Klocke, M. Haltmeier, A. Klingenhoff, M. Frisch, M. Bayerlein, and T. Werner. 2005. MatInspector and be-yond: promoter analysis based on transcription factor binding sites.
Bioinformatics. 21:2933–2942. doi:10.1093/bioinformatics/bti473
Chang, T.C., E.A. Wentzel, O.A. Kent, K. Ramachandran, M. Mullendore, K.H. Lee, G. Feldmann, M. Yamakuchi, M. Ferlito, C.J. Lowenstein, et al. 2007. Transactivation of miR-34a by p53 broadly influences gene ex-pression and promotes apoptosis. Mol. Cell. 26:745–752. doi:10.1016/ j.molcel.2007.05.010
Chang, C.J., C.H. Chao, W. Xia, J.Y. Yang, Y. Xiong, C.W. Li, W.H. Yu, S.K. Rehman, J.L. Hsu, H.H. Lee, et al. 2011. p53 regulates epithelial-mesenchymal transition and stem cell properties through modulating miRNAs. Nat. Cell Biol. 13:317–323. doi:10.1038/ncb2173 Chari, N.S., N.L. Pinaire, L. Thorpe, L.J. Medeiros, M.J. Routbort, and T.J.
McDonnell. 2009. The p53 tumor suppressor network in cancer and the therapeutic modulation of cell death. Apoptosis. 14:336–347. doi:10 .1007/s10495-009-0327-9
Chen, Y.W., D.S. Klimstra, M.E. Mongeau, J.L. Tatem, V. Boyartchuk, and B.C. Lewis. 2007. Loss of p53 and Ink4a/Arf cooperate in a cell autonomous fashion to induce metastasis of hepatocellular carcinoma cells. Cancer
Res. 67:7589–7596. doi:10.1158/0008-5472.CAN-07-0381
Georges, S.A., M.C. Biery, S.Y. Kim, J.M. Schelter, J. Guo, A.N. Chang, A.L. Jackson, M.O. Carleton, P.S. Linsley, M.A. Cleary, and B.N. Chau. 2008. Coordinated regulation of cell cycle transcripts by p53-Inducible microRNAs, miR-192 and miR-215. Cancer Res. 68:10105–10112. doi:10.1158/0008-5472.CAN-08-1846
Gregory, P.A., A.G. Bert, E.L. Paterson, S.C. Barry, A. Tsykin, G. Farshid, M.A. Vadas, Y. Khew-Goodall, and G.J. Goodall. 2008. The miR-200 family and miR-205 regulate epithelial to mesenchymal transition by targeting ZEB1 and SIP1. Nat. Cell Biol. 10:593–601. doi:10 .1038/ncb1722
Hansen, J.E., L.K. Fischer, G. Chan, S.S. Chang, S.W. Baldwin, R.J. Aragon, J.J. Carter, M. Lilly, R.N. Nishimura, R.H. Weisbart, and M.E. Reeves. 2007. Antibody-mediated p53 protein therapy prevents liver metasta-sis in vivo. Cancer Res. 67:1769–1774. doi:10.1158/0008-5472.CAN- 06-3783
He, L., and G.J. Hannon. 2004. MicroRNAs: small RNAs with a big role in gene regulation. Nat. Rev. Genet. 5:522–531. doi:10.1038/nrg1379 He, L., X. He, L.P. Lim, E. de Stanchina, Z. Xuan, Y. Liang, W. Xue, L.
Zender, J. Magnus, D. Ridzon, et al. 2007. A microRNA component of the p53 tumour suppressor network. Nature. 447:1130–1134. doi:10 .1038/nature05939