HAL Id: hal-02329276
https://hal-univ-lyon1.archives-ouvertes.fr/hal-02329276
Submitted on 30 Dec 2020
HAL is a multi-disciplinary open access
archive for the deposit and dissemination of
sci-entific research documents, whether they are
pub-lished or not. The documents may come from
teaching and research institutions in France or
abroad, or from public or private research centers.
L’archive ouverte pluridisciplinaire HAL, est
destinée au dépôt et à la diffusion de documents
scientifiques de niveau recherche, publiés ou non,
émanant des établissements d’enseignement et de
recherche français ou étrangers, des laboratoires
publics ou privés.
Distributed under a Creative Commons Attribution - NoDerivatives| 4.0 International
License
CO2 and temperature decoupling at the million-year
scale during the Cretaceous Greenhouse
Abel Barral, Bernard Gomez, Francois Fourel, Véronique Daviero-Gomez,
Christophe Lecuyer
To cite this version:
Abel Barral, Bernard Gomez, Francois Fourel, Véronique Daviero-Gomez, Christophe Lecuyer. CO2
and temperature decoupling at the million-year scale during the Cretaceous Greenhouse. Scientific
Reports, Nature Publishing Group, 2017, 7, �10.1038/s41598-017-08234-0�. �hal-02329276�
www.nature.com/scientificreports
CO
2
and temperature decoupling
at the million-year scale during the
Cretaceous Greenhouse
Abel Barral
1, Bernard Gomez
1, François Fourel
1, Véronique Daviero-Gomez
1& Christophe
Lécuyer
1,2CO2 is considered the main greenhouse gas involved in the current global warming and the primary
driver of temperature throughout Earth’s history. However, the soundness of this relationship across time scales and during different climate states of the Earth remains uncertain. Here we explore how CO2 and temperature are related in the framework of a Greenhouse climate state of the Earth.
We reconstruct the long-term evolution of atmospheric CO2 concentration (pCO2) throughout the
Cretaceous from the carbon isotope compositions of the fossil conifer Frenelopsis. We show that pCO2
was in the range of ca. 150–650 ppm during the Barremian–Santonian interval, far less than what is usually considered for the mid Cretaceous. Comparison with available temperature records suggest that although CO2 may have been a main driver of temperature and primary production at kyr or smaller
scales, it was a long-term consequence of the climate-biological system, being decoupled or even showing inverse trends with temperature, at Myr scales. Our analysis indicates that the relationship between CO2 and temperature is time scale-dependent at least during Greenhouse climate states of the
Earth and that primary productivity is a key factor to consider in both past and future analyses of the climate system.
Greenhouse gas emissions resulting from human activity are considered to be an important driver of the cur-rent global warming. Accurate understanding of this cause-effect relationship is essential to propose realistic scenarios of the future evolution of Earth’s climate, but the human monitoring history of these variables may be very tenuous to properly take into account the relative importance of their large time-scale dynamics into the cli-mate system. Geological records offer an opportunity to address this time-scale issue as they provide track of the long-term dynamics of atmospheric greenhouse gas contents and surface temperature throughout Earth’s history. An analysis of this relationship throughout the whole Phanerozoic pointed out atmospheric pCO2 as the main multi-scale driver of global warming1. However, recent improvement and refining of methods to reconstruct
pCO2 evidence that this conclusion was based on outdated imprecise estimates2, 3. Additionally, some factors involved in long-term climate dynamics such as O2 have been put forward to challenge this paradigm4. This raises questions about the extent to which we are correctly interpreting the relative influence of atmospheric pCO2 forcing on climate5.
The analysis of the relationship between pCO2 and temperature for the Phanerozoic as a whole may not be pertinent because it comprised shifts between drastically different climate states of the Earth in which the relative impact and the dynamics of atmospheric CO2 may have strongly differed. Of these, Greenhouse is considered to be the default planetary climate state of the Earth, prevailing in more than 70% of the Phanerozoic6. The
Cretaceous is one of the longest and most studied Greenhouse periods of Earth’s history, with an extensive back-ground of pCO27–10 and temperature11–13 reconstructions. This makes the Cretaceous an exceptional ‘laboratory’ of the past to explore the relationship between the two factors. Nevertheless, pCO2 reconstructions made so far for the Cretaceous defined temporal trends that are not consistent with those described for temperature11–13 or
the carbon cycle dynamics evidenced by carbon isotopes14–16. This raises questions about how accurate are pCO 2 reconstructions made so far and how significant was the relative contribution of pCO2 to temperature evolution during the Cretaceous.
1Laboratoire de Géologie de Lyon, CNRS UMR 5276, Université Lyon 1, Villeurbanne, 69622, France. 2Institut
Universitaire de France, Paris, France. Correspondence and requests for materials should be addressed to A.B. (email: abel.barral.cuesta@gmail.com)
Received: 17 March 2017 Accepted: 10 July 2017 Published: xx xx xxxx
www.nature.com/scientificreports/
Carbon isotopes are relevant tools for describing past carbon cycle and CO2 dynamics14–20. Carbon isotope compositions of terrestrial plants are particularly interesting as they are strongly linked to atmospheric CO2, which is the main source of carbon assimilated by plants via photosynthesis. The recent construction of models relating carbon isotope fractionation by plants and pCO219–21 coupled with the good preservation of the pristine carbon isotope signal within plant fossil materials22–25, make carbon isotope compositions of plant fossils valuable
proxies to analyze the evolution of atmospheric pCO2 during past periods.
Herein the long-term evolution of atmospheric pCO2 during the Cretaceous is reconstructed based on the car-bon isotope compositions of leaves of the fossil conifer Frenelopsis (δ13C
leaf). pCO2 is estimated from twelve stages spanning the Barremian–Santonian interval (129.4–83.6 Ma) during which major disturbance events of the car-bon cycle related to CO2 release to the atmosphere14, 15, 18 and major variations in temperature11–13 described for the Cretaceous took place. We explore the correspondence between estimated pCO2 trends and those previously published for temperature to analyze the relative influence of pCO2 forcing on climate during the Cretaceous.
Results and Discussion
Carbon isotope compositions of the fossil conifer Frenelopsis.
δ13Cleaf values from the twelve studied stages range from −27.7 to −22.1‰ in average (Fig. 1; Table 1). In most of these stages, δ13C
leaf values show sim-ilar standard deviations (ca. 0.9‰), thus reflecting a simsim-ilar range of local environmental variability. Santonian stages are the only exceptions, which may reflect higher climatic instability related to the development of Oceanic Anoxic Event (OAE) 3. Carbon isotope compositions of Frenelopsis in the Barremian, upper Albian and lower Santonian stages are notably 13C-depleted compared to others, even though it is not significant in the latter case (Fig. 1). These lower δ13C
leaf values are consistent with decreases in the carbon isotope composition of atmos-pheric CO2 (δ13CCO2) recently described by Barral et al.16 (Fig. 1). Overall, there is a good agreement between δ13C
leaf and δ13CCO2 curves, though trends in the former are generally magnified. This magnification is more pro-nounced during the Cenomanian-Turonian interval, coinciding with a critical increase in global temperatures11,
which may have slightly reduced carbon isotope fractionation by plants (Δ13C
leaf) by reducing the discrimination effect of RuBisCO against 13C26, 27.
Atmospheric CO
2concentration during the Cretaceous.
Δ13Cleaf values inferred from δ13Cleaf and concomitant δ13CCO2 values (Table 1) were used to estimate pCO2 values. pCO2 estimates are in the range of ca. 150–650 ppm for the Barremian–Santonian interval, and the resolution is better than 55 ppm (i.e. 1σ, standard deviation) for most of the stages (Fig. 2; Table 1). This range of values is consistent with the conclusions by Franks
et al.20 from a method based on universal equations of leaf gas exchange using stomatal anatomy and carbon
isotope ratios of fossil leaves suggesting pCO2 values below 1000 ppm during most of the Phanerozoic, although their conclusions remain controversial28–30. Our pCO
2 estimates average ca. 300 ppm for the studied interval, which is in accordance with the most recent revision of GEOCARBSULF model3 and the range of values obtained
in most recent works dealing with proxy-based reconstructions7–10 (Fig. 2). All these reconstructions suggest that
atmospheric CO2 concentrations were comparable to those of present-day atmosphere, which is a conclusion in deep contrast with the classical view that the Cretaceous period was characterized by atmospheric CO2 concen-trations considerably higher than today31. This is also consistent with several other approaches. Boron isotope
compositions (δ11B) of marine biogenic carbonates are closely related to pCO
2 and pH32–34. Higher atmospheric concentrations would imply more CO2 dissolution into the ocean, causing a lowering of seawater pH and δ11B of marine biogenic carbonates33, 34. However, δ11B of Cretaceous and present-day brachiopods as well as ophiolitic serpentinites are close to each other35, thus suggesting that seawater pH and atmospheric pCO
2 were of similar
Figure 1. Comparison of the carbon isotope compositions of leaves of the fossil conifer Frenelopsis (δ13C leaf) obtained for each studied episode with the evolution of the carbon isotope composition of atmospheric CO2 (δ13C
www.nature.com/scientificreports/
magnitude. Analysis of reef abundance and diversity throughout the Phanerozoic also agrees with our results, indicating that during the Cretaceous no significant long-term rise in ocean acidification, reflecting a long-term rise in pCO2, took place36. Only discrete short-term events of ocean acidification have been described during the Cretaceous based on marine calcifiers, associated with major Cretaceous OAEs and Hothouse episodes37, 38.
Was pCO
2a long-term driver of temperature during the Cretaceous?
Several events of volcanicCO2 release into the atmosphere linked to the emplacement of large igneous provinces have been inferred from pronounced negative shifts of both carbon and strontium isotope compositions of marine carbonates14, 38
asso-ciated with the main Cretaceous OAEs14, 18, 37. These CO
2 release events are also evident regarding the evolution of δ13C
CO2 throughout the Cretaceous16 (Fig. 1) and are most likely responsible for temperature increases at the kyr scale12, 13. The biggest of these CO
2 release events in terms of the magnitude of carbon isotope excursions was related to OAE1b and lasted ca. 25 kyr14, 39. This event was responsible for a fast warming of the atmosphere of
ca. 0.3 °C and followed by cooler climatic conditions during a period of ca. 45 kyr39. Greater kyr-scale increases
in temperature of ca. 6–7 °C have been described associated with the CO2 release events related to OAE1a12, 13 and OAE211 (Fig. 3). However, our results indicate that drastic Myr-scale pCO
2 drawdowns took place during the warmest time intervals described for the Cretaceous11–13: a drawdown of ca. 310 ppm (from ca. 500 to ca. 190
ppm) during the upper Barremian-lower Aptian interval (ca. 7.5 Myr), and ca. 225 ppm (from ca. 410 ppm to ca. 190 ppm) during the upper Albian-lower Cenomanian interval (ca. 5 Myr) (Fig. 3). In fact, at the Myr-scale,
Locality Age
δ13Cleaf (‰) δ13CCO2 (‰) Δ13Cleaf (‰) pCO2 (ppm)
μ σ n μ σ μ σ μ σ
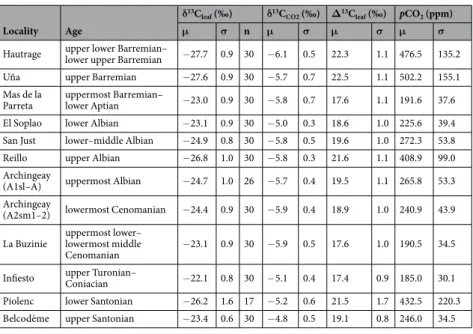
Hautrage upper lower Barremian–lower upper Barremian −27.7 0.9 30 −6.1 0.5 22.3 1.1 476.5 135.2 Uña upper Barremian −27.6 0.9 30 −5.7 0.7 22.5 1.1 502.2 155.1 Mas de la
Parreta uppermost Barremian–lower Aptian −23.0 0.9 30 −5.8 0.7 17.6 1.1 191.6 37.6 El Soplao lower Albian −23.1 0.9 30 −5.0 0.3 18.6 1.0 225.6 39.4 San Just lower–middle Albian −24.9 0.8 30 −5.8 0.5 19.6 1.0 272.3 53.8
Reillo upper Albian −26.8 1.0 30 −5.8 0.3 21.6 1.1 408.9 99.0
Archingeay
(A1sl–A) uppermost Albian −24.7 1.0 26 −5.7 0.4 19.5 1.1 265.8 53.3 Archingeay
(A2sm1–2) lowermost Cenomanian −24.4 0.9 30 −5.9 0.4 18.9 1.0 240.9 43.9 La Buzinie uppermost lower–lowermost middle
Cenomanian −23.1 0.9 30 −5.9 0.5 17.6 1.0 190.5 34.5
Infiesto upper Turonian–Coniacian −22.1 0.8 30 −5.1 0.4 17.4 0.9 185.0 30.1 Piolenc lower Santonian −26.2 1.6 17 −5.2 0.6 21.5 1.7 432.5 220.3 Belcodème upper Santonian −23.4 0.6 30 −4.8 0.5 19.1 0.8 246.0 34.5
Table 1. δ13C
leaf, δ13CCO2, Δ13Cleaf and pCO2 values for the twelve studied Cretaceous stages. μ and σ correspond to mean and standard deviation, respectively.
Figure 2. Comparison of the δ13C
leaf-based pCO2 estimates with most recent proxy-based and model-based pCO2 reconstructions for the Cretaceous3, 7–10. Envelopes and bar errors represent ±1σ. GCSM: GEOCARBSULF Model reconstructions; PB: Paleosol Barometer reconstructions; SI: Stomatal Index reconstructions.
www.nature.com/scientificreports/
trends in pCO2 are even inverse compared to temperature during significant time intervals such as the upper Barremian–lower Aptian (considering the higher resolution temperature curves based on TEX86 proxy12, 13) and the upper Albian–Santonian in which pCO2 minima are coeval with thermal maxima (Fig. 3). If pCO2 was rather low and usually decoupled from temperature at the Myr-scale, it may not have been the main long-term driver of global warming during the Cretaceous.
Time scale dependency of the relationship between pCO
2and temperature.
Episodes ofenhanced primary production have been associated with the kyr-scale CO2 release events that took place during major OAEs and the warmest intervals of the Cretaceous40–44. Barclay et al.7 showed that a 20% increase in pCO
2 during OAE2 triggered extensive primary productivity leading to a global increase in rates of organic carbon burial, which eventually resulted in a pCO2 decrease down to 26% in ca. 100 kyr. This indicates that, as a conse-quence of a critical CO2 release event to the atmosphere, primary productivity can account for pCO2 drawdowns of at least up to the 105 yr scale. The time resolution of our record is not high enough to fully discuss pCO
2 trends on the kyr scale; however, when the time uncertainty of our estimates allows clear perusal, pCO2 levels are con-sistently low well after the events of CO2 release to the atmosphere described in the literature18, 45 (Fig. 3). This indicates that the aforementioned primary productivity effect may exceed the kyr scales resulting in a negative balance or a low-level stasis of pCO2 up to the Myr scales. If primary production were responsible for a long-term decrease in atmospheric pCO2 during the Cretaceous, we should find a co-varying increase in atmospheric pO2 as a product of long-term enhanced photosynthesis. This is in accordance with the long-term trends obtained by the recent revision of the GEOCARBSULF model, which describes both a drawdown of pCO2 and an increase in pO2 levels from the earliest stages of the Cretaceous up to the mid Cretaceous3. Poulsen et al.4 emphasized the importance of O2 in long-term climate dynamics as under low pO2 conditions shortwave scattering by clouds and air molecules is reduced; this implies a significant increase in surface shortwave forcing, leading to increase of atmospheric water vapour and consequent enhanced greenhouse forcing which increases global surface tem-peratures. Thus, their simulations predict that temperature increases under low pO2 and high pCO2 conditions. However, during the Cretaceous temperature was maintained high during the late Albian–Santonian interval coinciding with relatively high pO23 and low pCO2 conditions3, 7 (Fig. 3). This observation reflects that both pO2 and pCO2 parameters may not be enough to explain long-term evolution of temperature.
In addition to the conclusions of previous work on atmospheric CO2 dynamics at kyr time scales7 our results indicate that the relationship between CO2 and temperature was probably scale-dependent during the Cretaceous. In the framework of a Greenhouse climate state functioning, CO2 appears to have been a main driver of global
Figure 3. Reconstructed pCO2 compared with available sea surface temperature (SST) records11–13 for the Cretaceous. Vertical grey bars represent major Oceanic Anoxic Events (OAE) occurring during the Cretaceous18. Envelopes represent ±1σ.
www.nature.com/scientificreports/
warming and primary production at timescales up to the kyr7. However, our results indicate that it was decoupled
from temperature and most likely a long-term consequence of the climate-biological system at Myr scales. Direct extrapolation of these conclusions to time intervals corresponding to different climate states of the Earth is not pertinent because C cycle dynamics, and thus the evolution of pCO2, might be strongly modulated by different global scale functioning of climate factors. For instance, temperature strongly affects carbon sequestration by living organisms26, 27, and global oceanic and atmospheric circulation patterns are involved in heat transport46
and distribution of climate zones47 that strongly influence primary productivity. Different dynamics and relative
effects of those factors within different climate states of the Earth6 may result in different functioning of
atmos-pheric CO2 dynamics. However, nowadays anthropogenic CO2 release into the atmosphere also constitutes a main driver of climate change at a human time scale. At larger scales, primary productivity appears to have been an important driver of atmospheric CO2 concentration during both interglacial48 and glacial intervals49. Further work on the Myr-scale interrelationships between primary productivity, CO2 and temperature within these different climate state intervals of the Earth is needed to explore how universal are the conclusions obtained herein. Primary production constitutes a major factor involved in climate dynamics and that regulates the bal-ance between pO2 and pCO2. Thus, productivity must be taken into consideration in the evaluation of the relative effect of O2 and CO2 on climate dynamics. Present-days anthropogenic CO2 release event can be compared in magnitude with those of the Cretaceous, reflected in a ca. −1.8‰ shift in δ13C
CO2 since the industrial revolu-tion50 against the ca. −2‰ shift associated with OAE1b16 (Fig. 1). However, its critically shorter time of
devel-opment makes it a more intense disturbance event, and so its forthcoming consequences are difficult to predict. Evaluating the response time of primary production to cushion CO2 forcing will be critical to allow the prediction of climate evolution and its impact in the near future of life on Earth.
Methods
Twelve stages corresponding to eleven sites from the Cretaceous of western Europe were used for pCO2 recon-struction (see Supplementary Fig. S1). The sites represent similar terrestrial environments in which the fossil conifer genus Frenelopsis was present, and they are distributed over a narrow palaeolatitude band (30–40° N) of the same climate zone throughout the time range analyzed51 (see Supplementary Table S1). These stages and sites
were selected to reduce as much as possible environmental biases on δ13C leaf.
Frenelopsis was chosen as a pCO2 proxy because it was frequent and abundant in Cretaceous ecosystems52–55.
Frenelopsis is a valuable material for performing stable carbon isotope analysis due to its resistance to decay and
diagenesis. It provides accurate δ13C
leaf values, which are comparable to those of living plant leaves25, 56, 57.
Frenelopsis leaves were treated with HCl 32% following the protocol recommended by Barral et al.25. Thirty
Frenelopsis leaves per locality were separately reduced to powder using an agate mortar. Three replicates of ca.
100 μg per leaf were randomly selected and weighted using a precision balance Sartorius ME36S and loaded into tin capsules. Carbon isotope analyses were performed using a continuous flow IRMS configuration, being He the carrier gas, using a EuroEA3028
™
–HT elemental analyzer working in combustion mode and interfaced with an IP60 isotope ratio mass spectrometer. Carbon isotope ratios were calibrated against the international standard IAEA-C4 (δ13C = −23.96‰) and casein (δ13C = −22.67‰) as an internal reference. Based on repeated analysis of standards, analytical reproducibility was better than ±0.2‰.pCO2 values were estimated for each stage using the equation relating pCO2 to δ13Cleaf described by Schubert and Jahren19, 21 (r = 0.94):
∆13C =[(28 26)(0 22)( CO. . p +23 9)]/[28 26. . + .(0 22)( COp +23 9)].
leaf 2 2
Δ13C
leaf values were estimated from δ13Cleaf and concomitant δ13CCO2 values by using the equation proposed by Farquhar et al.58:
∆13C = δ C − δ C /1+ δ( C /1000)
leaf 13 Co2 13 leaf 13 co2
δ13C
CO2 values were taken from the δ13Ccarb-based δ13CCO2 estimates provided by Barral et al.16. We avoid dis-crimination bias due to different physiological functioning related to taxonomic specificity by using always the same taxon, and thus δ13C
leaf faithfully represents environmental variability. In order to avoid misrepresented
pCO2 estimates due to subtle uncorrelations between the beds from which δ13CCO2 and δ13Cleaf were obtained, we accounted for δ13C
CO2 variability in the uncertainty timespan of the Frenelopsis localities by averaging and estimating cumulated error for each stage. This was made by randomly drawing 10,000-repetition Gaussian dis-tributions for each single case within the interval of uncertainty of a given stage, defined by the pre-determined means and standard deviations of each case, and calculating the mean and the standard deviations of the 10,000 randomly generated sets. This procedure was also implemented to include the associated errors to each δ13C
leaf, δ13C
CO2 and Δ13Cleaf values into the aforementioned equations to account for all sources of error in the resolution of pCO2 estimates.
References
1. Royer, D. L., Berner, R. A., Montañez, I. P., Tabor, N. J. & Beerling, D. J. CO2 as a primary driver of phanerozoic climate. GSA Today
14, 4–10 (2004).
2. Breecker, D. O., Sharp, Z. D. & McFadden, L. D. Atmospheric CO2 concentrations during ancient greenhouse climates were similar
to those predicted for AD 2100. Proc. Natl. Acad. Sci. 107, 576–580 (2010).
3. Royer, D. L., Donnadieu, Y., Park, J., Kowalczyk, J. & Goddéris, Y. Error analysis of CO2 and O2 estimates from the long-term
geochemical model GEOCARBSULF. Am. J. Sci. 314, 1259–1283 (2014).
4. Poulsen, C. J., Tabor, C. & White, J. D. Long-term climate forcing by atmospheric oxygen concentrations. Science 348, 1238–1241 (2015).
www.nature.com/scientificreports/
6. Kidder, D. L. & Worsley, T. R. Phanerozoic large igneous provinces (LIPs), HEATT (haline euxinic acidic thermal transgression) episodes, and mass extinctions. Palaeogeogr. Palaeoclimatol. Palaeoecol. 295, 162–191 (2010).
7. Barclay, R. S., McElwain, J. C. & Sageman, B. B. Carbon sequestration activated by a volcanic CO2 pulse during Ocean Anoxic Event
2. Nat. Geosci. 3, 205–208 (2010).
8. Huang, C. M., Retallack, G. J. & Wang, C. S. Early Cretaceous atmospheric pCO2 levels recorded from pedogenic carbonates in
China. Cretac. Res. 33, 42–49 (2012).
9. Huang, C., Retallack, G. J., Wang, C. & Huang, Q. Paleoatmospheric pCO2 fluctuations across the Cretaceous–Tertiary boundary
recorded from paleosol carbonates in NE China. Palaeogeogr. Palaeoclimatol. Palaeoecol. 385, 95–105 (2013).
10. Li, J., Wen, X. Y. & Huang, C. M. Lower Cretaceous paleosols and paleoclimate in Sichuan Basin, China. Cretac. Res. 62, 154–171 (2016).
11. Martin, J. E., Amiot, R., Lécuyer, C. & Benton, M. J. Sea surface temperature contributes to marine crocodylomorph evolution. Nat.
Commun. 5 (2014).
12. Mutterlose, J., Bottini, C., Schouten, S. & Damsté, J. S. S. High sea-surface temperatures during the early Aptian Oceanic Anoxic Event 1a in the Boreal Realm. Geology 42, 439–442 (2014).
13. Naafs, B. D. A. & Pancost, R. D. Sea-surface temperature evolution across Aptian Oceanic Anoxic Event 1a. Geology 44, 959–962 (2016).
14. Erba, E. Calcareous nannofossils and Mesozoic oceanic anoxic events. Mar. Micropaleontol. 52, 85–106 (2004).
15. Jarvis, I. A. N., Gale, A. S., Jenkyns, H. C. & Pearce, M. A. Secular variation in Late Cretaceous carbon isotopes: a new δ13C carbonate
reference curve for the Cenomanian–Campanian (99.6–70.6 Ma). Geol. Mag. 143, 561–608 (2006).
16. Barral, A., Gomez, B., Legendre, S. & Lécuyer, C. Evolution of the carbon isotope composition of atmospheric CO2 throughout the
Cretaceous. Palaeogeogr. Palaeoclimatol. Palaeoecol. 471, 40–47 (2017).
17. Cerling, T. E. In Palaeoweathering, palaeosurfaces and related continental deposits (eds. Thiry, M. & Simon-Coinçon, R.) International Association of Sedimentologists Special Publication 27, 43–60 (1999).
18. Jenkyns, H. C. Geochemistry of oceanic anoxic events. Geochem. Geophys. Geosystems 11 (2010).
19. Schubert, B. A. & Jahren, A. H. The effect of atmospheric CO2 concentration on carbon isotope fractionation in C3 land plants.
Geochim. Cosmochim. Acta 96, 29–43 (2012).
20. Franks, P. J. et al. New constraints on atmospheric CO2 concentration for the Phanerozoic. Geophys. Res. Lett. 41, 4685–4694 (2014).
21. Schubert, B. A. & Jahren, A. H. Global increase in plant carbon isotope fractionation following the Last Glacial Maximum caused by increase in atmospheric pCO2. Geology 43, 435–438 (2015).
22. Bocherens, H., Friis, E., Mariotti, A. & Pedersen, K. R. Carbon isotopic abundances in Mesozoic and Cenozoic fossil plants: Palaeoecological implications. Lethaia 26, 347–358 (1993).
23. De Leeuw, J. W., Frewin, N. L., Van Bergen, P. F., Damsté, J. S. & Collinson, M. E. In Marine palaeoenvironmental analysis from fossils (eds. Bosence, D. W. J. & Allison, P. A.) 83, 43–71 (Geological Society Special Publications, 1995).
24. Arens, N. C., Jahren, A. H. & Amundson, R. Can C3 plants faithfully record the carbon isotopic composition of atmospheric carbon
dioxide? Paleobiology 26, 137–164 (2000).
25. Barral, A., Lécuyer, C., Gomez, B., Fourel, F. & Daviero-Gomez, V. Effects of chemical preparation protocols on δ13C values of plant
fossil samples. Palaeogeogr. Palaeoclimatol. Palaeoecol. 438, 267–276 (2015).
26. Crafts-Brandner, S. J. & Salvucci, M. E. Rubisco activase constrains the photosynthetic potential of leaves at high temperature and CO2. Proc. Natl. Acad. Sci. 97, 13430–13435 (2000).
27. Falkowski, P. et al. The global carbon cycle: a test of our knowledge of Earth as a system. Science 290, 291–296 (2000).
28. McElwain, J. C., Montañez, I., White, J. D., Wilson, J. P. & Yiotis, C. Was atmospheric CO2 capped at 1000ppm over the past 300
million years? Palaeogeogr. Palaeoclimatol. Palaeoecol. 441, 653–658 (2016).
29. Franks, P. J. & Royer, D. L. Comment on ‘Was atmospheric CO2 capped at 1000ppm over the past 300 million years?’ by McElwain
J. C. et al. [Palaeogeography, Palaeoclimatology, Palaeoecology 441 (2016) 653–658]. Palaeogeogr. Palaeoclimatol. Palaeoecol. (2017). 30. McElwain, J. C., Montañez, I. P., White, J. D., Wilson, J. P. & Yiotis, C. Reply to Comment on ‘Was atmospheric CO2 capped at
1000ppm over the past 300 million years?’[Palaeogeography, Palaeoclimatology, Palaeoecology 441 (2016) 653–658]. Palaeogeogr.
Palaeoclimatol. Palaeoecol. (2017).
31. Wang et al. Paleo-CO2 variation trends and the Cretaceous greenhouse climate. Earth-Sci. Rev. 129, 136–147 (2014).
32. Pearson, P. N. & Palmer, M. R. Middle Eocene seawater pH and atmospheric carbon dioxide concentrations. Science 284, 1824–1826 (1999).
33. Pearson, P. N. & Palmer, M. R. Atmospheric carbon dioxide concentrations over the past 60 million years. Nature 406, 695–699 (2000).
34. Lécuyer, C., Grandjean, P., Reynard, B., Albarède, F. & Telouk, P. 11B/10B analysis of geological materials by ICP–MS Plasma 54:
Application to the boron fractionation between brachiopod calcite and seawater. Chem. Geol. 186, 45–55 (2002).
35. Simon, L., Lécuyer, C., Maréchal, C. & Coltice, N. Modelling the geochemical cycle of boron: implications for the long-term δ11B
evolution of seawater and oceanic crust. Chem. Geol. 225, 61–76 (2006).
36. Kiessling, W. & Simpson, C. On the potential for ocean acidification to be a general cause of ancient reef crises. Glob. Change Biol.
17, 56–67 (2011).
37. Erba, E., Bottini, C., Weissert, H. J. & Keller, C. E. Calcareous nannoplankton response to surface-water acidification around Oceanic Anoxic Event 1a. Science 329, 428–432 (2010).
38. Arkhipkin, A. I. & Laptikhovsky, V. V. Impact of ocean acidification on plankton larvae as a cause of mass extinctions in ammonites and belemnites. Neues Jahrb. Geol. Paläontol.-Abh. 266, 39–50 (2012).
39. Wagner, T., Wallmann, K., Herrle, J. O., Hofmann, P. & Stuesser, I. Consequences of moderate 25,000 yr lasting emission of light CO2
into the mid-Cretaceous ocean. Earth Planet. Sci. Lett. 259, 200–211 (2007).
40. Schlanger, S. O. & Jenkyns, H. C. Cretaceous oceanic anoxic events: causes and consequences. Neth. J. Geosci. En Mijnb. 55, 179–184 (1976).
41. Kuypers, M. M., Pancost, R. D., Nijenhuis, I. A. & Sinninghe Damsté, J. S. Enhanced productivity led to increased organic carbon burial in the euxinic North Atlantic basin during the late Cenomanian oceanic anoxic event. Paleoceanography 17, 1051 (2002). 42. Adams, D. D., Hurtgen, M. T. & Sageman, B. B. Volcanic triggering of a biogeochemical cascade during Oceanic Anoxic Event 2.
Nat. Geosci. 3, 201–204 (2010).
43. Gomes, M. L., Hurtgen, M. T. & Sageman, B. B. Biogeochemical sulfur cycling during Cretaceous oceanic anoxic events: a comparison of OAE1a and OAE2. Paleoceanography (2016).
44. Tessin, A., Sheldon, N. D., Hendy, I. & Chappaz, A. Iron limitation in the Western Interior Seaway during the Late Cretaceous OAE 3 and its role in phosphorus recycling and enhanced organic matter preservation. Earth Planet. Sci. Lett. 449, 135–144 (2016). 45. Leckie, R. M., Bralower, T. J. & Cashman, R. Oceanic anoxic events and plankton evolution: Biotic response to tectonic forcing
during the mid-Cretaceous. Paleoceanography 17, 13–1 (2002).
46. Hay, W. W. Evolving ideas about the Cretaceous climate and ocean circulation. Cretac. Res. 29, 725–753 (2008).
47. Hasegawa et al. Drastic shrinking of the Hadley circulation during the mid-Cretaceous Supergreenhouse. Clim. Past 8, 1323–1337 (2012).
48. Adams, J. M., Faure, H., Faure-Denard, L., McGlade, J. M. & Woodward, F. I. Increases in terrestrial carbon storage from the Last Glacial Maximum to the present. Nature 348, 711714 (1990).
www.nature.com/scientificreports/
49. Montañez et al. Climate, pCO2 and terrestrial carbon cycle linkages during late Palaeozoic glacial–interglacial cycles. Nat. Geosci. 9,
824–828 (2016).
50. National Oceanic and Atmospheric Administration, Earth System Research Laboratory, Global Monitoring Division. U.S. Department of Commerce. http://www.esrl.noaa.gov/.
51. Chaboureau, A.-C., Sepulchre, P., Donnadieu, Y. & Franc, A. Tectonic-driven climate change and the diversification of angiosperms.
Proc. Natl. Acad. Sci. 111, 14066–14070 (2014).
52. Gomez, B., Martín-Closas, C., Barale, G., Thévenard, F. & Guignard, G. Frenelopsis (Coniferales: Cheirolepidiaceae) and related male organ genera from the Lower Cretaceous of Spain. Palaeontology 45, 997–1036 (2002).
53. Gomez, B. et al. Floristic assemblage from the Albian-Cenomanian of Charente-Maritime (SW France). Ann. Paléontol. 90, 147–159 (2004).
54. Mendes, M. M., Dinis, J. L., Gomez, B. & Pais, J. Reassessment of the cheirolepidiaceous conifer Frenelopsis teixeirae Alvin et Pais from the Early Cretaceous (Hauterivian) of Portugal and palaeoenvironmental considerations. Rev. Palaeobot. Palynol. 161, 30–42 (2010).
55. Barral, A. et al. Local-scale analysis of plant community from the Early Cretaceous riparian ecosystem of Hautrage, Belgium.
Palaeogeogr. Palaeoclimatol. Palaeoecol. 443, 107–122 (2016).
56. Nguyen, T. T. T. et al. Ecological distribution of Cenomanian terrestrial plants based on 13C/12C ratios. Palaeogeogr. Palaeoclimatol.
Palaeoecol. 145, 79–93 (1999).
57. Nguyen, T. T. T. et al. Isotope reconstruction of plant palaeoecology. Case study of Cenomanian floras from Bohemia. Palaeogeogr.
Palaeoclimatol. Palaeoecol. 183, 43–70 (2002).
58. Farquhar, G. D., Ehleringer, J. R. & Hubick, K. T. Carbon isotope discrimination and photosynthesis. Annu. Rev. Plant Biol. 40, 503–537 (1989).
Acknowledgements
This work was financially supported by the CNRS-UMR 5276 and the projects CGL2013-42643-P, CGL2014-52163-C2, CGL2015-68363-P and CGL2015-60805-P funded by the Ministerio de Economía y Competitividad of the Spanish government and 2014SGR-251 funded by the AGAUR, Catalan Research Authority.
Author Contributions
A.B. conceived the original idea for this study and led the writing of the manuscript under the advising of B.G. and C.L. Plant fossil materials were provided by B.G. and V.D.-G. δ13C
leaf measurements were made by A.B., F.F. and C.L. All the authors contributed to data interpretation and manuscript editing.
Additional Information
Supplementary information accompanies this paper at doi:10.1038/s41598-017-08234-0
Competing Interests: The authors declare that they have no competing interests.
Publisher's note: Springer Nature remains neutral with regard to jurisdictional claims in published maps and
institutional affiliations.
Open Access This article is licensed under a Creative Commons Attribution 4.0 International
License, which permits use, sharing, adaptation, distribution and reproduction in any medium or format, as long as you give appropriate credit to the original author(s) and the source, provide a link to the Cre-ative Commons license, and indicate if changes were made. The images or other third party material in this article are included in the article’s Creative Commons license, unless indicated otherwise in a credit line to the material. If material is not included in the article’s Creative Commons license and your intended use is not per-mitted by statutory regulation or exceeds the perper-mitted use, you will need to obtain permission directly from the copyright holder. To view a copy of this license, visit http://creativecommons.org/licenses/by/4.0/.