HAL Id: hal-01951446
https://hal.laas.fr/hal-01951446
Submitted on 11 Dec 2018
HAL is a multi-disciplinary open access archive for the deposit and dissemination of sci-entific research documents, whether they are pub-lished or not. The documents may come from teaching and research institutions in France or abroad, or from public or private research centers.
L’archive ouverte pluridisciplinaire HAL, est destinée au dépôt et à la diffusion de documents scientifiques de niveau recherche, publiés ou non, émanant des établissements d’enseignement et de recherche français ou étrangers, des laboratoires publics ou privés.
Label-free discrimination of human lymphoma cell
sub-populations with microwave dielectric spectroscopy
Katia Grenier, François Artis, Mary Poupot, J-J Fournié, David Dubuc
To cite this version:
Katia Grenier, François Artis, Mary Poupot, J-J Fournié, David Dubuc. Label-free discrimination of human lymphoma cell sub-populations with microwave dielectric spectroscopy. IEEE International Microwave Symposium (IMS 2018), Jun 2018, Philadelphie, PA, United States. 4p. �hal-01951446�
Label-free discrimination of human lymphoma cell sub-populations
with microwave dielectric spectroscopy
Katia Grenier
1, Member, IEEE, François Artis
1, Mary Poupot
2, J-J. Fournié
2, David Dubuc
1, Member, IEEE
1 LAAS-CNRS, University of Toulouse, CNRS, Toulouse, France 2 CRCT-INSERM, Toulouse, France
grenier@laas.fr, dubuc@laas.fr
Abstract—This paper deals with the label-free microwave die-lectric characterization of B lymphoma cell lines, the OCI-LY7, OCI-LY10 and OCI-LY18 ones, and demonstrates that the tech-nique is able to discriminate these three sub-population cell lines with their different dielectric properties. Proof is given that such a differentiation is not due to a variation of cell size, viability or cells concentration, but to internal molecular differences. This constitutes a major result as it demonstrates for the first time that microwave dielectric spectroscopy is sufficiently sensitive using di-electric properties variations to distinguish very similar biological cell lines of the same phenotype, B lymphoma cell lines in our case, whereas such a detection is traditionally performed with marker-based and costly equipment or using heavy genetic methods.
Index Terms—Microwave dielectric spectroscopy, permittivity, lymphoma, biosensor, biological cells, sub-populations
I. INTRODUCTION
Microwave dielectric sensing is under development for mo-lecular and cellular analysis for now a decade. It presents in-deed several breakthroughs such as being non-invasive for the cells, non-destructive, label-free and relevant of intracellular modifications. Among its sensing abilities, the technique was already demonstrated for cell quantification or pathological identification notably, as well as for the monitoring of biologi-cal reactions or processes [1]-[4].
To go further in the demonstration of the capabilities of the technique, one question is related to its sensitivity and selectiv-ity, especially to cell phenotypes. Accessing to such an infor-mation without using traditional and costly molecular or genetic methods would represent indeed an important innovation but remains highly challenging.
So far, low frequency impedancemetry already proved the possible distinction of different populations of leukocytes with signals applied at 503 and 1707 kHz. To obtain such a result, the cytoplasmic membrane of cells had to be perforated with chemical agents [5] to allow the penetration of electromagnetic fields in the cells. Additionally, a recent publication is also claiming the detection of various types of cancer cell lines in suspension with a narrowband characterization setup [6].
In this paper, the broadband microwave characterization of three different sub-populations of B lymphoma cells is con-ducted. The paper is divided in 3 main sections. The first one is dedicated to the presentation of the microwave sensor and test setup used for the study. The second part introduces the types of cancer cell lines, which are investigated. It also includes a biological characterization of the cell lines. Finally, the micro-wave dielectric spectra of different cancer cells lines are psented in a third section, associated with a discussion of the re-sults.
II. MICROWAVE SENSOR AND TEST SETUP
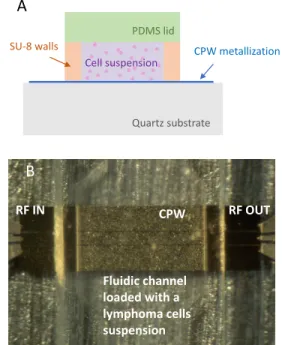
To perform the microwave dielectric spectroscopy of cells suspensions, a coplanar and microfluidic sensor [4] is used, with a similar topology as in [7]. This sensor is presented in Fig. 1 with both a schematic cross view and a photography of the sensor loaded with a cell suspension. It includes a coplanar waveguide with a crossing microfluidic channel.
Fig. 1. Schematic cross view and photography of the microwave biosensor loaded with a cell suspension in a microfluidic channel.
CPW metallization Quartz substrate PDMS lid SU-8 walls Cell suspension
A
Fluidic channel loaded with a lymphoma cells suspension RF IN CPW RF OUTB
The conductive line is realized in gold, whereas the fluidic walls are realized in the SU-8 polymer and surmounted with a lid realized in PDMS, a traditional elastomer used in microflu-idic applications. Cells correspond to the multiple bright spots visible on the gold metallization within the channel in Fig. 1.b. The sensor is connected to a Vector Network Analyzer (VNA) using two cables and RF probes, which tips are notice-able in Fig. 1.b at the input and output of the sensor. To perform the measurements, the sensor is characterized when unloaded, when loaded with the culture medium of the cells suspensions and finally with the cells suspensions. A de-embedding tech-nique is applied to extract the complex permittivity of the liquid under test [4].
III. DESCRIPTION OF THE SELECTED CANCER CELLS LINES AND THEIR BIOLOGICAL CHARACTERIZATION
This section presents the cancer B lymphoma cell lines, which have been used for the study.
A. Introduction to B lymphoma cells lines and description of the evaluated ones
B lymphoma cells refer to cancerous lymphocytes and blood cancers. They consequently come from white blood cells, and typically proliferate and accumulate in lymph nodes and blood. Their detection and then discrimination constitute important abilities, as the patient treatment is lymphoma type-dependent.
Many B lymphoma cells lines exist. The ones selected in this paper correspond to widely used non-Hodgkin lymphoma (NHL) cell lines derived at the Ontario Cancer Institute (OCI): OCI-LY7, OCI-LY10 and OCI-LY18. They come from differ-ent body locations, the peripheral blood for the OCI-LY7, the pleural effusion for the OCI-LY18, whereas it remains un-known for the OCI-LY10.
To recognize B lymphoma cells from other lymphoma cells, antigenic labelings of CD19+ and CD20+ are traditionally used,
as expressed by all B lymphomas types [8]. Their discrimina-tion is then possible with heavy molecular cytogenetic charac-terization [9], or with cellular labeling with specific fluorescent molecules.
B. Standard biological characterization of the different se-lected cell lines
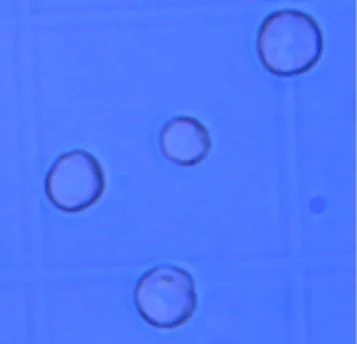
Lymphoma cells are circulating cells. Therefore, their shape is quite round, as shown in the photography of Fig. 2, which presents few lymphoma cells placed into a Malassez cell for cell counting. They are cultured in RPMI medium (Roswell Park Memorial Institute medium) complemented with 10% of Foetal Calf Serum.
All samples of lymphoma cell lines are characterized in terms of concentration, viability, as well as mean diameter. All data are summarized in Table 1.
Fig. 2. Photography obtained with an optical microscope of lymphoma cells in their culture medium.
TABLEI
SUMMARY OF THE BIOLOGICAL CHARACTERISTICS OF THE I N-VESTIGATED BLYMPHOMA CELL LINES (WITH MEAN VALUES
AND STANDARD DEVIATIONS IN BRACKET)
OCI-LY7 and OCI-LY10 exhibit similar cell diameter, close to 10 µm, whereas OCI-LY18 cells present a larger dimension with a mean value of 12.2 µm. As far as basal viability is con-cerned, they all present comparable values.
Finally, before RF measurements, all cells are placed in a fresh culture medium at a targeted concentration of 80 million cells per milliliter, which is quite well reproducibly obtained for all lymphoma cell lines. To avoid any possible variability due to the use of biological samples, the experiment are repeated sev-eral times (different days, with different sensors and a new RF calibration each time). Corresponding variations are indicated in brackets.
Such biological samples are then characterized with microwave dielectric spectroscopy.
IV. MICROWAVE DIELECTRIC SPECTROSCOPY APPLIED TO D IF-FERENT BLYMPHOMA CELL LINES
For the RF measurement of each cell line, a volume of 2 mi-croliters is injected in the microfluidic channel and stopped for the duration of measurement. The liquid is then removed and replaced by another liquid to test.
S parameters are first measured from 40 MHz to 40 GHz and used to extract the permittivity of the liquids under test. To
en-Cell lines Concentration (M/ml) Viability (%) Diameter (µm) OCI-LY7 83.7 (11.1) 83.5 (10.5) 10.4 OCI-LY10 82.9 (10.1) 93 (2.9) 10.3 OCI-LY18 79.2 (21.4) 87 (9) 12.2
hance the small variations between the different cell lines spec-tra, dielectric contrasts are calculated by subtracting the dielec-tric properties of the medium only to the cells suspensions com-plex permittivity.
For all measurements, the thermal chuck of the probe station is maintained at 20°C to avoid any temperature variation.
Fig. 3 a and b present respectively the extracted contrasts ver-sus frequency of the real and imaginary parts of permittivity for each cell lines, measured at different days.
As a first notice, the OCI-LY18 line exhibits the largest die-lectric contrasts in absolute value. In a first assumption, this could be attributed to the larger diameter of this cell line com-pare to the two others.
To complement the results of Fig. 3, Δε” at 20 GHz versus Δε’ at 5 GHz has been plotted and presented in Fig. 4. A clear partitioning of the three cell lines can be observed with three unmixed clouds of points.
(a)
(b)
Fig. 3. Microwave dielectric spectra for three different B lymphoma cell lines: OCI-LY7 (blue), OCI-LY10 (red) and OCI-LY18 (green). a) Contrast of the real part of permittivity and b) of the imaginary parts of permittivity.
As far as OCI-LY7 and OCI-LY10 dielectric properties are concerned, one may notice that both Δε’ and Δε” of OCI-LY10 are larger in absolute value than for the OCI-LY7 line. This changes in dielectric properties may not be attributed this time to cell diameter, as they both exhibit similar ones. The slight variations of concentration and viability of the two cell lines may not be at the origin of such a result. Internal constitutive variations between cell lines should be considered. Molecular and genetic variations have been demonstrated for such cell lines [9] and may explain distinct dielectric properties.
Such a possible discrimination of biological materials is not surprising as it was already published at the tissue level [10] and more recently at the cellular level for cell grading [3] with fixed cells in a gel and also with various types of cancer cell lines in suspension with a narrowband characterization [6].
Fig. 4. Δε” at 20 GHz versus Δε’ at 5 GHz for the three investigated B lymphoma cell lines.
With these new results, this is the first time that microwave dielectric spectroscopy is demonstrated for distinguishing sub-populations of cells (only B lymphoma cells in this case), which present however strong biological similarities due to their com-mon phenotype.
V. CONCLUSIONS
Several B lymphoma cell lines suspensions are characterized at microwave and millimeterwave frequencies. Several conclu-sions may be given. Microwave dielectric spectroscopy is able to discriminate sub-populations of B lymphoma cell lines: the OCI-LY7, OCI-LY10 and OCI-LY18 ones. Such a result may not be attributed to diameter, viability or cells concentration variations, but to intrinsic molecular and constitutive variation of the cells. This result is particularly important as this is the first time that a non-invasive, non-destructive, and label free technique is able to reach such a sensitivity level to enable the discrimination of different sub-populations of cells, instead of heavy and costly molecular techniques. Even if such an inves-tigation should be extended to other B lymphoma cell lines, as
-8 -7 -6 -5 -4 -3 -2 -1 0 0 5 10 15 20 25 30 35 40 Δε’ Frequency (GHz) OCI-LY7 OCI-LY10 OCI-LY18 -5 -4,5 -4 -3,5 -3 -2,5 -2 -1,5 -1 -0,5 0 0 10 20 30 40 Δε’’ Frequency (GHz) OCI-LY7 OCI-LY10 OCI-LY18 -4,5 -4 -3,5 -3 -2,5 -2 -8 -7 -6 -5 -4 -3 Δε’’ @ 20 GHz Δε ‘ @ 5 GHz OCI-LY7 OCI-LY10 OCI-LY18
well as other lymphoma phenotypes, it opens new perspectives for cellular analysis with microwave dielectric spectroscopy.
ACKNOWLEDGMENT
This work was supported in part by a French ITMO Cancer grant of the Plan Cancer 2014-2019 (grant n° PC201522) and in part by LAAS-CNRS micro and nano technologies platform, member of the French RENATECH network.
REFERENCES
[1] K. Grenier, D. Dubuc, T. Chen, F. Artis, T. Chrétiennot, M. Poupot, J-J. Fournié, "Recent Advances in Microwave-based Dielectric Spectroscopy at the Cellular Level for Cancer Investigations," IEEE T-MTT, Vol. 61, Issue 5, Part 2, 2013, pp. 2023-2030.
[2] Y. Ning, C. Multari, X. Luo, C. Palego, X. Cheng, J. Hwang, A. Denzi, C. Merla, F. Apollonio, M. Liberti, Broadband electrical detection of in-dividual biological cells, IEEE T-MTT, Vol. 62, n° 9, pp. 1905-1911, 2014.
[3] L.Y. Zhang, C. Bounaix Morand du Puch, A. Lacrois, C. Dalmay, A. Pothier, C. Lautrette, S. Battu, F. Lalloué, M-O. Jauberteau, P. Blondy, Microwave biosensors for identifying cancer cell aggressiveness grade, IEEE T-MTT-S, 2012.
[4] K. Grenier, D. Dubuc, P-E. Poleni, M. Kumemura, H. Toshiyoshi, T. Fu-jii, H. Fujita, ‘Integrated Broadband Microwave and Microfluidic Sensor dedicated to Bioengineering’, IEEE Trans. on Microwave Theory and Techniques, Vol. 57, n°12, Dec. 2009, pp. 3246-3253.
[5] D. Holmes, D. Pettigrew, CH. Reccius, JD. Gwyer, CV. Berkel, J. Hol-loway, DE. Davie, H. Morgan, Leukocyte analysis and differentiation us-ing high speed microfluidic sus-ingle cell impedance cytometry, Lab Chip, 2009; 9: 2881-2889.
[6] V. Nerguizian, A. Alazzam, I. Stiharu, M. Burnier Jr., “Characteriztaion of several cancer lines at microwave frequencies,” Measurement, Vol. 109, pp. 354-358, 2017
[7] James C. Booth, Nathan D. Orloff, Jordi Mateu, Michael Janezic, Mat-thew Rinehart, and James A. Beall, “Quantitative Permittivity Measure-ments of Nanoliter Liquid Volumes in Microfluidic Channels to 40 GHz”, IEEE Transactions on Instrumentation and Measurements, Vol. 59, Dec. 2010, pp. 3279
[8] L. Ginaldi, M. De Martinis, E. Matutes, N. Farahat, R. Morilla, D. Ca-tovsky, Levels of expression of CD19 and CD20 in chronic B cell leukae-mias, J Clin Pathol., 1998, 51(5): 364-369
[9] S. Mehra, H. Messner, M. Minden, RSK. Chaganti, Molecular cytoge-netic characterization of non-Hodgkin lymphoma cell lines, Genes Chro-mosomes & Cancer, Vol. 33, pp. 225-234, 2002.
[10] S. Gabriel et al., The dielectric properties of biological tissues: II. Meas-urements in the frequency range 10 Hz to 20 GHz, Phys. Med. Biol., Vol. 41, pp. 2251-2269, 1996.