SOIL VARIABILITY MEASURED BY A SOIL STRENGTH
SENSOR: WITHIN-FIELD VARIABILITY AND SIMILARITY
BETWEEN FIELDS
B. Hanquet1, Ndao T.1, J.-C. Verbrugge2-1, M.-F. Destain1
1 Gembloux Agricultural University, UMC, Passage des Déportés 2, B-5030 Gembloux, Belgium ; Email : [email protected]; Internet : www.fsagx.ac.be/me
2 Université Libre de Bruxelles, LJV, Aven. F. Roosevelt 50, B-1050 Bruxelles, Belgium
INTRODUCTION
Many sensing methods for soil physical properties determination are developed to replace time-consuming and expensive soil sampling and analysis. Within this scope, sensors to measure soil strength are developed in several laboratories. They are generally coupled to DGPS positioning systems to produce maps, showing within-field soil variability. In this study, besides the within-field variability, the sensor was used with another objective: the aim was to appraise the similarity of soil strength between different fields located in silty areas, in Belgium.
MATERIAL AND METHODS
The sensor used in this research was detailed by Sirjacobs et al. (2002). It consisted in a thin blade pulled in the soil at constant depth and speed, which transfered the soil forces to a transducer fixed on the tractor. Three signals were measured: the draft force (Fx), the vertical force (Fz), and the moment (My). Five fields representative of the soils used in silty areas for arable production in Belgium were selected (Table 1). In one of them (Hannut), the measurements were repeated four times during 1999-2003. Targeted test plots were chosen in each field to perform reference measurements, namely granulometry, cohesion, friction angle, pF, water content, dry bulk density, and cone index.
RESULTS
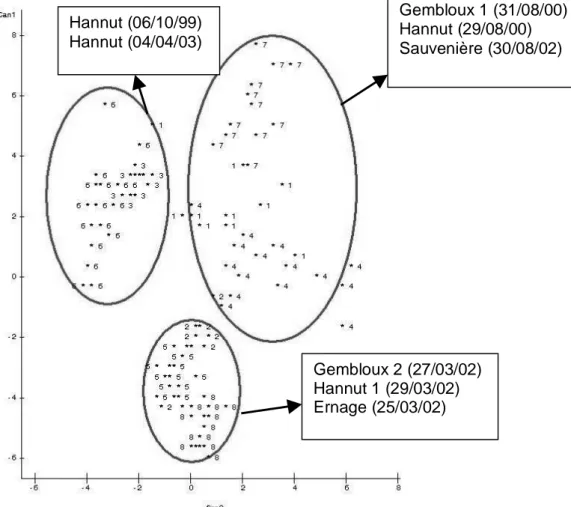
The within-field studies revealed high variability caused by texture, history, compaction, etc., and showed a correlation between the sensor signals and physical parameters, such as cone index and soil moisture, as long as no over-consolidation of the soil occurred. To assess the similarity of soil strength between the fields, the data Fx, Fz and My were classified by using the method of canonical variates. An example of analysis is showed in Fig. 1. When considering the first two canonical variates (CAN 1 and CAN 2), 92 % of the variability was explained, and three clusters could be distinguished. The first one with slight values of CAN1 corresponded to trials performed in March on soils ploughed during the winter, naked or covered with small vegetation, and characterised by small values of IP25. The second cluster with high values of CAN1 and CAN2 grouped measurements done just after wheat harvest in August. The third cluster (high CAN1 and small CAN2) corresponded to measurements performed on the same field at different periods.
CONCLUSIONS
Global analysis of within-field variability measured by a soil strength sensor is rather complex, even if in some cases it can be attributed to precise factors, such as compaction associated with previous tramlines or historical cultivation differences. Correlation exists between the sensor signals and soil physical properties, but it is difficult to use this property practically to predict water content, bulk density, … , since over-consolidation zones reduce this correlation. Geographically spaced fields may induce similar responses from the sensor. This suggests that the same cultivation techniques could be applied to parcels belonging to the same cluster, even if they are
not contiguous. In this scope, use of site-specific farming would not be restricted to large-size parcels.
Trial 1 Trial 2 Trial 3 Trial 4 Trial 5 Trial 6 Trial 7 Trial 8 Field location Gembloux 1 Gembloux 2 Hannut Hannut Hannut Hannut Sauvenière Ernage
Soil type* Abp, Ahp Abp, Ahp Aba Abp Aba,Abp
Size (ha) 10.7 2.7 13.3 8.9 4.3 Measurement date 31/08/00 27/03/02 06/10/99 29/08/00 29/03/02 04/04/03 30/08/02 25/03/02 Control plots number 10 9 10 15 18 18 12 17 w (g/g) 23.5 (3.5) 26.7 (2.8) 23.3 (1.1) 22.5 (0.5) 20.7 (1.1) 23.4 (0.7) 23.2 (0.5) 24.9 (0.8) IP25 (MPa) 1.55 (0.30) 0.82 (0.14) 1.23 (0.25) 1.10 (0.16) 0.81 (0.12) 1.41 (0.20) 1.02 (0.18) 0.59 (0.09) Soil state or crop during measurement After wheat harvest Maize growing After wheat harvest After wheat harvest Naked soil after winter plough Wheat growing After wheat harvest Naked soil after winter plough
* After Belgian soil classification; w: gravimetric water content mean value (standard deviation); IP25: mean value of the cone index in the first 25 cm (standard deviation).
Table 1. Trials scheme.
Fig. 1. Experimental trials in function of the two first canonical variates.
REFERENCES
[1] Sirjacobs D., Hanquet B., Lebeau F., Destain M.-F. (2002). On-line mechanical resistance mapping and correlation with soil physical properties for precision agriculture. Soil and Tillage Research 64, 231-242.
Gembloux 2 (27/03/02) Hannut 1 (29/03/02) Ernage (25/03/02) Hannut (06/10/99) Hannut (04/04/03) Gembloux 1 (31/08/00) Hannut (29/08/00) Sauvenière (30/08/02)