UNIVERSITÉ DE SHERBROOKE
Faculté de génie
Département de génie civil
CONCEPTION DES BIOSYSTÈMES D’OXYDATION PASSIVE DU
MÉTHANE CONSIDÉRANT LEUR RÉPONSE À L’EFFET DE BARRIÈRE
CAPILLAIRE
DESIGN OF PASSIVE METHANE OXIDATION BIOSYSTEMS CONSIDERING THEIR RESPONSE TO THE PRESENCE OF CAPILLARY BARRIER EFFECT
Thèse de doctorat
Spécialité: géotechnique environnementale
Bahar AHOUGHALANDARI
Jury: Alexandre R. CABRAL (directeur) Serge LEROUEIL
Mathieu NUTH
Serge-Étienne PARENT
i
RESUMÉ
La construction des biosystèmes d’oxydation passive du méthane (BOPM) est une option économique et durable pour réduire les émissions de méthane des sites d’enfouissement de déchets et des effets subséquents du réchauffement climatique. Les BOPM sont constitués de deux couches principales: la couche d'oxydation du méthane (MOL) et la couche de distribution du gaz (GDL). L'oxydation du méthane se produit dans la MOL par les réactions biochimiques des bactéries méthanotrophes, et la GDL est construite sous la MOL pour intercepter et distribuer les émissions fugitives de biogaz à la base de la MOL. Fondamentalement, l'efficacité d'un BOPM est définie en fonction de l'efficacité d'oxydation du méthane dans la MOL. Par conséquent, il est indispensable de fournir des conditions adéquates pour les activités bactériennes des méthanotrophes. En plus des paramètres environnementaux, l'intensité et la distribution du biogaz influencent l'efficacité des BOPM, et ils peuvent rendre le matériau de la MOL - avec une grande capacité d'accueillir les activités bactériennes - inutilisables en termes d'oxydation du méthane sur place. L'effet de barrière capillaire le long de l'interface entre la GDL et la MOL peut provoquer des émissions localisées de méthane, due à la restriction ou la distribution non-uniforme de l’écoulement ascendant du biogaz à la base de la MOL. L'objectif principal de cette étude est d'incorporer le comportement hydraulique non-saturé des BOPM dans la conception des BOPM, afin d’assurer la facilité et la distribution adéquates de l'écoulement du biogaz à la base de la MOL. Les fonctions de perméabilité à l'air des matériaux utilisés pour construire la MOL des BOPM expérimentaux au site d’enfouissement des déchets de St-Nicéphore (Québec, Canada), ainsi que celles d'autres de la littérature technique, ont été étudiés pour évaluer le comportement d'écoulement non-saturé du gaz dans les matériaux et pour identifier le seuil de migration sans restriction du gaz. Ce dernier seuil a été introduit en tant que un paramètre de conception avec lequel le critère de conception recommandé ici, c’est-à-dire la longueur de la
migration sans restriction de gaz (LMSG), a été défini. La LMSG est considérée comme la
longueur le long de l'interface entre la GDL et la MOL où le biogaz peut migrer à travers la MOL sans restriction. En réalisant des simulations numériques avec SEEP/W, les effets de la pente de l'interface, des paramètres définissant la courbe de rétention d'eau, de la fonction de la conductivité hydraulique du matériau de la MOL sur la valeur de la LMSG (représentant la facilité d'écoulement du biogaz à l'interface) et de la distribution de l'humidité (et par conséquent celle du biogaz) ont été évalués. Selon les résultats des simulations, la conductivité hydraulique saturée et la distribution des tailles de pores du matériau de la MOL sont les paramètres les plus importants sur la distribution de l'humidité le long de l'interface. Ce dernier paramètre influe également sur la valeur du degré de saturation et donc la facilité du biogaz à la base de la MOL. La densité sèche du matériau de MOL est un autre paramètre qui contrôle la facilité d'écoulement ascendant du biogaz. Les limitations principales de la présente étude sont associées au nombre de matériaux de MOL testés et à l'incapacité de SEEP/W de considérer l'évapotranspiration. Toutefois, compte tenu des hypothèses raisonnables dans les simulations et en utilisant les données de la littérature, on a essayé de réduire ces limitations. En utilisant les résultats des expériences et des simulations numériques, des étapes et des considérations de conception pour la sélection du matériau de MOL et de la pente d'interface ont été proposées. En effet,le comportement hydraulique non-saturé des matériaux serait intégré dans les nécessités de conception pour un BOPM efficace, de sorte que la capacité maximale possible d'oxydation du méthane du matériau de la MOL soit exploitée.
ii
Mots clés : biosystèmes d’oxydation passive du méthane, le comportement hydraulique non-saturé, simulation numérique, le comportement d’écoulement du gaz, perméabilité à l’air
iii
ABSTRACT
Implementation of passive methane oxidation biosystems (PMOB) is a cost-effective and sustainable solution to eliminate the methane emissions of landfills to the atmosphere and ensuing global warming effects. PMOBs consist of two main layers: methane oxidation layer (MOL) and gas distribution layer (GDL). The oxidation of methane occurs in MOL through the biochemical reactions of methanotrophic bacteria, and GDL is constructed beneath the MOL to intercept and distribute the fugitive biogas emissions at the base of MOL. Basically, the efficiency of a PMOB is defined based on the methane oxidation efficiency in MOL. Therefore, it is indispensable to provide adequate conditions for the bacterial activities of methanotrophs. In addition to the environmental parameters, the intensity and the distribution of the biogas reaching the MOL material influence the efficiency of PMOBs, and they may cause the MOL material possessing great capacity to host the bacterial activities to be unserviceable in terms of in-field methane oxidation. The capillary barrier effect along the GDL-MOL interface may provoke localized surface methane emissions, resulted from the restricted and/or non-uniform distribution of upward flow of biogas at the base of MOL. The main focus of present study is to incorporate the unsaturated hydraulic behavior of PMOBs into the design of PMOBs, providing adequate ease and distribution of upward flow of biogas at the base of MOL. The air permeability functions of the materials used to construct the MOL of experimental PMOBs at the St-Nicephore landfill (Quebec, Canada), along with other materials from the technical literature, were studied to evaluate the unsaturated gas flow behavior of the materials and to identify the threshold of unrestricted gas migration. This latter threshold was introduced as a design parameter based on which the recommended design criterion herein, i.e. the length of unrestricted gas migration (LUGM), was defined. LUGM is considered as the length along the GDL-MOL interface along which biogas can migrate upwards without restriction. Performing sets of numerical simulations in SEEP/W, the effect of slope of interface and the parameters defining the water retention curve and hydraulic conductivity function of MOL material on value of LUGM (representing the ease of upward flow of biogas at the interface) and distribution of moisture (and therefore biogas) along the GDL-MOL interface were assessed. The saturated hydraulic conductivity and the pore size distribution of the MOL material were the most influencing parameters in distribution of moisture along the interface. The latter parameter influences also the value of degree of saturation and therefore, the ease of biogas at the base of MOL. Dry density of MOL material is another parameter that controls the ease of upward flow of biogas. The main limitations of the present study are associated with the number of tested MOL materials and the inability of SEEP/W in considering the evapotranspiration. However, considering reasonable assumptions in simulations and using the data from the literature, it was attempted to reduce the limitations. Based on the results of experiments and numerical simulations, some design steps and considerations for selection of the MOL material and the slope of interface were suggested that incorporate the unsaturated hydraulic behavior into the design necessities for an efficient PMOB so that the maximum possible methane oxidation capacity of MOL material is exploited.
Keywords: passive methane oxidation biosystems, unsaturated hydraulic behavior, numerical simulation, gas flow behavior, air permeability
iv
REMERCIEMENTS
Je souhaite transmettre mes sincères remerciements à :
Alexandre Cabral, mon directeur de recherche, pour tous les moments où il m’accompagnait
comme un grand frère, pour la joie qu’il me donnait comme un ami précieux, pour avoir enlevé des obstacles sur mon chemin comme un père, et pour tout ce que je suis « speechless » à décrire…
Lalé et Behna (mes sœurs), Sirous (mon frère), Babak (mon beau-frère), Marzié (ma
belle-sœur) et Arshida & Arnika (mes nièces) avec qui ma vie possède des belles couleurs et d’agréables fragrances…
Jean-Guy Lemelin, le technicien du laboratoire de mécanique de sols et géoenvironnement,
qui ne me laissait jamais baisser les bras, qui encourageait ma « ténacité » et qui me ramenait vers des résultats fiables…
Serge Leroueil, professeur titulaire à l’Université Laval, qui n’hésitait jamais à collaborer
avec nous et à nous fournir ses expériences précieuses de plusieurs dizaines d’années…
Tous mes amis et mes collègues pour leur présence appréciée dans ma vie : Samaneh
Amirpour, Mitra Yousefi, Alireza Asadian, Elham Narimani, Bahman Khabiri, Mahbod Sedaghat, Orod Naghibi, Nasim Daemi, Fahimé Rafiee, Hilda Varshochi, Mathieu Nuth, Valérie Dussault, Yulia Vasianovich, Steeve Ambroise, Philippe Tétreault, Serge-Étienne Parent, Carolina Lopera, Sebastian Sanchez, Éliane Ndanga, Éric Bivumburanyiki, Marlon Capanema, Rocio Segura, Ana Oliveira, Karina Santamaria, mes amis de « les sentiers de l’Estrie », mes amis haïtiens (Christopher, Anglade, Wilson), mes amis brésiliens (Pedro et Guilherme) et quiconque a remplacé même une seconde de ma solitude par sa compagnie…
et finalement à mon pays l’Iran qui m’a accueillie sur la terre pour la première fois dans le monde, et qui m’a appris la persévérance pour faire du progrès, tasser les difficultés et créer le maximum possible du minimum existant…
v
TABLE OF CONTENTS
RESUMÉ ... i ABSTRACT ... iii REMERCIEMENTS ... iv TABLE OF CONTENTS ... vLIST OF FIGURES ... vii
LIST OF TABLES ... x
LIST OF SYMBOLS ... xi
LIST OF ABBREVIATIONS ... xiii
CHAPTER 1. INTRODUCTION ... 1
1.1. General context and problematic ... 1
1.2. Definition of research project ... 3
1.3. Objectives ... 4
1.4. Statement of originality ... 5
1.5. Structure of the document ... 6
CHAPTER 2. LITERATURE REVIEW ... 9
2.1. Biogas production in landfills ... 9
2.2. Passive methane oxidation biosystems ... 11
2.3. Flow of gas through unsaturated soils ... 14
2.4. Capillary barrier effect ... 18
CHAPTER 3. A NEW DESIGN CRITERION FOR PASSIVE METHANE OXIDATION BIOSYSTEMS ... 21
3.1. Introduction ... 23
3.2. Materials and methods ... 26
3.2.1. Materials ... 26 3.2.2. Testing ... 27 3.3. Results ... 30 3.3.1. Fine Sand ... 30 3.3.2. Sand-compost mixture ... 34 3.4. Discussion... 37
3.4.1. Relationships between the shapes of the Standard Proctor Curve, WRC and ka-function ... 37
3.4.2. Relationships between Sr-occ values and Sr at the line of optima and Sr at AEV .. 46
3.4.3. Design Steps ... 47
3.4.4. Further design considerations ... 49
3.5. Conclusions ... 49
CHAPTER 4. INFLUENCE OF CAPILLARY BARRIER EFFECT ON BIOGAS DISTRIBUTION AT THE BASE OF PASSIVE METHANE OXIDATION BIOSYSTEMS51 4.1. Introduction ... 53
4.2. Materials and methods ... 57
4.2.1. Site configuration ... 57
4.2.2. Hydraulic properties of the materials ... 57
4.2.3. Gas Flow Properties of MOL Material ... 61
4.2.4. Numerical Simulations ... 63
4.3. Results ... 65
4.3.1. Reference simulation ... 65
vi
4.3.3. Effect of Initial dry density ... 72
4.3.4. Effect of ksat-MOL ... 74
4.3.5. Effect of slope ... 75
4.4. Discussion... 78
4.5. Conclusions ... 81
CHAPTER 5. EVALUATION OF THE UPWARD FLOW OF BIOGAS AT THE BASE OF METHANE OXIDATION LAYER OF THREE PMOBS ... 83
5.1. Introduction ... 83
5.2. Materials and methods ... 83
5.2.1. Site configurations ... 83
5.2.2. Hydraulic properties of the materials ... 84
5.2.3. Design parameters for flow of biogas at the base of MOL ... 87
5.2.4. Numerical simulations ... 90 5.3. Results ... 93 5.3.1. German design ... 93 5.3.2. Danish design-combination 1 ... 94 5.3.3. Danish design-combination 2 ... 98 5.4. Conclusions ... 101
CHAPTER 6. CONCLUSIONS AND RECOMMENDATIONS... 102
6.1. Summary and conclusions ... 102
6.2. Limitations and recommendations for future studies ... 103
APPENDIX A. MEASURING THE COEFFICIENT OF AIR PERMEABILITY IN LABORATORY ... 105
APPENDIX B. ASSESSMENT OF BIOGAS DISTRIBUTION AT THE BASE OF PASSIVE METHANE OXIDATION BIOSYSTEMS ... 108
vii
LIST OF FIGURES
Figure 2-1: Fate of methane in a landfill cell, adapted from Staub et al. [2011] ... 10 Figure 2-2: General concept of: (a) biocovers, adapted from Staub et al. [2011], (b) biowindows, adapted from Scheutz et al. [2011], and (c) biofilters, adapted from Staub et al. [2011] ... 13 Figure 2-3: Air flow systems in unsaturated soils, adapted from Fredlund et al. [2012] ... 15 Figure 2-4: Validity of Darcy’s law for flow of gas in soils, at great or low mean gas pressure, adapted from Fredlund et al. [2012] ... 18 Figure 2-5: Hydraulic conductivity functions of the MOL and GDL materials, used to construct the experimental PMOB2 at the St-Nicephore landfill ... 20 Figure 3-1: Schematic layout of a PMOB ... 26 Figure 3-2: Standard Proctor curves and test points of (a) fine sand, and (b) sand-compost mixture ... 28 Figure 3-3: WRCs of fine sand samples at two initial water content values (one dry and the other wet of the line of optima) and three different values of initial dry density; (a) 1750 kg/m3, (b) 1650 kg/m3 and (c) 1550 kg/m3 ... 32 Figure 3-4: Variations in the coefficient of air permeability of fine sand with volumetric air content (θa), at several values of differential pressure ... 32
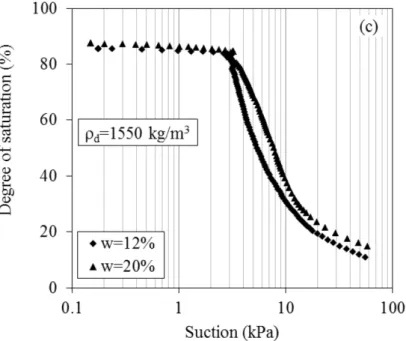
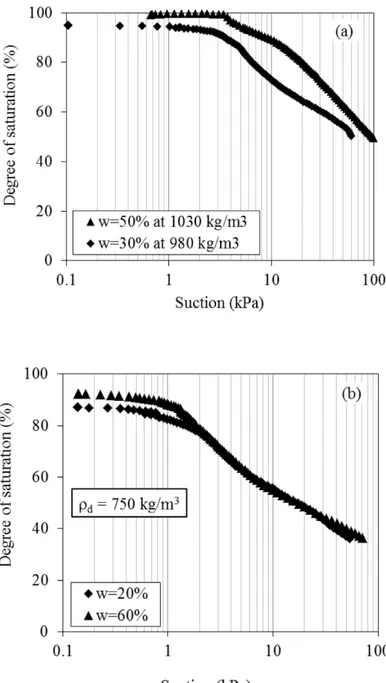
Figure 3-5: WRCs of sand-compost mixture samples at two initial water content values (dry and wet ofoptima) and at: (a) Standard Proctor dry densities (about 1000 kg/m3), and (b) in
situ ρd (750 kg/m3) ... 35
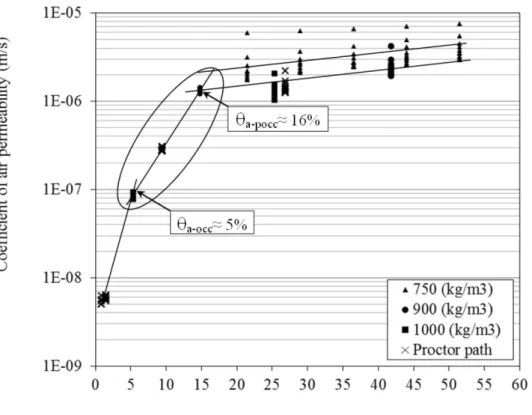
Figure 3-6: Variations in coefficient of air permeability of sand-compost mixture with volumetric air content (θa) at several differential pressure values ... 36
Figure 3-7: The WRCs of (a) silty sand adapted from Springer et al. [1998], (b) fine sand (this study), (c) sand adapted from Kamiya et al. [2006], (d) sand-compost (this study), (e) clay (CH) adapted from Jucá and Maciel [2006], and (f) landfill cover material adapted from Marinho et al. [2001] ... 40 Figure 3-8: The ka-functions of materials from other studies, adapted from (a) Springer et al.
[1998], (b) Jucá and Maciel [2006], (c) Marinho et al. [2001], and (d) Kamiya et al. [2006] 42 Figure 3-9: Relationship between the slope of desaturation zones of WRCs and the slope of ka-functions for θa > θa-occ or θa > θa-pocc, for materials from other studies and this study ... 44
Figure 3-10: Compaction curves of (a) fine sand (this study), (b) Landfill cover material adapted from Marinho et al. [2001], (c) MH-CH adapted from Langfelder et al. [1968], and (d) sand-compost (this study) ... 45 Figure 3-11: The ka-function of the MH-CH material adapted from Langfelder et al. [1968],
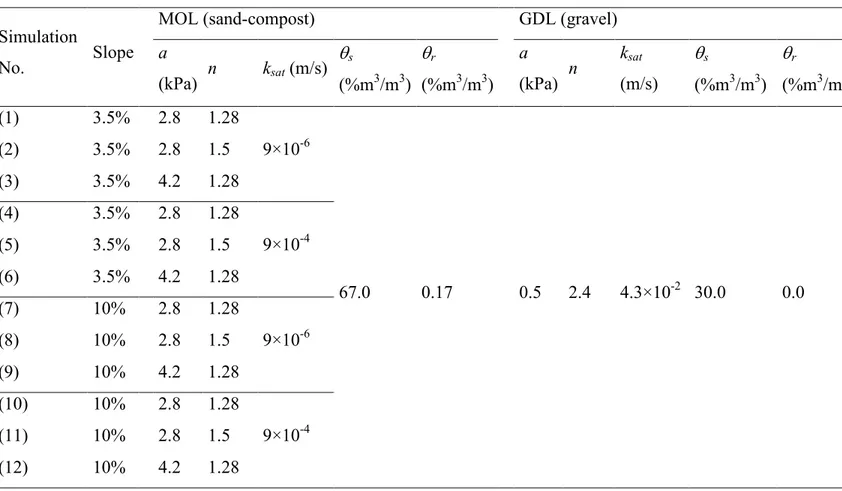
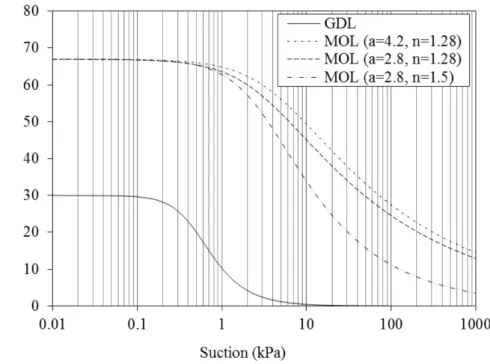
accompanied by materials tested in this study ... 46 Figure 4-1: Water retention curves of the materials used in the parametric analysis ... 60 Figure 4-2: Hydraulic conductivity functions of the materials used in the parametric analysis; (a) ksat-MOL = 9×10⁻⁶ m/s, and (b) ksat-MOL = 9×10⁻⁴ m/s ... 61
Figure 4-3: Gas intrinsic permeability function of the material used as MOL in numerical simulations ... 62 Figure 4-4: Dimensions and boundary conditions of the SEEP/W simulations (slope is variable) ... 64 Figure 4-5: The daily rate of seepage into the PMOB2 during 246 days, from March to November ... 65
viii
Figure 4-6: Distribution of θw in interface points at several time steps in simulation No. 1
(Reference simulation) ... 67 Figure 4-7: Distribution of K in interface points at several time steps, for simulation No. 1.. 68 Figure 4-8: Distribution of θw in interface points at several time steps, for simulation No. 2 69
Figure 4-9: The WRC of the Reference MOL and materials from other studies ... 70 Figure 4-10: variation of (a) coefficient of air permeability and (b) gas intrinsic permeability with θa in materials from other studies ... 71
Figure 4-11: The corresponding grain size distribution curves of WRCs of MOL materials with a=2.8 and n equal to 1.28 or 1.5, using the Fredlund et al. equation [2002] ... 72 Figure 4-12: Distribution of θw in interface points at several time steps, for simulation No. 3
... 73 Figure 4-13: Distribution of θw in interface points at several time steps, for (a) simulation No.
4, (b) simulation No. 5, and (c) simulation No. 6 ... 75 Figure 4-14: Distribution of θw in interface points at several time steps, for (a) simulation No.
7, (b) simulation No. 8, and (c) simulation No. 9 ... 77 Figure 4-15: Distribution of θw in interface points at several time steps, for (a) simulation No.
10, (b) simulation No. 11, and (c) simulation No. 12 ... 78 Figure 4-16: θw-max values in interface points, for several values of a,n, ksat-MOL and slope .... 79
Figure 4-17: Maximum ∆θw in interface points, for several values of a, n, ksat-MOL and slope 80
Figure 4-18: The time associated with attaining the θw-max in interface points, for several
values of a, n, ksat-MOL and slope ... 81
Figure 5-1:(a) WRCs, and (b) k-fcts, used in simulation of German design ... 85 Figure 5-2: (a) WRCs, and (b) k-fcts, used in Danish design-combination 1 and Danish
design-combination 2 ... 86
Figure 5-3: Gas intrinsic permeability function of (a) fine sand, and (b) sand-compost, and the corresponding design parameters ... 88 Figure 5-4: Definition of (a) LUGM in German design, and (b) one segment and the LUGMi
in Danish design-combination 1 and Danish design-combination 2 ... 89 Figure 5-5: Meshing and boundary conditions of SEEP/W simulations for (a) German design, (b) Danish design-combination 1, and (c) Danish design-combination 2 ... 91 Figure 5-6: The daily rate of seepage into (a) German design, and (b) Danish
design-combination 1 and Danish design-combination 2 ... 92
Figure 5-7: Evolution of θw with time in interface points of (a) upper interface (within
subsoil), and (b) lower interface (within sand), in German design ... 94 Figure 5-8: Evolution of (a) θw in interface points, and (b) LUGMi with time in Danish
design-combination 1 ... 96
Figure 5-9: Evolution of (a) θw in interface points, and (b) LUGMi with time in modified
Danish design-combination 1 (14% slope of interface at each segment) ... 97
Figure 5-10: Evolution of θw with time in interface points of Danish design-combination 2 in
(a) upper interface (within sand-compost layer), and (b) lower interface (fine sand layer)... 99 Figure 5-11: Evolution of LUGMi with time in Danish design-combination 2 ... 100
Figure A-1: (a) sampling mold (permeameter), (b) the mold surrounding the membrane, and (c) compaction rammer ... 106 Figure A-2: (a) the permeameter and the sample after the sample preparation process, and (b) the assembly ready to run an air permeability test ... 107 Figure B-1: The curve of Standard Proctor test, in-situ condition and air permeability and HYPROP test points ... 112 Figure B-2: WRC (a) and SACC (b) of samples on field density path. ... 112
ix
Figure B-3: The WRC (a) and SACC (b) of samples on Standard Proctor path. ... 113 Figure B-4: Relationship between the coefficient of air permeability and air flow rate for samples at field density path and Standard Proctor path, submitted to several differential pressure values. ... 114 Figure B-5: Relationship between the coefficient of air permeability at several differential pressure values and (a) volumetric air content; (b) degree of saturation. ... 115
x
LIST OF TABLES
Table 4-1: Hydraulic properties of the materials used in the numerical simulations ... 59 Table 5-1: Hydraulic properties of the materials used in the numerical simulations ... 87
xi
LIST OF SYMBOLS
CH4: methane CO2: carbon dioxide O2: oxygen NH4+: ammonium NO3-: nitrateva: velocity of air flow
ka: coefficient of air permeability
y ha
∂ ∂
: pore-air pressure gradient Ps: absolute outlet air pressure
Pe: absolute inlet air pressure
Q: volumetric air flow rate
A: cross-sectional area of the sample ∆x: sample’s height
g: acceleration of gravity (m/s2)
µ: dynamic viscosity of air at ambient temperature ν: cinematic viscosity of air at ambient temperature M: empirical parameter of the Ball et al. [1988] equation N: empirical parameter of the Ball et al. [1988] equation θa: volumetric air content
θa-occ: volumetric air content at occlusion
θa-pocc: volumetric air content at pre-occlusion
Sr: degree of saturation
Gs: specific gravity of soil grains
Cu: coefficient of uniformity
D10: effective diameter
foc: organic matter content
w: water content
wopt: optimum water content
ρd: dry density
ρd-max: maximum dry density
K: gas intrinsic permeability ψ: suction
ksat: saturated hydraulic conductivity
k-fct: hydraulic conductivity function θw: volumetric water content
θr: residual volumetric water content
θs: saturated volumetric water content
θw-occ: volumetric water content at occlusion
θw-pocc: volumetric water content at pre-occlusion
θw-max: maximum volumetric water content
∆θw: difference between maximum and minimum values of θw along the interface
a: curve fitting parameter for the van Genuchten [1980] model n: curve fitting parameter for the van Genuchten [1980] model
xii
m: curve fitting parameter for the van Genuchten [1980] model kw: hydraulic conductivity
xiii
LIST OF ABBREVIATIONS
English:GHG: greenhouse gas
PMOB: passive methane oxidation biosystems GWP: global warming potential
MOL: methane oxidation layer GDL: gas distribution layer
LUGM: length of unrestricted gas migration WRC: water retention curve
MSW: municipal solid waste
ka-function: air permeability function
AEV: air entry value CB: capillary barrier
GSD: grain size distribution
LUGMi: length of unrestricted gas migration within a segment
LUGMsc: length of unrestricted gas migration along the sand-compost within a segment
SPP: Standard Proctor path FDP: field density path
SACC: soil-air characteristic curve Français:
CRE: courbe de retention d’eau
BOPM: biosystèmes d’oxydation passive du méthane LMSG : la longueur de la migration sans restriction du gaz
1
CHAPTER 1. INTRODUCTION
1.1. General context and problematic
Every year, the biodegradation of organic wastes in landfills produces thousands of tons of biogas. The biogas produced in landfills contents 45-60% dioxide carbon (CO2) and 40-55%
methane (CH4), both known as greenhouse gases (GHG) and responsible for climate change
[IPCC, 2001]. Reduction of GHG emissions is a commitment to prevent the disaster of global warming, and several countries are trying to find solutions to reduce the dangerous anthropogenic interface of GHG with the climate system. Implementation of biogas collection systems and final covers are the most common solutions to eliminate the biogas emissions from landfills. However, neither of these systems is 100% efficient and therefore, some fugitive biogas would emit to the atmosphere.
Passive methane oxidation biosystems (PMOBs) are sustainable and cost-effective engineered systems that aim at reducing CH4 fugitive emissions, i.e. the produced biogas not captured by
gas collection systems or emitted from cracks and other preferential paths within the final cover. In PMOBs, CH4 is oxidized into CO2. Since the global warming potential (GWP) of
CH4 is 25 times greater than the GWP of CO2, there is a net advantage to employ technologies
that oxidize fugitive CH4 emissions into CO2. PMOBs are, indeed, parts of the landfill final
cover, which may coat the whole surface of the cover, or may be locally incorporated into the existing cover – required by the regulations – to eliminate the observed fugitive emissions.
Methane oxidation occurs in the near surface methane oxidation layer (MOL) of PMOBs. This is where a group of naturally occurring and ubiquitous bacteria, the methanotrophs, oxidize CH4 into CO2 through the biochemical reactions. In addition to MOL, a layer of
coarse-grained material is constructed beneath the MOL, which is called gas distribution layer (GDL). GDL aims at intercepting fugitive emissions and distributing them at the base of MOL. The idea is to avoid emissions concentrated in preferential pathways, which may lead to the formation of hotspots. In other words, good PMOB design requires fugitive emissions intercepted by the GDL to be uniformly distributed as possible [Cabral et al., 2010b;
2
Fredenslund et al., 2010; Gebert et al., 2011a; Pokhrel et al., 2011; Rachor et al., 2011; Scheutz et al., 2011; Ndanga et al., 2015].
Several environmental and biological studies report on factors controlling or influencing CH4
oxidation in PMOBs, such as temperature, CH4/O2 ratio, pH, moisture, nutritional sources,
vegetation and the texture of the MOL material [e.g. Einola et al., 2007; Ait-Benichou et al., 2009; Huber-Humer et al., 2009; Gebert et al., 2011a; Scheutz et al., 2011; Capanema and Cabral, 2012; Chi et al., 2012; He et al., 2012; Roncato and Cabral, 2012; Ndanga et al., 2015; Tate, 2015]. The share of air-filled pores [Gebert et al., 2011a; Rachor et al., 2011] and the distribution of CH4 at the base of MOL [Cabral et al., 2010a; Fredenslund et al., 2010;
Scheutz et al., 2011] influence the CH4/O2 ratio within the MOL and CH4 loading
(concentration and flux of methane) at the base of MOL. These two are of particular concern for this study.
The share of air-filled pores, which depends on the dry density and degree of saturation of MOL materials, controls the ease of gas flow through the soil pores [Langfelder et al., 1968; Springer et al., 1998; Maciel and Jucá, 2000; Marinho et al., 2001; Jucá and Maciel, 2006; Tang et al., 2011]. In PMOBs, the precipitation, the choice of initial dry density of MOL material and the settlements in MOL affect the amount of available air-filled pores for downward flow of O2 and upward flow of CH4 within the MOL. Moreover, the capillary
barrier effect along the interface between GDL and MOL may cause the accumulation of seepage in MOL, non-uniform distribution of moisture along the GDL-MOL interface of inclined PMOBs and the occlusion of air-filled pores, which could provoke the restricted upward flow of biogas at the base of MOL. The capillary barrier effect results from the contrast between the unsaturated hydraulic behavior of MOL and GDL materials. Consequently, the biogas would be deviated non-uniformly within the GDL toward the available flow paths – with lower degrees of saturation – in MOL.
The greater the available surface for unrestricted upward flow of biogas at the base of MOL, the more efficient the CH4 oxidation in MOL would be. The upward flow of biogas through
the preferential pathways may create local surface biogas emissions with concentrations greater than that accepted by regulations, i.e. hotspots, especially at upslope of inclined PMOBs.
3
1.2. Definition of research project
The field measurements and numerical analyses performed on three experimental inclined PMOBs in Canada, Germany and Netherlands prompted the present study. The resulting observations are as follows:
• St-Nicephore, Quebec, Canada (PMOB2): non-uniform distribution of CH4
concentrations in surface scans, i.e. greater concentrations at upslope than that associated with downslope. The surface emissions, however, were all lower than 500 ppm, the accepted range by Quebec regulations [Cabral et al., 2010b].
• Germany and Netherlands: reports of persistent presence of hotspots at upslope of both PMOBs in Germany [Bohn and Jager, 2011] and Netherlands [Röwer et al., 2012].
• Numerical analysis: degrees of saturation greater than 85% (considered as the occlusion of air-filled pores) along the interface between MOL and GDL of the latter two PMOBs in steady-state simulations using SEEP/W [Tétreault et al., 2013].
Since 2006, sets of field and laboratory measurements have been performed to evaluate the efficiency of several experimental PMOBs constructed at the St-Nicephore landfill, where very low surface methane concentrations and high efficiencies in methane oxidation and odor reduction were reported [e.g. Jugnia et al., 2008; Ait-Benichou et al., 2009; Abdolahzadeh et al., 2010; Cabral et al., 2010b; Capanema and Cabral, 2012; Roncato and Cabral, 2012; Lakhouit et al., 2014; Ndanga et al., 2015]. However, the field measurements of PMOB2, conducted by Cabral et al. [2010b], showed high average values of degree of saturation (75% - 90%) in MOL close to the GDL-MOL interface. The results of laboratory-scale column experiments on the material used to construct the MOL of the German PMOB showed 100% methane oxidation efficiency. In addition, the profile of field tests indicated that the MOL material can provide an adequate milieu for methane oxidation. The moisture contents, however, were higher at downslope of the PMOB than that given by the upslope [Bohn and Jager, 2011]. Performing sets of laboratory column tests, high methane oxidation efficiencies
4
were obtained for the MOL material of the PMOB constructed in the Netherlands [Gebert et al., 2011b]. Moreover, the field measurements showed that the methane oxidation efficiencies were ~85% over the majority of the surface [Röwer et al., 2012], although the methane concentrations were significantly increasing toward the upslope [Geck et al., 2012]. These observations show that, in addition to providing the environmental requirements for biological activities of methanotrophs, it is essential to design the PMOBs considering the unsaturated hydraulic parameters that influence the ease and the distribution of upward flow of biogas at the base of MOL. Otherwise, the biological capacity of the MOL material to oxidize the CH4
would not be exploited adequately, and the materials remain unserviceable.
The present research project studies the flow of biogas within the MOL, influenced by unsaturated hydraulic behavior of the MOL material when superimposed over a coarser layer (GDL), which creates a capillary barrier effect along the GDL-MOL interface. In order to identify the threshold of unrestricted gas flow, the variation in coefficient of air permeability with degree of saturation was assessed for the materials used to construct the MOL of two experimental PMOBs at the St-Nicephore landfill (Quebec, Canada). The air permeability function was studied along with the water retention curves (WRCs) and the Standard Proctor curves of the materials. Indeed, the gas flow behavior, unsaturated hydraulic behavior and compaction behavior of the materials were evaluated simultaneously. Performing a parametric study, PMOB2 was simulated using unsaturated flow finite element modelling to study the effect of the slope of interface and parameters defining the WRC and hydraulic conductivity function of MOL material on value and distribution of moisture along the interface. The biogas flow behavior at GDL-MOL interface of an experimental PMOB constructed in Denmark was also evaluated. The interface of this PMOB has a jagged form, assuming that a permanent available pathway on top of each segment would be provided for upward flow of biogas, while the bottom parts are restricted due to the seepage accumulation. Performing sets of numerical simulations in SEEP/W, the validity of this assumption was assessed.
1.3. Objectives
Considering the necessity to provide the required ease and distribution of biogas at the base of MOL, the present study aimed mainly at responding the following question:
5
In order to answer the question of the research, it was hypothesised that all the taken steps should converge on maintaining the widest possible surface at the base of MOL where gas migration upwards is unrestricted. Assuming PMOBs as semi-finite media, the length along the GDL-MOL interface – measured horizontally – where biogas can hypothetically migrate without restriction was denominated length of unrestricted gas migration (LUGM). It is proposed to adopt LUGM as one of the main design criteria, which should possess the greatest possible value in a good design of PMOB. Therefore, the objectives of the present study are defined as:
1) Identifying the threshold of unrestricted gas migration in MOL to be used as the end of the LUGM, using air permeability function or other accessible and easy-to-use geotechnical tools, such as WRC and Standard Proctor curve.
2) Evaluating the effect of unsaturated hydraulic behavior of the MOL material, including parameters defining WRC and hydraulic conductivity function, on distribution of moisture along the GDL-MOL interface.
3) Presenting design steps and recommendations, which help the choice of MOL material aiming at the longest possible LUGM and reducing the risk of hotspot creation.
1.4. Statement of originality
To the author’s knowledge, this is one of the first studies that introduce hydraulic aspects of unsaturated flow of seepage and biogas in the design of PMOBs, by considering the importance of the capillary barrier effect along the GDL-MOL interface. It is also the first to introduce a design criterion for PMOBs, the one that is based on a coherent set of steps taken to achieve the main goal of a PMOB. The design criterion takes the form of the parameter LUGM, which translates the required ease of upward flow of biogas at the base of MOL. In
How to define a design criterion that incorporates the capillary barrier effect, the ease and the distribution of biogas at the base of MOL into the design of PMOBs?
6
addition, the more influencing unsaturated hydraulic parameters of MOL material on value and distribution of moisture along the GDL-MOL interface were identified. The author believes that the design criterion and considerations presented herein, along with environmental requirements, would form a more comprehensive guideline for design of PMOBs.
1.5. Structure of the document
The present thesis consists of 6 chapters:Chapter 2: A literature review is presented, which explains a brief theoretical basis on methane production in landfills and the role of passive methane oxidation biosystems in eliminating the methane emissions to the atmosphere. In addition, the principles of gas flow in unsaturated soils and capillary barrier effect are presented to clarify more elaborately the specific context of the present research project.
Chapter 3: It presents one of the submitted journal papers composed from the results obtained during the present research project. Sets of laboratory experiments were performed to obtain the air permeability functions, water retention curves and Standard Proctor curves of the materials used to construct the MOL of two experimental PMOBs at the St-Nicephore landfill (Quebec, Canada). The onset of abrupt decrease in coefficient of air permeability with volumetric air content was identified on air permeability functions, and was suggested as the design parameter to define quantitatively the LUGM. This latter threshold on air permeability function was correlated to the degree of saturation at air entry value of WRC and at line of optima in Standard Proctor curve. Moreover, the relationship between the shapes of air permeability function, WRC and Standard proctor curve were assessed to establish a methodology for obtaining the design parameter in the absence of air permeability function.
Chapter 4: This chapter includes the results of a parametric study submitted as a journal paper. Numerical simulations, using the finite element software SEEP/W, were conducted to evaluate the effect of the slope of interface and the parameters defining the WRC and hydraulic conductivity function of MOL material on value and distribution of moisture along
7
the GDL-MOL interface. Several values of variables were used and the ease and the level of uniformity in distribution of upward flow of biogas were studied, using the design parameter and design criterion presented in chapter 3. The reference simulation was an experimental PMOB at the St-Nicephore landfill (PMOB2) whose MOL material was evaluated in chapter 3.
Chapter 5: The results of transient-state SEEP/W simulations, performed on two experimental PMOBs constructed in Germany and Denmark, are presented. The design parameters were identified, using the methodology suggested in chapter 3. The German PMOB, where upslope hotspot was reported, was simulated using the data provided for the precipitation and GDL and MOL materials. There results were compared with those given by steady-state analysis conducted by Tétreault et al. [2013]. The innovative design of the Danish PMOB, i.e. jagged form of the GDL-MOL interface, was evaluated. Due to the lack of actual data of the site, the characteristics of the GDL and the MOL materials of PMOB2 (St-Nicephore, Quebec, Canada) were used in simulations. In order to enhance the performance of the Danish PMOB and approaching the aim of the idea behind constructing a jagged interface, the MOL was substituted by a two-layer MOL whose methane oxidation efficiency was studied by Ndanga et al. [2015]. In all analyses, the value of LUGM and the distribution of the volumetric water content along the GDL-MOL interface were assessed.
Chapter 6: A summary of the conclusions obtained from the laboratory experiments and the parametric study is presented in this chapter. In addition, some recommendations for future studies are presented to develop a more comprehensive documentation on the subject, with fewer limitations.
Appendix: A summary of several types of permeameter suggested in the technical literature to measure the coefficient of air permeability is presented in Appendix A. In addition, the new design of permeameter, used in the air permeability experiments of the present study, is described. Appendix B presents a conference paper, which was published based on the preliminary results obtained during the air permeability tests on the sand-compost mixture used to construct the MOL of PMOB2. Finally, Appendix C consists of a short report of numerical simulations performed to analyze the design of domestic wastewater refinement systems in Canada. The main objective was, in fact, the evaluation of the influence of
8
capillary barrier effect on occlusion of air-filled pores and biological activities of the aerobic bacteria inhabiting in the enviro-septic pipes and responsible for sewage refinement.
9
CHAPTER 2. LITERATURE REVIEW
2.1. Biogas production in landfills
Landfilling is a major element in municipal solid waste (MSW) management, which basically aims at protecting the environment against hazardous effects of the waste. Shortly after MSW disposal, the anaerobic degradation of the waste commences whose product, among others, is the biogas composed of 45-60% methane and 40-55% carbon dioxide. Both these latter gases are known as greenhouse gases (GHG), contributing to climate change. The global warming potential of CH4 is 25 times greater than that given by CO2 on a weight basis over a 100-year
time period. The waste degradation can begin 3 months after the waste decomposition and it lasts over 20-50 years [Zamoranoa et al., 2007]. On 2005, the atmospheric concentration of CH4 exceeded the natural range of the last 650,000 years, i.e. 320 to 790 parts per billion,
which was determined from the ice cores [IPCC, 2001]. 3-10% of the anthropogenic CH4
emissions belong to the landfills. In 2009, U.S. landfills were the third largest source of human-related CH4 emissions and responsible for 17 % of overall [USEPA, 2011]. Forced by
Kyoto protocol, several countries have to find the alternatives to mitigate CH4 emissions.
Three main mechanisms define the reduction of methane emissions in landfills: microbial, physical and chemical. Microbial mechanism means the oxidation of methane by microorganisms, physical is the temporary storage of CH4 in pores or being dissolved in
water, and finally chemical mechanism is the process of slowing-down and bypass of gas flux [Huber-Humer et al., 2009]. Spokas et al. [2006] proposed a mass balance equation for the fate of the CH4 produced by landfills, as follows:
CH4 produced = CH4 emitted + CH4 collected + CH4 oxidized + CH4 migrated + ∆CH4
10
The collected and the oxidized CH4 parts of Equation ( 2-1) belong to the installation of biogas
collection systems and landfill covers, which play a key role in eliminating the biogas emissions directly to the atmosphere. Figure 2-1 shows the illustration of Equation ( 2-1).
Figure 2-1: Fate of methane in a landfill cell, adapted from Staub et al. [2011]
Four steps can be defined for the typical landfill life, based on which the required system of biogas elimination will be selected: step A) operation, step B) post-operation, step C) aftercare, and step D) long-term custodial care. During step A, i.e. disposal and compaction of the waste, daily cover or a light geosynthetic layer without oxidation ability is installed. Some partial collection of biogas may be performed in modern landfills. Intermediate covers are installed during step B, to cover a section where waste will not be disposed for at least 1 year. Once the capacity of the landfill to accept the waste is attained, i.e. step C, a permanent final cover is constructed. During step D, the active monitoring of the landfill is not required any more, since no significant hazard for the environment is assumed [Barlaz et al., 2009; Spokas and Bogner, 2011; Staub et al., 2011]. Biogas collection systems are more efficient and cost effective while the decomposition of waste generates a large amount of methane. Therefore, according to the US Clean Air Act New Source Performance Standards (NSPS), the biogas collection systems must be installed within the first few years of step C or within 5 years after the last disposal of the waste, whichever occurs earlier [Barlaz et al., 2009; Spokas and Bogner, 2011]. These systems are composed of vertical wells and horizontal perforated pipes, where the collected CH4 will be flared and therefore, oxidized to CO2, or will be combusted to
produce electricity and heat energy. According to IPCC [2001], the CO2 emitted during
11
is not included in the emission calculation. However, flaring can release harmful products for the health into the atmosphere [Hettiarachchi et al., 2009]
When the rate of biogas generation is not sufficiently high for an efficient flaring – such as in old or abandoned landfills – the operation of biogas collection systems are technically and economically challenging [Huber-Humer et al., 2008; Scheutz et al., 2009a; Scheutz et al., 2009b; Chiemchaisri et al., 2010]. Consequently, biogas collection systems are ceased during the passive phase, i.e. step D, and hence, the biogas would be released to the atmosphere. Although the rate of biogas production decreases gradually, the quantity of long-term release of biogas could be considerable and harmful for the environment [Cabral, 2012]. Therefore, constructing the covers with the ability of methane oxidation, in the absence or in combination with biogas collection systems, would increase the capacity of CH4 mitigation
and the cost efficiency of the implemented systems to eliminate the hazards of the landfills. However, neither of these methods is 100% efficient in avoiding the migration of produced methane by the landfill to the atmosphere.
2.2. Passive methane oxidation biosystems
Oxidation of CH4 into CO2 through the implementation of biosystems is considered as a
cost-effective method, which targets further reduction in fugitive emissions. The methanotrophic bacteria, inhabiting in constituting soil layers of the biosystems, oxidize the methane through aerobic biological processes. Equation ( 2-2) shows the biochemical reaction associated with the aerobic oxidation of CH4:
CH4 + 2O2 CO2 + 2H2O + heat ( 2-2)
6-96% of the methane produced in a landfill could be oxidized by biosystems [He et al., 2012]. However, it still remains some fugitive emissions around gas collection or leachate drainage systems [Scheutz et al., 2011]. Passive methane oxidation biosystems (PMOBs) are indeed, engineered systems to enhance the natural oxidation of methane in landfills, to eliminate fugitive methane emissions, i.e. emissions not captured by biogas collection systems, or to control the emissions in old and small landfills where the installation of biogas
12
collection systems is not an economical choice. PMOBs can be used in landfills with great or low rate of CH4 production [Huber-Humer et al., 2009; He et al., 2012], and they are
constructed during the long-term custodial care [Staub et al., 2011]. Several studies reported very high methane oxidation efficiencies both in laboratory-scale experiments and in experimental field plots [e.g. Huber-Humer et al., 2009; Scheutz et al., 2009a; Cabral et al., 2010b; Rachor et al., 2011; Capanema and Cabral, 2012; He et al., 2012; Roncato and Cabral, 2012; Ndanga et al., 2015].
There are 3 types of PMOBs: 1) biocovers, 2) biowindows, and 3) biofilters. Biocovers replace the entire upper part of the semi-permeable existing cover (Figure 2-2a). Biowindows replace locally the existing cover and enhance the biogas transport to host the CH4 oxidation
process (Figure 2-2b). Biofilters are placed at the end of the biogas collection system to lead the biogas to the biofilter unit (Figure 2-2c) [Scheutz et al., 2011; Staub et al., 2011]. All types of PMOBs consist of two main layers: the near surface methane oxidation layer (MOL) where the CH4 oxidation by methanotrophic bacteria occurs and the underlying gas
distribution layer (GDL), which intercepts fugitive emissions and distributes them as uniformly as possible at the base of the MOL. Generally, the organic rich materials such as composts, sewage sludge, peat, etc., are used in the MOL material to enhance the growth of methanotrophic bacteria. The GDL consists preferably of coarse grained materials, in order to facilitate the distribution and the upward flow of biogas.
Several parameters control the methane oxidation efficiency of PMOBs, including the texture, temperature, moisture content, NH4+ and NO3- contents, vegetation, pH and CH4/O2 mixing
ratio in MOL. Therefore, in order to enhance the methane oxidation efficiency of PMOBs, the MOL material should possess great organic matter content and water retention capacity, coupled with low thermal conductivity, good temperature insulation ability and enough porosity and air-filled pore volume [Huber-Humer et al., 2009; He et al., 2012].
13
Figure 2-2: General concept of: (a) biocovers, adapted from Staub et al. [2011], (b) biowindows, adapted from Scheutz et al. [2011], and (c) biofilters, adapted from Staub et al.
[2011]
The CH4/O2 mixing ratio, the flux of oxygen and CH4 loading at the base of MOL play a vital
role in methane oxidation activity of methanotrophs [Hrad et al., 2012]. The CH4 oxidation
14
meaning that a balance between the upward flow of methane and downward flow of oxygen is required. A CH4/O2 ratio of 1:3 is necessary for an efficient methane oxidation [He et al.,
2012]. Under limited O2 concentrations, active methanotrophs, inhabiting in the upper layers,
do not develop and hence, the aerobic methane oxidation is limited [Chi et al., 2012]. The greater flux of oxygen than the CH4 flux reduces the quality of gas in biogas collection system
and increases the risk of fire inside the landfill [Jung et al., 2009]. In addition, under the great CH4 loading at the base of MOL, methanotrohps cannot oxidize the methane fast enough and
therefore, the methane directly emits to the atmosphere. The lower the CH4 loading, the more
the methanotrophs will be capable to oxidize the upward flow of biogas [Jung et al., 2009; Fredenslund et al., 2010; Gebert et al., 2011a; Pokhrel et al., 2011; Rachor et al., 2011; Scheutz et al., 2011; Ndanga et al., 2015].
In order to sustain the microbial activity of methanotrophs in PMOBs, the moisture content of MOL material equal to 10–20% is required [Chanton et al., 2011; Spokas and Bogner, 2011]. However, the upward flow of CH4 and downward flow of O2 are influenced by the moisture,
and excessive moisture may limit the transport of CH4 and O2 within the MOL: the greater the
degree of saturation, Sr, the lower the flux of CH4 and O2.
Consequently, in a good design of PMOB, the distribution and the magnitude of the moisture in MOL material can be considered as important physical parameters, controlling the methane oxidation efficiency by influencing the CH4/O2 mixing ratio, the distribution and the value of
O2 and CH4 loading. GDL is basically constructed to help the distribution of methane at the
base of MOL. Nonetheless, the capillary barrier effect along the GDL-MOL interface and ensuing accumulation of seepage may restrict the upward flow of biogas or disturb the distribution of biogas along the interface.
2.3. Flow of gas through unsaturated soils
In unsaturated soils, air can be in the form of a continuous phase or occluded air bubbles. The flow of free air (advection) through the unsaturated soils occurs when the air phase is continuous. The main mechanisms for flow of occluded air bubbles, however, are the diffusion and dissolved air flow by advection. The occluded air bubbles are air bubbles
15
distributed in soil phase and their continuous path is broken. The form of the air phase, i.e. continuous or occluded, is controlled by soil properties, water content and degree of saturation [Fredlund and Rahardjo, 1993; Lu and Likos, 2004; Fredlund et al., 2012]. Air flow systems in unsaturated soils are shown in Figure 2-3.
Figure 2-3: Air flow systems in unsaturated soils, adapted from Fredlund et al. [2012] Concentration, density or pressure gradients govern the flow of free air through the continuous air phase of unsaturated soils. The pressure gradient is commonly considered as the only driving potential for the flow of free air. The gaseous diffusion is a process formed by a concentration gradient. In PMOBs, the dominant flow mechanism of CH4 is more
complicated. Indeed, depending on degree of saturation of materials, pressure gradient and concentration gradient, CH4 would preferably flow by advection [Huber-Humer et al., 2008]
or by diffusion [Pokhrel et al., 2011]. Since the process of waste biodegradation continues over time and the produced biogas can build up gradually, the gas pressure would be higher inside the landfill. Therefore, it can be speculated that the pressure gradient can be the primary driving force for upward flow of biogas [Vangpaisal and Bouazza, 2004; Barral et al., 2010]. Changes in ambience temperature or pressure can also result in greater pressure gradients [Rajesh et al., 2014].
In order to describe the flow of air through porous media, Fick’s law or Darcy-type formulation can be used. Using the first Fick’s law, a formulation for the gas flow can be obtained similar to Darcy’s law [Fredlund et al., 2012]. This formulation is as follows:
16 y h k v a a a ∂ ∂ − = ( 2-3) y ha ∂ ∂
is the pore-air pressure gradient, va is the velocity of air flow and ka is the coefficient of
air permeability. The coefficient of air permeability, under steady-state condition, for a gas that behaves in a similar manner to an ideal gas is calculated using Equation ( 2-4):
ν A ) P (P g P Δx μ Q 2 k 2 s 2 e s a − × × × × × × × = ( 2-4)
where Ps (Pa) is the absolute outlet air pressure, Pe (Pa) is the absolute inlet air pressure, Q is
the volumetric air flow rate (m3/s), A is the cross-sectional area of the sample (m2), ∆x is the
sample’s height (m), g is the acceleration of gravity (m/s2), µ is the dynamic viscosity of air at
ambient temperature (Pa.s), and ν is the cinematic viscosity of air at ambient temperature (m2/s).
Coefficient of air permeability can be measured at several degrees of saturation (resulting from pairs of several initial dry density and water content values) and suctions, in order to obtain the air permeability function in the form of ka (Sr), ka (ψ) or ka (θa), where ψ is the
suction and θa is the volumetric air content. θa is defined as the ratio of the volume of
air-filled pores to the total volume of a representative sample of the soil.
The general trend of the air permeability function shows that the coefficient of air permeability is largely influenced by the volume and the arrangement of the soil macropores. The ka values decrease as the volumetric air content decreases (or Sr increases). At a particular
θa value, where the air-filled pores become occluded and the air flows by the gas diffusion
mechanism, an abrupt reduction in ka value occurs. In addition, the more continuous and the
less tortuous the air-filled pores are, the greater the ka value would be. The onset of abrupt
change in ka values was reported to occur at suctions larger than air entry value (AEV) [e.g.
Springer et al., 1998; Jucá and Maciel, 2006; Fredlund et al., 2012] or at optimum water content [e.g. Langfelder et al., 1968; Marinho et al., 2001].
17
Ball et al. [1988] suggested an exponential formulation between ka and θa, which is similar to
the Ahuja et al. model [1984] to relate the hydraulic conductivity and volumetric water content. The Ball et al. equation [1988] is shown in Equation ( 2-5) where M and N are empirical parameters. N is a pore continuity index, which represents the influence of θa, pore
tortuosity and the surface area of the particles in ka value.
N a a Mθ
k = ( 2-5)
The air flow behavior through the soil can also be described by gas intrinsic permeability, K, which is independent of the nature of the migrating fluid and related to the nature of porous medium. Reichenauer et al. [2011] recommended the minimum value of 5×10-13 m2 for the
gas intrinsic permeability of the material used to construct MOL.
At a given void ratio, the intrinsic permeability measured to air in the dry sample should be similar to that with water in the saturated sample. However, Muskat [1937] reported large discrepancies between air intrinsic permeability and water intrinsic permeability. Klinkenberg [1941] explained that the interconnections between the pore capillaries and the gas molecules facilitate the flow of gas molecules through the pores. Therefore, the gas intrinsic permeability would be larger than water intrinsic permeability. This phenomenon, which is known as “Klinkenberg effect” or “gas slippage”, occurs when the diameter of pore capillaries is comparable to the mean free path of the gas, where the gas molecules collide with the walls of the pores more than with other gas molecules. Subsequently, the Darcy’s law with the assumption of zero flow at walls seems to be invalidated by Klinkenberg effect, since the gas flow velocity at walls is not zero when the gas slippage occurs (Figure 2-4) [Fredlund et al., 2012]. Klinkenberg effect is more probable in fine grained porous media whose permeability is lower, and it is negligible at very large gas pressures [Wu et al., 1998]. In addition, the lower the degree of saturation, the more clear the Klinkenberg effect would be [Estes and Fulton, 1956].
18
Figure 2-4: Validity of Darcy’s law for flow of gas in soils, at great or low mean gas pressure, adapted from Fredlund et al. [2012]
2.4. Capillary barrier effect
The capillary barrier effect (CBE) is formed along the interface of two superimposed layers of porous materials possessing contrasting unsaturated hydraulic properties. Indeed, within a particular range of suction values, the hydraulic conductivity value of the upper layer (moisture retention layer, MRL) is greater than that associated with the bottom layer (capillary break layer, CBL). Therefore, when the seepage reaches the top of the MRL, the MRL retains the seepage by capillary forces and limits the percolations toward the CBL[Lu and Likos, 2004].
The sharper the difference between pore size distribution and particle size of the two layers, the more efficient the capillary barrier would be. Proper drainage of the MRL, through the implementation of drainage systems or imposing the inclination, helps maintaining the relatively high suction values along the interface within the range of functional CBE. The combination of gravity force and the CBE along an inclined CBL-MRL interface results in a two dimensional lateral seepage in MRL. Subsequently, the suction would be decreasing and Sr would be increasing toward the downslope. Starting from a particular point (or region),
denominated as breakthrough point, the capillary forces and the ensuing CBE are not functional anymore and the vertical percolation toward the CBL commences. The horizontal distance from the upslope, along which the CBE is efficient, is known as diversion length (DL).
19
Several equations were suggested to calculate the DL under the steady-state condition, which consider the value of DL as a function of hydraulic conductivity functions (k-fct) of the MRL and CBL materials, the slope the CBL-MRL interface and the infiltration rate. The DL may end where the downward flow through the CBL-MRL interface is equal to the steady seepage flow rate [Ross, 1990], which corresponds to the suction at CBL-MRL equal to the water entry value (WEV) of the CBL material [Steenhuis et al., 1991; Walter et al., 2000; Vachon et al., 2015]. The WEV is defined as the suction at which the seepage starts entering the macro-pores of the soil.
The CBE can be used to construct the final cover of landfills to prohibit the infiltrations into the landfill and ensuing leachate production [Stormont, 1996; Khire et al., 2000; Bussière et al., 2003a; Aubertin et al., 2006; Parent and Cabral, 2006; Abdolahzadeh, 2011], or to limit the acid-generation in mine tailings by restricting the downward diffusion of oxygen [Yanful, 1993; Wilson et al., 1995; Williams et al., 1997; Bussière et al., 2003b; Dagenais et al., 2005; Adu-Wusu and Yanful, 2006]. In final landfill covers with capillary barrier effect (CCBE), the design aims at providing the longest possible DL associated with the maximum seepage rates, required by the legislations. For oxygen barriers, the CBE should be efficient enough to yield great Sr values along the CBL-MRL interface and therefore, occluded air-filled pores
and low enough coefficient of oxygen diffusion.
The requirements for the design of a PMOB with sufficient methane oxidation efficiency results in superimposing two soil layers, i.e. MOL and GDL, whose unsaturated hydraulic behavior would create the CBE along the GDL-MOL interface. For example, the k-fcts of the materials used to construct the MOL and the GDL of an experimental PMOB at the St-Nicephore landfill (Quebec, Canada) are shown in Figure 2-5. For suctions greater than ~4.5 kPa, the hydraulic conductivity of MOL material is greater than that associated with GDL material. Therefore, the CBE would be formed along the GDL-MOL interface and the MOL would retain the seepage, until the WEV of the GDL material is attained.
20
Figure 2-5: Hydraulic conductivity functions of the MOL and GDL materials, used to construct the experimental PMOB2 at the St-Nicephore landfill
Although the formation of CBE along the GDL-MOL interface of PMOBs may enhance the prohibition of percolations reaching the wastes, it increases the risk of occlusion of air-filled pores in MOL material attributed to the accumulation of moisture in MOL along the interface. Subsequently, the biogas would emit directly to the atmosphere through the regions with lower Sr values or preferential paths created by cracks. The methanotrophs cannot oxidize
these latter emissions due to the CH4 fluxes and concentrations higher than the capacity of
methanotrophs or the lack of enough moisture for microbiologic activities. These local fugitive emissions may possess CH4 methane concentrations greater than that accepted by
legislations, and they are known as hotspots. The persistent presence of upslope hotspots have been reported during several years of field investigations on PMOBs constructed in Germany [Bohn and Jager, 2009] and the Netherland [Geck et al., 2012; Röwer et al., 2012].
21
CHAPTER 3. A NEW DESIGN CRITERION
FOR PASSIVE METHANE OXIDATION
BIOSYSTEMS
Avant-propos
Titre: Design of Passive Methane Oxidation Biosystems: Considerations about Compaction and Hydraulic Characteristics on Biogas Migration
Auteurs et affiliation:
Bahar Ahoughalandari: étudiante au doctorat, Université de Sherbrooke, Faculté de génie, Département de génie civil
Alexandre R. Cabral: professeur titulaire, Université de Sherbrooke, Faculté de génie, Département de génie civil
Serge Leroueil: professeur titulaire, Université Laval, Département de génie civil et de génie des eaux
Date de soumission: 31 mai 2016
Revue: Geotechnical and Geological Engineering Journal (Springer)
Titre français: La conception des biosystèmes d’oxydation passive du méthane : les considérations de compaction et des caractéristiques hydrauliques sur la migration du biogaz
Contribution au document:
This paper contributes to achieving the first objective of the research project, i.e. identification of the threshold of unrestricted gas migration in MOL to be used as the end of the LUGM. The air permeability functions, WRCs and Standard Proctor curves of the materials used to construct the MOL of two PMOBs at the St-Nicephore landfill (Quebec, Canada) were studied simultaneously. Depending on the behavior observed in WRCs or air
22
permeability functions of the materials, the threshold of the unrestricted gas migration was identified. Therefore, the length of unrestricted gas migration (LUGM) ends when this threshold is attained.
Résumé français :
L'effet de barrière capillaire le long de l'interface entre les deux couches principales des biosystèmes d’oxydation passive de méthane (BOPM), c’est-à-dire la couche d'oxydation du méthane (MOL) et la couche de distribution de gaz (GDL), peut provoquer une restriction sur l’écoulement ascendant du biogaz à la base de la MOL. Cela diminue l'efficacité de l'oxydation du méthane du BOPM et augmente les chances de produire des « hotspots ». Dans cette étude, les critères de la conception sont introduits afin de faciliter d'écoulement du biogaz. La courbe de rétention d'eau (CRE), la fonction de perméabilité à l'air (ka-fonction) et
la ligne d’optima (sur la courbe Proctor Standard) des matériaux utilisés pour la construction de la MOL de deux BOPMs expérimentaux au site d’enfouissement des déchets à St-Nicéphore (Québec, Canada) ont été obtenues au laboratoire. En outre, les caractéristiques principales d'autres matériaux de la littérature ont été exploitées. Par la suite, les critères de conception ont été définis en utilisant les degrés de saturation aux lignes d’optima et la tendance des ka-fonctions et celle des CREs. En considérant ces critères de la conception des
BOPMs, le risque des émissions élevées et localisées du méthane, attribuées à la migration bloquée de gaz à l'interface entre la GDL et la MOL, devrait être réduit.
23
Abstract: The capillary barrier effect along the interface between the two main layers constituting the passive methane oxidation biosystems (PMOB), namely the methane oxidation layer (MOL) and gas distribution layer (GDL), may result in restricted upward flow of biogas at the base of MOL. This decreases the methane oxidation efficiency of the PMOB and increases the chances of hotspot creation. In this study, design criteria are introduced to assess the ease of biogas flow. Laboratory experiments were conducted to obtain the water retention curve (WRC), air permeability function (ka-function) and line of optima (on
Standard Proctor curve) of the materials used to construct the MOL of two experimental PMOBs at the St-Nicephore (Quebec, Canada) landfill. In addition, the main characteristics for other materials were obtained from the literature. Design criteria were then defined based on the degree of saturation at the lines of optima and the pattern of ka-functions and WRCs.
Considering these criteria in the design of PMOBs may help reduce the risk of high surface methane emissions, localized near the top of the slope of PMOBs, caused by restricted gas migration at the GDL-MOL interface.
Keywords: passive methane oxidation biosystems, gas flow behaviour, capillary barrier effect, water retention curve, Standard Proctor curve
3.1. Introduction
Passive methane oxidation biosystems (PMOBs) are considered as cost-effective solutions to reduce fugitive CH4 emissions, i.e. emissions not captured by gas collection systems.
Generally, a PMOB consists of two main layers: the near surface methane oxidation layer (MOL), where methanotrophic bacteria oxidize CH4 into CO2, and the underlying gas
distribution layer (GDL), mainly composed of coarse-grained materials. The main function of the GDL is to intercept fugitive emissions and distribute them as uniformly as possible at the base of the MOL, as illustrated schematically in Figure 3-1. The methane oxidation efficiency of PMOBs depends on several environmental and operational conditions, including the uniformity of the CH4 loading (upward flow of fugitive biogas) at the base of the MOL.
Greater uniformity facilitates the work of methanotrophic bacteria, which results in greater CH4 oxidation efficiencies [Cabral et al., 2010a; Fredenslund et al., 2010; Scheutz et al.,
24
The contrast between the unsaturated hydraulic properties of the constituent materials forming the MOL and GDL leads to the formation of a capillary barrier along their interface, which prevents water to flow from the MOL into the GDL. Consequently, the infiltration of meteoric water into a sloped PMOB and ensuing unsaturated flow would result in an increasing degree of water saturation (Sr) from the top of the slope to the bottom, along the GDL-MOL
interface. Since Sr is a key parameter in controlling gas flow behaviour through unsaturated
soils, the upward migration of fugitive biogas may be diverted within the GDL towards the drier (upslope) parts of the biosystem. This may eventually lead to the creation of a hotspot, i.e. a region of high CH4 fluxes [Cabral et al., 2010a; Bohn and Jager, 2011; Röwer et al.,
2012] and surface CH4 concentrations that can be higher than acceptable by legislation.
Several environmental and biological aspects of methane oxidation in PMOBs have been well documented in the technical literature [Einola et al., 2007; Ait-Benichou et al., 2009; Huber-Humer et al., 2009; Gebert et al., 2011a; Scheutz et al., 2011; Capanema and Cabral, 2012; Chi et al., 2012; He et al., 2012; Roncato and Cabral, 2012; Ndanga et al., 2015; Tate, 2015]. Likewise, the literature abounds with studies that document and analyze air flow through unsaturated soils [Blackwell et al., 1990; Fredlund and Rahardjo, 1993; Vaughan, 2003; Lu and Likos, 2004; Fredlund et al., 2012], the influence of water content on the coefficient of air permeability [Langfelder et al., 1968; Springer et al., 1998; Maciel and Jucá, 2000; Marinho et al., 2001; Jucá and Maciel, 2006; Tang et al., 2011], and the design of oxygen barriers to prevent acid mine drainage [Yanful, 1993; Cabral et al., 2000; Bussière et al., 2003b; Mbonimpa et al., 2003; Maqsoud et al., 2011]. On the other hand, very little has been published about the effects of capillary barriers on CH4 oxidation. For example, Tétreault et
al. [2013] conducted a series of numerical simulations to assess the behaviour of two sloped PMOBs whose MOL and GDL formed capillary barriers. Their results showed that moisture content values were high all along the interfaces, which explained the concentrated fluxes usually found near the top of the two large-scale experimental plots. This behaviour was also observed by Berger et al. [2005], who constructed and monitored the behaviour of an inclined PMOB in the laboratory. In order to minimize the pore obstruction by water associated with the capillary barrier effect, Kjeldsen et al. [2013] constructed an experimental PMOB with a jagged (“zig-zag shape”) GDL-MOL interface. With this very innovative design, the pores in MOL close to the interface and near every crest would be dry enough to allow unrestricted upward flow of biogas.
![Figure 2-1: Fate of methane in a landfill cell, adapted from Staub et al. [2011]](https://thumb-eu.123doks.com/thumbv2/123doknet/2901467.74822/26.892.251.641.256.507/figure-fate-methane-landfill-cell-adapted-staub-et.webp)
![Figure 2-2: General concept of: (a) biocovers, adapted from Staub et al. [2011], (b) biowindows, adapted from Scheutz et al](https://thumb-eu.123doks.com/thumbv2/123doknet/2901467.74822/29.892.245.655.131.949/figure-general-concept-biocovers-adapted-biowindows-adapted-scheutz.webp)


![Figure 3-11: The k a -function of the MH-CH material adapted from Langfelder et al. [1968],](https://thumb-eu.123doks.com/thumbv2/123doknet/2901467.74822/62.892.157.741.129.562/figure-function-mh-ch-material-adapted-langfelder-et.webp)