HAL Id: hal-00277065
https://hal.archives-ouvertes.fr/hal-00277065
Submitted on 5 May 2008
HAL is a multi-disciplinary open access
archive for the deposit and dissemination of
sci-entific research documents, whether they are
pub-lished or not. The documents may come from
teaching and research institutions in France or
abroad, or from public or private research centers.
L’archive ouverte pluridisciplinaire HAL, est
destinée au dépôt et à la diffusion de documents
scientifiques de niveau recherche, publiés ou non,
émanant des établissements d’enseignement et de
recherche français ou étrangers, des laboratoires
publics ou privés.
Optical disk resonator with microwave free spectral
range for optoelectronic oscillator
Hervé Tavernier, Thi Kim Ngan Nguyen, Patrice Féron, Ryad Bendoula,
Patrice Salzenstein, Enrico Rubiola, Laurent Larger
To cite this version:
Hervé Tavernier, Thi Kim Ngan Nguyen, Patrice Féron, Ryad Bendoula, Patrice Salzenstein, et al..
Optical disk resonator with microwave free spectral range for optoelectronic oscillator. European Time
and Frequency Forum, Apr 2008, Toulouse, France. pp.NA. �hal-00277065�
Optical disk resonators with micro-wave free spectral range
for optoelectronic oscillator
Herv´e Tavernier1
, Ngan Nguyen Thi Kim,1,2, Patrice F´eron2
, Ryad Bendoula1
, Patrice Salzenstein1
, Enrico Rubiola1
and Laurent Larger1
1
FEMTO–ST Institute, UMR CNRS 6174 / Optics Department, University of Franche–Comt´e, 16 route de Gray, 25030 Besan¸con Cedex, France
2
ENSSAT-FOTON, UMR CNRS 6082 / Universit´e de Rennes 1, 6 rue Kerampont, 22300 Lannion, France We report on MgF2 optical whispering gallery mode resonators, intended to operate in an
optoe-lectronic microwave oscillator. We describe the definition of the physical and geometrical properties of the disk shape resonator, the fabrication process, and finally the mechanical and optical charac-terization obtained with the first fabricated devices. For the MgF2 disk, an optical quality factor
of Q = 3.2 × 10⁸
was measured at the telecoms wavelength λ = 1.55 µm, and with a coupling performed through a tapered fiber.
PACS numbers:
I. BIOGRAPHY
Herv´e Tavernieris a Ph.D student in Universit´e of Franche-Comt´e since 2005.
Ngan Nguyen Thi Kim has post–doctoral posi-tion at FEMTO–ST institute, Time and Frequency department, Besan¸con France, and was also a post-doc at2
.
Patrice F´eronis associate professor at the ENSSAT Lannion, France, he is affiliated to the FOTON CNRS laboratory.
Patrice Salzensteinis a CNRS research engineer at the FEMTO–ST intitute of the CNRS, in the Time and Frequency department, Besan¸con, France. Ryad Bendoula is a Cemagref researcher at the ENSAM–CIRAD laboratory since 2006, Montpellier, France ; he had before a post–doctoral position in1
. Enrico Rubiola is a professor at the University of Franche–Comt´e, Besan¸con, France ; he is affiliated to the FEMTO–ST intitute of the CNRS, Time and Fre-quency department.
Laurent Larger is a professor at the University of Franche–Comt´e, Besan¸con, France ; he is affiliated to the FEMTO–ST intitute of the CNRS, Optics depart-ment.
II. INTRODUCTION
The generation of microwaves from optics is an emerging field, which find potential applications in ra-dar, space, high speed telecommunications, and other domains of technology. A well known solution in op-toelectronic consists in implementing in the oscillator loop a long fiber optics delay line (a few km) between two optical–to–electrical convertors, i.e. a light mo-dulator, and a photodiode [1]. The long delay τ of a few 10s of µs is allowed due to the very low absorp-tion of modern telecoms grade fiber ; the delay plays the role of the storing energy element in the oscil-lator, which is usually performed by a resonator in classical electronic oscillators. The delay τ has a com-parable role with respect to the resonator relaxation time τ = Q/πν [2]. The optoelectronic delayed feed-back loop can thus oscillate at all frequencies multiple
of 1/τ , one of which being actually roughly selected by an additional element, a low quality factor microwave filter. The spectral purity of the oscillation is thus mainly determined by the very fast frequency varying in–phase condition due to the large delay, and not by any amplitude vs. frequency selective resonator (e.g with a high Q factor).
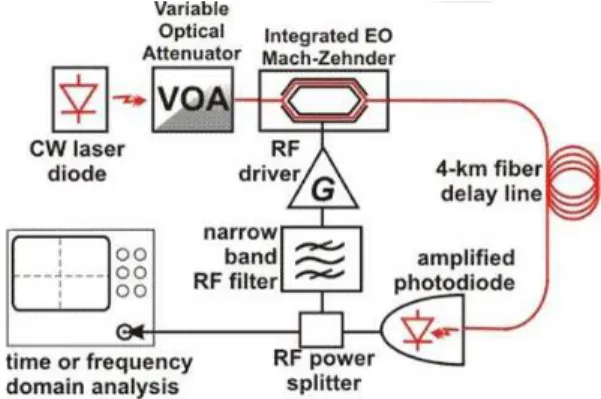
The detailed architecture is an optoelectronic oscil-lator (OEO), which is depicted in Fig. 1. It consists of a laser as the light source, which intense and mono-chromatic radiation propagates through an electro– optic modulator ; the modulator translates the micro-wave input signal onto the optical carrier. The light beam then carrying the microwave is delayed by the optical energy “storage” element, such as an optical fiber. At the end of the delay line, the microwave mo-dulation is back transfered into the electrical domain, typically with a photodiode (Fig. 1). The microwave electric signal is processed by amplifiers and filters centered around the desired oscillation frequency, be-fore serving as the drive signal for the electro–optic modulator, thus closing the oscillator loop. If the total optoelectronic gain exceeds the losses of the loop, the system oscillates at a frequency close to the maximum gain of the filter.
Fig.1: Scheme of a fiber delay line optoelectronic oscilla-tor
The use of an optical storage element allows to achieve very high quality factor and very low phase noise. Indeed the noise performance of an oscillator is determined by the energy storage time, or quality
fac-tor Q. A long fiber delay in an OEO, typically 4 km, gives a 20 µs energy storage time, and typically leads to a phase noise of −150 dBrad2
/Hz at 10 kHz from a 10 GHz carrier. This performance is better 1 to 2 orders of magnitude than conventional electronic os-cillators based on dielectric resonators. The only li-mitation of the frequency oscillation depend on the spectral modulation and selection capability of the optoelectronic loop, since oscillations might arise at all 1/τ within the loop bandwidth. A pretty narrow band RF filter is required to select a single mode oscil-lation, which monomode behavior is usually achieved through a mode competition process (since the filter can not be selective enough to keep only one mode within the gain profile). The center frequency of this filter determines the operating frequency of the OEO. However, from an engineering and practical point of view, the few kilometers of fiber is on one hand very sensitive to the environment (e.g. temperature fluc-tuations), and it occupies a significant volume which is detrimental to any small size integration perspec-tive for the OEO. For those reasons, it was suggested [3, 4] to replace the optical fiber by a whispering gal-leries modes (WMG) optical resonator, thus keeping some advantages of the optical carrier, while compac-ting the delay in a very small volume. Moreover, a high quality factor WGM optical resonator might also prevent from the design of a highly selective RF filter, since the sharp optical resonance might be able to se-lect accurately an oscillation mode. Very high quality factor optical resonators can be found in the litera-ture, with an optical Q as high as 6 × 10¹⁰
in a CaF2 resonator [5] ; this corresponds to an energy time sto-rage τ of 36 µm, thus exceeding a 4 km fiber delay, and also potentially leading to better phase noise for long term frequency.
We report in this paper some first results on WGM optical resonator made with MgF2. We will first
des-cribe in section II the typical geometry of the resona-tor ; we will then report on the fabrication process we developed for the realization of our resonator (mecha-nical processing for shaping, and polishing). Section III will gather the mechanical and optical characteri-zation of the resonator, including coupling issues with a tapered fiber, and optical scanning for static optical frequency characterization and optical quality factor measurement.
III. SHAPING AND POLISHING
A. Optical and mechanical disk properties
Several earlier papers on WGM resonators fabrica-tion reported various materials such as sapphire, fu-sed silica, calcium fluoride, lithium niobate and other optical glasses and crystals. Fused silica microspheres and microdisks present a degradation of their quality factor as soon as they are exposed to the atmospheric water vapor [6]. Sapphire and lithium niobate, and even quartz own a too high index for allowing stan-dard coupling with silica fiber taper. Indeed both ta-per and resonator propagation constants have to be
matched in order to achieve an efficient coupling ; for that particular issue, MgF2 is suited, since it has a
refractive index of 1.38 at 1530 nm. MgF2 provides
also a wide optical transparency range between 0.12 to 8.2 µm. It is a rugged material resistant to chemi-cal etching, mechanichemi-cal, and thermal shocks.
We earlier developed a first process for quartz disks, which Mohs hardness is of 7. The same process has been used for MgF2, due to its similar Mohs hardness
of 6.
Fig.2: MgF2 optical resonator with 5.2 mm diameter on
metal holder
In order to obtain a free spectral range (FSR) of about 10 GHz, we shaped a disk with a diameter around 6 mm. The disk thickness of a few 10s µm is important because the number of excited modes depends on the transverse extension of the coupling zone subjected to the evanescent field. Two solutions are available : one is to shape a very thin disk, which however makes it extremely fragile during mechani-cal processing. However, the small transverse area is practically only required at the disk periphery ; this leads to a second solution, consisting in mechanical machining of the periphery only, keeping an easier to handle and mechanically more stable disk.
B. disk preforming
We use an initial MgF2 optical window of about
6 mm diameter and 0.5 mm thickness (Fig. 2). A hole in the center is performed for an easier positioning , fixing, and gluing of the MgF2piece on a metal holder.
If the disk is not held in the center (i.e. directly glued without any hole) the disassembling risk of the set disk–holder is much higher during the polishing steps. The first shaping stage is to made concentricity of the disk from the polishing machine axis ; to do so, we use several diamond grindstones with decreasing grain size. To avoid a too many coupling modes it’s essential to reduce the coupling zone down to ca. 10 µm. For that we preform two 20 degree angle bevels on the disk to form a sharp edge. The choice of this angle is important because thickness of the edge depends on it, as well as the fragility. This step have to be carefully operated, with appropriate grindstone and disk speeds, to avoid crystal splinters ; any splinter 2
enlarge the edge, and so the future coupling zone as well.
C. polishing stage
Once the disk periphery is processed to exhibit a sharp edge, one needs to polish the local surface of the edge, with a very good optical quality (very low and regular surface roughness all around the disk per-iphery). This second processing step is very important to ensure very low propagation losses due to surface irregularities. This can be commented by the actual optical quality factor of a WGM resonator. The maxi-mum value of the optical Q factor of dielectric WGM resonator is indeed typically given by :
Qmax=
2πn
λα . (1)
Where n is the refractive index of the material, λ is the wavelength of the light in the vacuum, and α is the total optical loss coefficient in nepers per meter, which is a measure of the cumulative attenuation caused by different mechanisms.
α = αss+ αmat+ αcoupling+ αrad. (2)
Where αss is the surface scattering induced by
the imperfections of the surface, αmat is the
mate-rial losses caused by the fundamental absorption in the material, atomic impurities, and three types of bulk scattering : Raman, Brillouin, and Rayleigh [7]. The αcouplingis the light coupling losses which can be
made very small while properly choosing a strongly undercoupled regime. And αradis the radiative losses
only significant in small resonators. In our case, if we consider an ideal crystal and an appropriate coupling regime, both conditions are achievable ; the most im-portant loss source is the surface scattering, which actually depends on the polishing quality [8].
Fig.3: Picture of the polishing station
To achieve a good surface roughness quality we use classical manual polishing techniques, which consist in
using powders of decreasing grain size. Usual powders are silica colo¨ıdal, cerium oxide, alumina oxide, and their dilution and acidity must be controlled. During the polishing stage an excellent concentricity and as low as possible vibrations of the polishing lathe have to be respected. Indeed all vibrations are transfered back on the surface roughness, and a concentricity default leads to supplementary excited modes when coupling light into the disk. In order to guaranty this constraint, we designed and built a machine for sha-ping and polishing small disk resonators (Fig. 3). The machine is an adaptation of an air–spindle bru-shless motor used to test computer hard disks. The interest of an air bearing is to prevent or lower the transmission of the motor vibration, due the air dam-ping. We built a chuck with an adequate concentricity compensation system, in order to properly maintain the disk holder during rotation of the motor. We prac-tically measured with a special comparator a residual 200 nm for the concentricity on the chuck. Notice that in order to keep this feature, it is important not to re-move and replace the disk holder on the chuck during all shaping and polishing stages.
D. Disk roughness measurement
For final roughness measurement and characteriza-tion, we use a white light phase–shifting profilometer. Resolution of this profilometer is 1 nm, but an rms measure (Ra) can give a result under the resolution
limit. The profilometer output supplies interference fringes as contour curves (Fig. 4) ; an adequate se-paration between interference fringes shows a good surface roughness lower than 20 nm.
Fig.4: Contour curves of the surface roughness resonator (fringe periodicity : 120 nm)
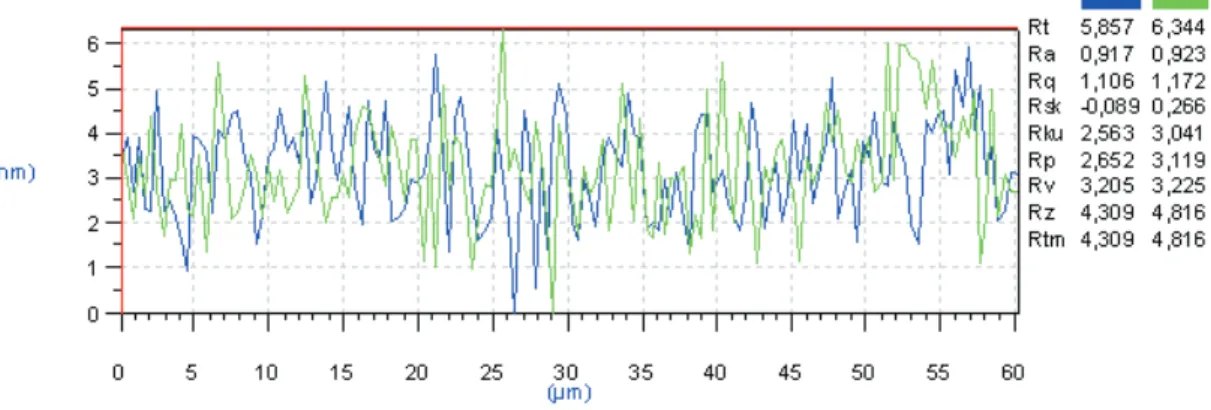
Since the disk size is much bigger than the profilo-meter analysis area, we define a random measurement zone of few micrometers to obtain a surface profile. Fi-gure 5 shows the 3D profile of surface measurement ; we obtain a flat surface with a two order straightening out of the 3D profile, in order to have access to the unfolded roughness.
We report in Fig. 6 a peak to peak roughness curve of 6 nm with Ra = 0.92 nm, which is better than
λ/200. The importance of quality surface roughness is provided by the surface limited Q factor, one ap-proach uses parameters of surface roughness σ and correlation length B ([9]). Qss= KT E,T M KT E,T M+ 1 3λ3 a 8nπ2B2σ2 (3)
Fig.5: 3D profile of measurement zone
Here KT E,T M are scattering suppression
coeffi-cients for TE and TM whispering gallery modes in material. n is the refractive index of material, λ the wavelength of light and a the radius of the cavity.
IV. OPTICAL CHARACTERIZATION OF
THE WGM DISK
We use an optical scanning for static optical fre-quency characterization and optical quality factor measurement. The experimental setup (see Fig. 7) consists in a wavelength tunning light source at 1550 nm (Tunics Plus from Photonetics), a fiber taper with its holder being mounted on a 3–axis nanometer positioning system intende for the resonator coupling adjustment, a DC–coupled amplified photodiode, and fast digital real time oscilloscope (6 GHz 8600A Le-croy WaveMaster). The use of a high speed resolution oscilloscope is necessary to analyse very short pheno-menas, as resonance peaks are expected to occur over very small scanned wavelength ranges.
The maximum wavelength scan range is about 50 pm (ca. 6 GHz), and thus cannot give a full FSR. The nano–positioning system with 20 nm resolution is necessary to adjust the coupling, the appropriate coupling distance being λ/2, so about 700 nm, with a pretty strong position sensitivity. The displacement range of the taper between the extreme positions (no coupling, and disk contact) depends on the waist of the taper. Different other coupling methods do exist, as the bulk prism (evanecent coupling field produced by the internal total reflection), the fiber prism, the fiber half bloc. We choose the tapered fiber because of its excellent coupling efficiency, of about 90%, and their convenient usage through the guided light cha-racter (in a standard fiber) allowing for an easy in-jection and detection of the light at both side of the taper [10]. Our taper has a waist between 1 and 3 µm over a length of about 2 mm (which is important in our case, since we need to approach a mm–size disk). Their optical insertion losses vary between 3 and 5 dB.
V. RESULTS
We report results coupling for a MgF2resonator of
5 mm diameter and 0.7 mm thickness. The laser po-wer was 3 mW with a wavelength scan of 50 pm at 1.55 µm. Figure 8 shows a time trace of the inten-sity output of the taper, while the laser wavelength is slowly scanned in time. A little less than 1.5 period of the triangular wavelength scan is corresponding to the time trace length, showing 3 anti–resonance peaks of the same resonance (they actually correspond to the same resonance wavelength).
The resonance of a single WGM mode is clearly seen in Fig. 8 ; if several WGM modes would have been coupled, as many anti–resonance would have been ob-served, each for a distinct wavelength because the re-sonance are usually non degenerated. This observed single mode anti–resonance does not necessarily mean that the disk is single mode, since it might be forced by the taper waist, which might be small enough to couple only one mode at once for a given well locali-zed coupling position. Another possible reason is the undercoupling condition, which is also not favorable for a multi–mode resonance.
If we look more carefully at one mode (Fig. 9 is a zoom in of Fig. 8), an asymmetric shape of the anti– resonance is clearly seen ; this might be explained by the wavelength sweep, and by asymmetric thermal ef-fects occuring when loading the cavity with optical energy (the thermal effects can shift the resonance wavelength).
A. factor quality measurement
We use a known ”self–homodyne” method to cha-racterize the optical quality factor [11]. The quality factor is extracted from the decay time of the inter-ference paths between two beams. The first beam is provided by the laser and the other by the cavity. Due to the scanning (if it is fast enough), the laser light and the one delayed by the cavity, don’t have the same wavelength, and damped oscillations can be observed during the cavity un–loading, thus resulting in exponentially decaying oscillations. From the decay time, the Q factor can be extracted and the computed according to :
Q = ω.T
2. (4)
This calculated value comprises both the intrin-sic quality factor, as well as the coupling conditions contribution. For different coupling conditions, we ob-tain different calculated quality factors from this ex-perimental measurement ; the more efficient the light is coupled into the resonator, the lower is the quality factor. The calculated quality factor can indeed be decomposed into a coupling quality factor Qe, and an
intrinsic quality factor Q0, according to the following
relation : 4
Fig.6: Roughness curve from two order straightening 3D profile out
Tunics plus 1550 nm
Arbitrary function generator
6 Ghz Lecroy oscilloscope
Photodiode Fiber tapered
MgF2 disk resonator
Fig.7: Scheme of coupling experimental system
−0.02 −0.01 0 0.01 0.02 0.03 0.04 0.1 0.15 0.2 0.25 0.3 0.35 Time (seconde) Voltage (volt)
Fig.8: Mode anti–resonances of an MgF2 optical
resona-tor 1 Q = 1 Q0 + 1 Qe . (5)
To get a global quality factor Q as close as possible from the intrinsic quality factor Q0 (which is related
to the resonator properties only), the taper needs to
0.0356 0.0356 0.0356 0.0356 0.0356 0.0357 0.0357 0.0357 0.05 0.1 0.15 0.2 0.25 Time (seconde) Voltage (volt)
Fig.9: Magnified anti–resonance from Fig. 8
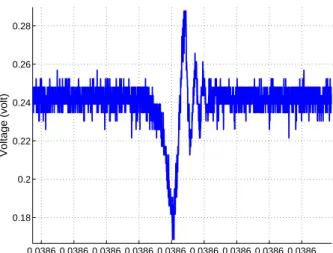
strongly under–couple the light. An example for such an under–coupling condition leads to the record re-ported in Fig.10.
When applying the method decsribed in [11], a qua-lity factor of 3.2 × 10⁸
can be extracted from the fit-ting of the amplitude and temporal properties of each beating.
B. Conclusion
We reported the design, fabrication and measure-ment of mm–size optical disk resonator ; the disk are intended to perform WGM optical resonators with a high Q−factor. Our first Q−factor have been obtai-ned with a tapered fiber coupling, and was measured to be around 3.2 × 10⁸
, thus leading to a resonator delay of about 0.2 µs. This result does not yet allow to replace with the small resonator the usual fiber de-lay line OEO (typically involving 4 km of optical fiber corresponding to a 20 µs delay). Work is in progress to improve the resonator fabrication. More precisely,
0.0386 0.0386 0.0386 0.0386 0.0386 0.0386 0.0386 0.0386 0.0386 0.18 0.2 0.22 0.24 0.26 0.28 Time (seconde) Voltage (volt)
Fig.10: Resonance with rapidly wavelength sweep
the polishing stage could be improved in the near fu-ture to reach a surface roughness better than 1 nm. Another point under investigation concerns the global analysis of the disk roughness ; the current analysis concerns a few µm2
only ; a regular and good quality is however practically required all along the disk per-iphery. Solutions are being investigated to allow for a full periphery roughness analysis.
Acknowledgments
This work is supported by the French ANR research program, and also by the French Space Agency CNES. We want to thank also J.–P. Sabatier for his help-ful contribution in the mechanical engineering design and fabrication of the polishing station, and M. Jac-quot and P. Sandoz for the white light interferometry roughness measurement.
[1] X. S. Yao, and Lute Maleki JOSA-B 13(8), 1725-1735 (1996).
[2] E. Rubiola Cambridge, (2008) in press.
[3] Vladimir S. Ilchenko, X. S. Yao, and Lute Maleki Proc. SPIE 3611, 190-198 (1999).
[4] Vladimir S. Ilchenko, M. Gorodestky, X. S. Yao and Lute Maleki Opt. Lett 26, 256 (2001).
[5] Ivan S. Grudinin,Vladimir S. Ilchenko, and Lute Ma-leki Phys. Rev. A 74, 063806(9) (2006).
[6] D. W. Vernooy,Vladimir S. Ilchenko, A. B. Matsko, H. Mabuchi, and al. Opt. Lett. 23, 247 (1998).
[7] Ivan S. Grudinin,Andrey B. Matsko, and Lute Maleki Opt. Exp. 15, 3390-3395 (2007).
[8] Brent E. Little, Sai T. Chu, and Juha-Pekka Laine Opt. Lett. 22, (1997).
[9] M. Gorodetsky,A. Pryamikov, and V. Ilchenko J. Opt. Soc. Am. B 17, 1051 (2000).
[10] J. C. Knight, G. Cheung, F. Jacques, and T. A. Birks Opt. Lett. 22, 1129-1131 (1997).
[11] J. Poirson, and al. JOSA-B 14, 2811-2817 (1997).