Characterization of Ribonucleoside Diphosphate Reductase from Thermoplasma acidophila
by Jie Julie Wu
B.S., Chemistry, Stanford University (1995)
Submitted to the Department of Chemistry
in Partial Fulfillment of the Requirements for the Degree of Master of Science in Biological Chemistry
at the
Massachusetts Institute of Technology September 1997
@1997 Massachusetts Institute of Technology All Rights Reserved
Signature of Author Department of Chemistry July 3, 1997 Certified by_ JoAnne Stubbe Thesis Advisor Accepted by Dietmar Seyferth Chairman, Department Committee on Graduate Students
SEP
1
7W197
To my parents, Kui-hua Wu & Yi-yuan Ji, for their love and inspiration
Characterization of Ribonucleoside Diphosphate Reductase from Thermoplasma acidophila
by Jie Julie Wu
Submitted to the Department of Chemistry on July 3, 1997 in Partial Fulfillment of the Requirements for the Degree of
Master of Science ABSTRACT
Ribonucleotide reductases (RNRs) catalyze the rate limiting step in DNA
biosynthesis, the conversion of ribonucleotides to 2'-deoxyribonucleotides. Four classes of RNRs are currently known. Although each class differs in cofactor requirement, the allosteric regulation pattern and catalytic mechanism are conserved for all classes of RNRs. The ribonucleotide reductase from the archaebacterium Thermoplasma acidophila (T. acidophila RDPR) was first purified and its gene was cloned into E. coli and
sequenced in Benner's laboratory. Similar to the reductase from Lactobacillus leichmannii, it requires adenosylcobalamin for enzyme activity. The sequence of T. acidophila RDPR also provides a sequence link for all classes of RNRs. In this work, the purification method of T. acidophila RDPR was improved and additional activity assay procedures were developed. Several kinetic parameters of T. acidophila RDPR were determined.
Initial studies on the regulation pattern of T. acidophila RDPR reveals that Km values for substrates are substantially lower than other RNRs and that at low concentrations of effectors, regulatory patterns are similar. However, the regulation requires additional characterization. Stop flow UV-Visible studies showed that cob(II)alamin is formed in a kinetically competent fashion during catalysis. Rapid freeze quench EPR spectroscopy showed that cob(II)alamin exchanged coupled to a second radical species is formed as an intermediate. Inactivation studies showed that T. acidophila RDPR is inactivated by mechanism based inhibitors that have been extensively characterized with other RNRs. All the results suggest that T. acidophila RDPR is using a similar catalytic mechanism as the Lactobacillus enzyme.
Thesis Supervisor: Professor JoAnne Stubbe
ACKNOWLEDGMENTS
First of all, I would like to thank my thesis advisor Professor JoAnne Stubbe for her support during my graduate school period and her guidance and patience during the preparation of this manuscript. I will always remember her genuine enthusiasm and dedication to science.
Next, I owe many thanks to all the past and present members in the Stubbe lab for providing such a friendly and supportive work environment. I am especially grateful to Stuart Licht, Dr. Wilfred von der Donk, and Dr. Christopher Lawrence for teaching me
many techniques and helping me with the experiments. Their encouragement and input on my project were invaluable. I would like to thank Jennie, Wei, and Alex for those late night Chinatown runs; Kirsten for her jelly beans; Doug for his crazy bench music; and Pam for her birthday brownies. I would also like to thank the rest of the group, Silvia, Rick, Ute, Annette, and Joe, for many fond memories.
I also owe many gratitude to my friends outside the lab, Jianhua, Qing, Yansong, Chao, Xiaojun, for their encouragement and for many of the great moments we shared together. I wish them well with their careers.
Finally, I would like to thank my parents for making me who I am and for
introducing me to chemistry. Their unconditional love will always be a constant in my life.
TABLE OF CONTENTS
PAGE
A b stract ... 3
A cknow ledgm ents ... 4
T able of C ontents... 5 F igu res ... 10 Sch em es ... 13 T ab les ... 14 A bb reviation s... 15 CHAPTER 1 Expression, Assay, and Purification of Recombinant T. acidophila RDPR... 17
In tro d u ction ... 18
Classes of Ribonucleotide Reductases ... 18
Ribonucleotide Reductase from Thermoplasma acidophila ... ... 19
Materials and Methods ... 20
M aterials ... 20
Extraction and Restriction Mapping of Plasmid RNR/pET23b(+) ... 22
Quantitation and Gel Electrophoresis of Protein ... 22
Transformation of RNR/pET23b(+) into BL21(DE3) and JM109 ... 22
Small Scale Induction to Analyze for Maximal Expression of T. acidophila R D PR ... 23
Tritium Exchange Assay on Crude Cell Lysate ... ... 23
Activity Assays for T. acidophila RDPR ... 24
[8, 5'-3H ] -G D P A ssay ... 25
[5-3H ]-CDP A ssay ... 26
[2-14C]-CDP Assay ... 26
HPLC Analysis of [2-14C]-CDP Assay Products ... ... 27
HPLC Analysis of [2-14C]-CDP ... 27
Large Scale Growth of T. acidophila RDPR Overproducing Strain RN R/pET23b(+)/BL21(DE3) ... 28
Purification of T. acidophila RDPR... 28
Protein Analysis During Purification... 30
Determination of Extinction Coefficient ... 31
R esults and D iscussion ... 31
Extraction and Restriction Mapping of Plasmid RNR/pET23b(+) ... 31
Small Scale Induction Check on T. acidophila RDPR Expression... 32
Tritium Exchange Assay on Crude Cell Lysate ... 33
Activity Assays for T. acidophila RDPR ... 34
Large Scale Growth of T. acidophila RDPR Overproducing Strain RN R/pET23b(+)/BL21(DE3) ... ... 36
Purification of T. acidophila RDPR ... 36
Determination of Extinction Coefficient ... ... 37
R eferen ces ... 3 8 S ch em es ... 39
T ab les ... 4 2 F ig u res ... 4 4 CHAPTER 2 Allosteric Regulation and Kinetic Studies of T. acidophila RDPR ... 62
In trod u ction ... ... 63
Allosteric Regulation of Ribonucleotide Reductases ... 63
RDPR From Aerobically Grown Escherichia coli (Class Ia) ... 63
RTPR From Anaerobically Grown Escherichia coli (class III) ... 64
Nrd-EF RDPR From Salmonella typhimurium (Class Ib) ... 65
RTPR From Lactobacillus leichmannii (Class II) ... ... 66
Su m m ary ... 67
M aterials and M ethods ... 68
M aterials ... 68
D ata A nalysis ... 68
T. acidophila RDPR Used in Regulation and Kinetic Studies ... 69
(d)NTPs Used in Regulation Studies ... ... 70
AdoCbl Km Determination with CDP as Substrate ... 70
DTT Km Determination with CDP as Substrate ... 71
Allosteric Effects of (d)NTPs on ADP Reduction ... 71
Substrate ADP Km Determination ... ... 72
Allosteric Effects of (d)NTPs on GDP Reduction ... 72
Substrate GDP Km Determination ... 72
Allosteric Effects of (d)NTPs on CDP Reduction ... ... 73
Allosteric Effects of dNDPs on ADP Reduction ... 73
R esults and D iscussion ... ... 74
AdoCbl Km Determination with CDP as Substrate ... ... 74
DTT Km Determination with CDP as Substrate ... 74
Allosteric Effects of (d)NTPs on ADP Reduction ... 75
Substrate ADP Km Determination ... ... 77
Allosteric Effects of (d)NTPs on GDP Reduction ... 78
Substrate GDP Km Determination ... 79
Allosteric Effects of (d)NTPs on CDP Reduction ... 80
Allosteric Effects of dNDPs on ADP Reduction ... 81
Summary ... 82 R eferen ces ... 84 Sch em es ... 86 T ab les ... 92 F ig u res ... 104 CHAPTER 3 Mechanistic Characterization of T. acidophila RDPR In trod u ction ... 132
Role of AdoCbl in Class II RNRs ... 132
Inactivation of RNRs with Mechanism-based Inhibitors ... 133
Materials and Methods ... 135
M aterials ... 135
Stop-flow Experiment of T. acidophila RDPR... 136
Rapid Freeze Quench EPR Experiment of T. acidophila RDPR ... 137
Time-dependent Inactivation of T. acidophila RDPR ... 139
R esults and D iscussion ... 140
Stop-flow Experiment of T. acidophila RDPR ... 140
Rapid Freeze Quench EPR Experiment of T. acidophila RDPR ... 144
RFQ-EPR Experiment with [5'-lH]-AdoCbl ... 144
RFQ-EPR Experiment with [5'-2H]-AdoCbl... ... 145
The Mystery Peak Observed... 147
Time-dependent Inactivation of T. acidophila RDPR ... 148
Experimental Concerns for the Time-dependent Inactivation Studies... 148
Background Deactivation Observed for T. acidophila RDPR... 151
dF2CDP is a Potent Inhibitor of T. acidophila RDPR ... 151
N3UDP and 2'VUDP as Inhibitors for T. acidophila RDPR ... 152
Su m m ary ... 154
R eferences ... 155
Sch em es ... 157
F ig u res ... 159
APPENDIX Appendix I: DNA and protein sequence of T. acidophila RDPR ... 175
Appendix II: Restriction map of T. acidophila RDPR DNA sequence ... 178
Figure 1.1 Figure 1.2 Figure 1.3 Figure 1.4 Figure 1.5 Figure 1.6 Figure 1.7 Figure 1.8 Figure 1.9 Figure 1.10 Figure 1.11 Figure 1.12 Figure 1.13 Figure 1.14 Figure 1.15 Figure 1.16 Figure 1.17 Figure 1.18 Figure 2.1a Figure 2.1b Figure 2.2 Figure 2.3a Figure 2.3b Figure 2.4a FIGURES Plasmid map of RNR/pET23b(+). Plasmid map of pLysS.
Restriction digest pattern with HindIII.
Restriction digest pattern with BamHI, and NotI+NdeI. Sample growth curve of RNR/pET23b(+)/BL21(DE3). Sample induction gel of RNR/pET23b(+)/BL21(DE3).
Sample TLC plate of deoxynucleosides and nucleosides separation.
Sample [5, 8-3H]-ADP assay.
Sample [8, 5'- 3H] -GDP assay. Sample [5- 3H]-CDP assay. Sample [2-14C]-CDP assay.
HPLC analysis of [2-14C]-CDP assay product. HPLC analysis of [2-14C]-CDP.
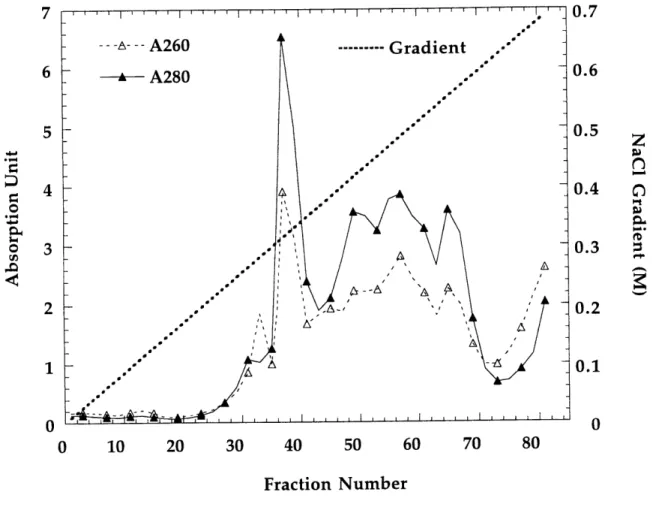
Q-Sepharose column elution profile: A260, A280 readings vs. fractii number.
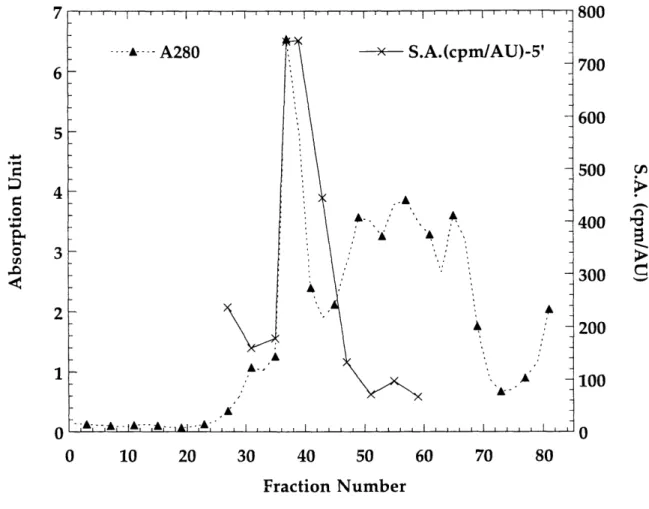
Q-Sepharose column elution profile: A280 reading and specific acti (cpm/AU) vs. fraction number.
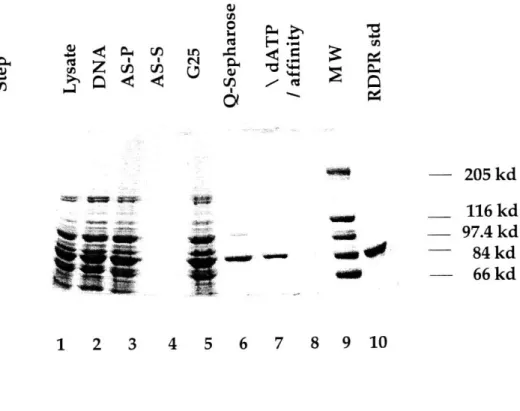
Sample SDS-PAGE gel of dATP affinity column fractions. Sample SDS-PAGE gel for T. acidophila RDPR purification. Sample UV spectrum for T. acidophila RDPR.
AdoCbl Km determination.
AdoCbl Km determination by Benner. DTT Km determination.
UV spectrum of T. acidophila RDPR, batch IIa. UV spectrum of T. acidophila RDPR, batch IIb.
Allosteric effect of (d)NTPs on ADP (10 gM) reduction, Run 1.
vity on
Figure Figure Figure Figure Figure Figure Figure Figure Figure Figure Figure 2.4b 2.5a 2.5b 2.5c 2.6a 2.6b 2.6c 2.7a 2.7b 2.8 2.9 Figure 2.10a Figure 2.10b Figure 2.11 Figure 2.12 Figure 2.13 Figure 2.14 Figure 2.15 Figure 3.1a Figure 3.1b Figure 3.2a Figure 3.2b Figure 3.3
Allosteric effect of (d)NTPs on ADP (10 RM) reduction, Run 2. Allosteric effect of (d)NTPs on ADP (1 mM) reduction, Run 1. Allosteric effect of (d)NTPs on ADP (1 mM) reduction, Run 2. Allosteric effect of (d)NTPs on ADP (1 mM) reduction, Run 3. ADP Km determination: no effector vs. 1 mM dGTP.
ADP Km determination: no effector case.
ADP Km determination by Benner's laboratory.
Allosteric effect of (d)NTPs on GDP (10 jiM) reduction, Run 1. Allosteric effect of (d)NTPs on GDP (10 [tM) reduction, Run 2. Allosteric effect of (d)NTPs on GDP (1 mM) reduction, Run 1. Allosteric effect of (d)NTPs on GDP (10 giM) reduction, with TR/TRR/NADPH.
GDP Km determination (5-40 [iM): no effector vs. 1 mM dTTP. GDP Km determination (100-600 gM): no effector vs. 1 mM dATP. Allosteric effect of (d)NTPs on CDP (10 gM) reduction.
Allosteric effect of (d)NTPs on CDP (1 mM) reduction. Allosteric effect of (d)NTPs on CDP (1 mM) reduction, with TR/TRR/NADPH.
Allosteric effect of (d)NDPs on ADP (10 gM) reduction. Allosteric effect of (d)NDPs on ADP (200 jiM) reduction.
Cob(II)alamin formation (0 -1.2 s): absorbance change at 525nm. Cob(II)alamin formation: absorbance change at 525nm.
Cob(II)alamin formation (0 -1.2 s): absorbance change at 477nm. Cob(II)alamin formation: absorbance change at 477nm.
RFQ-EPR spectra of T. acidophila RDPR at 10 ms (9 scans) and 38 ms (6 scans) with [5'-1HJ-AdoCbl.
Figure 3.4 Figure 3.5 Figure 3.6a Figure 3.6b Figure Figure 3.7 3.8 Figure 3.9 Figure Figure 3.10 3.11 Figure 3.12 Figure 3.13
RFQ-EPR spectra of T. acidophila RDPR at 10 ms (9 scans) with that of L. leichmannii RTPR at 175 ms (10 scans) with [5'-1H]-AdoCbl.
RFQ-EPR spectra of T. acidophila RDPR at 10 ms (9 scans) and 38 ms (7 scans) with [5'-2H]-AdoCbl.
RFQ-EPR spectra of T. acidophila RDPR at 10 ms with [5'-lH]-AdoCbl (9 scans) and [5'-2H]-AdoCbl (9 scans).
RFQ-EPR spectra of T. acidophila RDPR at 38 ms with [5'-1H]-AdoCbl (6 scans) and [5'-2H]-AdoCbl (7 scans).
The mystery peak observed due to incomplete mixing at 10 ms (13 scans). The mystery peak observed (13 scans) with normal peak at 10 ms with
[5'-2H]-AdoCbl (9 scans).
Enzyme stability in the presence of dGTP, with or without AdoCbl at 550C.
Enzyme stability at OoC and 550C in the absence of AdoCbl and dGTP. Time-dependent inactivation of T. acidophila RDPR by 2'-deoxy-2',2'-difluorocytidine 5'-diphosphate (dF2CDP).
Time-dependent inactivation of T. acidophila RDPR by 2'-azido-2'-deoxyuridine 5'-diphosphate (N3UDP).
Time-dependent inactivation of T. acidophila RDPR by 2'-deoxy-2'-methyleneuridine 5'-diphosphate (2'VUDP).
SCHEMES
Scheme 1.1 Ribonucleotide reductase catalyzes a key step in DNA biosynthesis. Scheme 1.2 RNRs use a wide range of cofactors.
Scheme 1.3 Proposed mechanism for nucleotide reduction RNRs.
Scheme 2.1 Substrate specificity of ribonucleotide reductase is subject to allosteric control.
Scheme 2.2 Schematic representation of RDPR from E. coli (Class Ia).
Scheme 2.3 Schematic representation of RTPR from anaerobically grown E. coli (Class III).
Scheme 2.4 Schematic representation of NrdEF RDPR from S. typhimurium (Class Ib). Scheme 2.5 Schematic representation of RTPR from L. leichmannii.(Class II).
Scheme 2.6 Models for the allosteric regulation of all three classes of RNRs. Scheme 3.1 Possible roles of AdoCbl in thiyl radical generation in class II RNRs. Scheme 3.2 Mechanism of inhibition of 1. leichmanniiRTPR by a nucleotide analog.
TABLES
Table 1.1 Expected digest pattern of plasmid RNR/pET23b(+) and pLysS. Table 1.2 Tritium exchange assay results.
Table 1.3 Rf values of deoxynucleosides and nucleosides. Table 1.4 Sample purification table for T. acidophila RDPR. Table 2.1a Allosteric regulation of E. coli RDPR (Class Ia). Table 2.1b Allosteric regulation of E. coli RDPR (Class Ia).
Table 2.2 Allosteric regulation of anaerobic E. coli RTPR (Class III).
Table 2.3 Allosteric regulation of NrdEF RDPR from S. typhimurium (Class Ib). Table 2.4 Allosteric regulation of L. leichmannii RTPR (Class II).
Table 2.5a Summarized data for allesteric regulation of ADP reduction by specific activity (U/mg).
Table 2.5b Summarized data for allesteric regulation of ADP reduction by percentage of activity.
Table 2.6a Apparent Km values for effectors of the anaerobic E. coliRTPR. Table 2.6b Km values for substrates of the anaerobic E. coliRTPR.
Table 2.7a Summarized data for allesteric regulation of GDP reduction by specific activity (U/mg).
Table 2.7b Summarized data for allesteric regulation of GDP reduction by percentage of activity.
Table 2.8a Summarized data for allesteric regulation of CDP reduction by specific activity (U/mg).
Table 2.8b Summarized data for allesteric regulation of CDP reduction by percentage of activity.
Table 2.9a Summarized data for allosteric effects of dNDPs on ADP reduction by specific activity (U/mg).
Table 2.9b Summarized data for allosteric effects of dNDPs on ADP reduction by percentage of activity.
ABBREVIATIONS A adenosine AdoCbl 5'-deoxyadenosylcobalamin ADP adenosine-5'-diphosphate ATP adenosine-5'-triphosphate AU Absorbance unit
BSA bovine serum albumin
C deoxycytidine
cat. catlog number
CDP cytidine-5'-diphosphate
Ci curie
CIP calf intestine alkaline phosphatase
dA 2'-deoxyadenosine dADP 2'-deoxyadenosine-5'-diphosphate dATP 2'-deoxyadenosine-5'-triphosphate dC 2'-deoxycytidine dCTP 2'-deoxycytidine-5'-triphosphate dF2CDP 2'-deoxy-2',2'-difluorocytidine 5'-diphosphate dG 2'-deoxyguanosine dGDP 2'-deoxyguanosine-5'-diphosphate dGTP 2'-deoxyguanosine-5'-triphosphate dTDP 2'-deoxythymidine-5'-diphosphate DTT dithiothreitol dTTP 2'-deoxythymidine-5'-triphosphate E. coli Escherichia coli
EDTA ethylenediaminetetraacetic acid EPR electron paramagnetic resonance
G GDP HEPES HPLC IPTG kb kDa L. Leichmannii LB MW N3UDP NADPH PAGE PMSF PMSF RDPR RFQ RNR RTPR S. A. SDS T. acidophila TLC TR Tris TRR 2'VUDP guanosine guanosine-5'-diphosphate N-(2-hydroxyethyl)piperazine-l-ethanesulphonic acid high pressure liquid chromatography
isopropyl P3-D-thiogalactoside kilo base pairs
kilo daltons
Lactobacillus leichmannii Luria-Bertani broth molecular weight
2'-azido-2'-deoxyuridine 5'-diphosphate
b-Nicotinamide adenine dinucleotide phosphate, reduced form polyacrylamide gel electrophoresis
phenylmethanesulfonyl fluoride phenylmethylsulphonylfluoride
ribonucleoside diphosphate reductase from E. coli rapid freeze quench
ribonucleotide reductase
ribonucleoside triphosphate reductase from L. leichmannii specific activity
sodium dodecylsulfate Thermoplasma acidophila
thin layer chromatography thioredoxin
tris(hydroxymethyl)aminomethane thioredoxin reductase
Chapter 1
Introduction
Ribonucleotide reductases (RNRs) play a central role in DNA biosynthesis,
catalyzing the conversion of nucleotides to 2'-deoxynucleotides (Scheme 1.1).13 Based on their substrate preferences, ribonucleoside diphosphates or ribonucleoside
triphosphates, they are named as RDPR or RTPR respectively. The classification of ribonucleotide reductases are introduced and background information about previous studies of T. acidophila RDPR is also presented.
Classes of Ribonucleotide Reductases
At present there are four classes of ribonucleotide reductases, three of which have been and continue to be under intense investigation.4 All the RNRs are believed to follow a radical based catalytic mechanism.5
There are four basic classes of RNRs based on their cofactor requirements to generate the thiyl radical essential for catalysis (Scheme 1.2). Class I enzymes,
represented by RNRs from E. coli (RDPR), contain an unusual diferric cluster-tyrosyl radical cofactor. Class II enzymes, represented by RNR from Lactobacillus leichmannii (RTPR), require 5'-deoxyadenosylcobalamin (AdoCbl) as a cofactor. Class III enzymes,
represented by RNR from anaerobically grown E. coli (anaerobic RTPR), contain an iron-sulfur cluster and bind S-adenosylmethionine (AdoMet) to generate a glycyl radical. Class IV enzymes, not very well characterized, represented by RNR from Brevibacterium ammoniagenes, require a dinuclear manganese center and tyrosyl radical for catalysis.6,7
The most recent proposal by Stubbe and coworkers for a generic nucleotide reduction mechanism is shown in Scheme 1.3.5 The key steps involve a cofactor-mediated formation of a transient thiyl radical which initiates the nucleotide reduction process by abstracting the 3'-hydrogen atom.8 After loss of H20, the two cysteines on
3'-ketodeoxynucleotide and a disulfide radical anion. This intermediate is subsequently reduced to give deoxynucleotides and a disulfide, regenerating the thiyl radical.
Ribonucleotide Reductase from Thermoplasma acidophila
The ribonucleotide reductase from the archaebacterium Thermoplasma acidophila was first purified and its gene was cloned and sequenced in Benner's laboratory.9'10 It was then expressed in E. coli and shown to be a ribonucleside diphosphate reductase (T. acidophila RDPR) and to require 5'-deoxyadenosylcobalamin (AdoCbl) as a cofactor for catalysis. The complete gene sequence of T. acidophila RDPR is shown in Appendix I. Benner's interest in evolution was the driving source for cloning and sequencing of this reductase and he has carried out extensive sequence comparison with other RNR. These studies revealed that the N-terminal segment (residues 1-150) of T. acidophila
RDPR is homologous to the glycyl radical dependent anaerobic RNR (Class III) from E. coli ; a second segment (residues 250-680) homologous to the catalytic domain of the iron-dependent aerobic RNR (Class I) R1 subunit from E. coli, yeast, and mammals and includes the redox active cysteines (Cys-250 and Cys-445) and the putative thiyl radical (Cys-434). Sequence searches also have established homology between the catalytical domain of dependent RNR (class II) from L. leichmannii with another AdoCbl-dependent RNR from Mycobacterium tuberculosis which aligns well with the T. acidophila
RNR sequence (residues 250-680). Therefore, while no similarity exists to adequately establish homology between the AdoCbl-dependent L. leichmannii RNR sequence and the iron-dependent aerobic E. coli RNR sequence, the statistically significant connections of the L. leichmannii RNR sequence via the M. tuberculosis RNR sequence to the T.
acidophila RNR sequence then to aerobic E. coli RNR sequence permits a bridge to be made between the catalytic domain of the AdoCbl-dependent L. leichmannii RNR and the catalytic domain of the iron-dependent E. coli RNR.10
It is proposed by Reichard4 that all three classes of RNRs evolved from a common ancestor -i.e., divergent evolution based on the facts that the allosteric regulation patterns and the basic catalytic mechanisms of all the RNRs are conserved although the three classes of RNRs possess different substrate specificity and use different cofactors for radical generation. The discovery of the T. acidophila RNR sequence, together with the recently discovery of another AdoCbl-dependent RNR from archaeon Pyrococcs furiosus11, which bears sequence homology to class I and class II RNRs, further provides
convincing sequence evidences between the different classes of RNRs and strongly supports Reichard's proposal that all thress classes of RNRs evolved from a common ancestor.10,11 From both an evolutionary point of view, the study of the allosteric
regulation pattern and mechanism of T. acidophila RDPR becomes especially interesting. Building on previous work carried out in Benner's laboratory, T. acidophila RDPR has been expressed and purified in the Stubbe laboratory. Various activity assays have been developed for further allosteric regulation and mechanistic studies.
Materials and Methods
Materials
The clone pET23b/#8/0081293 in E. coli strain BL21(DE3)pLysS for the
overexpression of the Thermoplasma acidophila RDPR was obtained from Steven Benner's laboratory at the University of Florida.9' 10 The JM109 and BL21(DE3) competent cells were obtained from Novagen.
E. coli thioredoxin (TR) and thioredoxin reductase (TRR) were isolated from overproducing strains SK3918 (S.A. = 500 AU DTNB reduced-mg-l1min-1)12and K91/pMR14 (S.A. = 50 AU DTNB reduced-mg-l1 min-1).13 Restriction endonucleases (NotI, NdeI, HindIII, and BamHI) were from New England Biolabs. Calf intestine
alkaline phosphatase (CIP) and DNAse were from Boehringer Mannheim. QIAGEN-tip 100 Kit for plasmid extraction was from QIAGEN.
Cytidine diphosphate (CDP), adenosine diphosphate (ADP), guanosine 5'-diphosphate (GDP), 2'-deoxycytidine (dC), cytidine (C), 2'-deoxyadenosine (dA), adenosine (A), 2'-deoxyguanosine (dG), guanosine (G),
2'-deoxyguanosine-5'-triphosphate (dGTP), 5'-deoxyadenosylcobalamin (AdoCbl), nicotinamide adenine dinucleotide phosphate, reduced form (NADPH), streptomycin sulfate,
phenylmethanesulfonyl fluoride (PMSF), adenosine 5'-triphosphate (ATP), potassium tetraborate, high range protein molecular weight standards (cat. M-3788, SDS-6H), bovine serum albumin (BSA), ampicillin, chloramphenicol, Q-Sepharose Fast Flow (cat. Q-1126) chromatography resin, and Sephadex G-25 Medium Fractionation Range (cat. G-25-150) chromatography resin were from Sigma. [5,8-3H]-ADP (28.5 Ci/mmol), [8, 5'-3H]-GDP (39.5 Ci/mmol), and [2-14C]-CDP (59.1 mCi/mmol) were from NEN. [5-3 H]-CDP (22 Ci/mmol) was from Amersham Life Sciences. Powdered Trypton, Yeast Extract, and Agar were from Difco. Tris and IPTG were from Boehringer Mannheim. HEPES was from USB. EDTA, MgC12, MgSO4, dithiothreitol (DTT), ammonium sulfate
(AS), and hydroxyurea were from Mallinckrodt. Sep-pak C18 cartridge, Centricons (Centriprep-30), and membranes (YM30) for Amicon ultrafiltration devices were provided by Millipore. AG 1-X2 Resin (50-100 mesh, chloride form) and
13-mercaptoethanol were from Bio-Rad. BakerFlex II-F silica gel TLC plates (20 x 20 cm) were provided by VWR Scientific. [5'-3H] AdoCbl (8.1 x 10⁶ cpm/gmol) was kindly provided by Stuart Licht. dATP-Sepharose affinity resin was synthesized by extensive modifications of the procedure of Berglund & Eckstein14, as described by Knorre et al..15
UV-visible absorption spectra were recorded on a Hewlett-Packard 8452A diode-array spectrophotometer. All scintillation counting was performed on a Beckman LS 6500 multi-purpose scintillation counter using 9 mL Poly-Fluro scintillation fluid from PACKARD per 1 mL of aqueous solution. High Pressure Liquid Chromatography
(HPLC) was carried out using a Beckman 110 Solvent Delivery Module, 421A
Controller, and a 163 Variable Wavelength Detector, in combination with an Alltech Econosil C18 column.
Extraction and Restriction Mapping of Plasmid RNR/pET23b(+)
The initial glycerol stock of the clone pET23b/#8/0081293 in BL21(DE3)pLysS was streaked onto a fresh LB agar plate containing 100 jtg/mL ampicillin and 30 gg/mL chloramphenicol, and incubated at 370C overnight. A single colony was picked to
inoculate a 10 mL LB culture containing 100 gg/mL ampicillin and 30 gg/mL chloramphenicol. After 12 h growth at 370C, the cells were spun down in a 50 mL centrifuge tube at 6,000g for 15 min. The plasmid RNR/pET23b(+) was extracted using the QIAGEN-tip 100 Kit following the manufacturer's protocol.
Approximately 1 gg of extracted plasmid DNA was digested with restriction endonucleases HindIII, BamHI, and NotI+NdeI respectively in the manufacture-recommended NEB (New England Biolabs) buffers.
Quantitation and Gel Electrophoresis of Protein
The method of Lowry was used to determine the protein concentration.16 BSA was used as the protein standard. The SDS-PAGE method was used to analyze proteins based on their sizes.17 For the analysis of T. acidophila RDPR (calculated MW = 96.9 kDa), 7.5% polyacrylamide gels were used. Two high range MW markers from Sigma were used. The first one (cat. SDS-6H) contained bands of 29, 45, 66, 97.4, 116, and 205 kDa; the second one (cat. M-3788) contained bands of 36, 45, 55, 66, 84, 97, 116, and 205 kDa respectively.
The plasmid RNR/pET23b(+) was transformed into BL21(DE3) and JM109 strains respectively following Novagen's transformation protocol. LB agar plates containing
100 gg/mL ampicillin were used for colony selection.
Small Scale Induction to Analyze for Maximal Expression of T. acidophila RDPR The experiment was done on both the original clone pET23b/#8/0081293 in
BL21(DE3)pLysS and the new transformants in BL21(DE3). A single colony was used to inoculate a 10 mL LB culture containing the appropriate antibiotics (100 Rg/mL
ampicillin and 34 gg/mL chloramphenicol for the BL21(DE3)pLysS host strain; 100 Rtg/mL ampicillin for the BL21(DE3) host strain) and grown at 370C. After the cell culture A600 reached between 0.6-1.0, IPTG was added to 0.6-1 mM final concentration.
At each time point (0, 1, 2, 3, and 4 h), 1 mL cell culture was taken and spun down in a 1.5-mL Eppendorf tube in a microcentrifuge for 1 min after recording A600. The
supernatant was discarded and the Eppendorf tube was briefly spun for another 5 secs. Any remaining LB medium was removed with a pipet tip. The cell pellet was then resuspended in 2X SDS-PAGE gel loading buffer, typically 30-50 gL, to a final A600 of
30. The Eppendorf tube was then placed in a 1000C sand bath for 3 min and spun in a microcentrifuge for 1 min to pellet the cell debris. A 10-gL aliquot of the supernatant (-20 jgg total protein) was loaded onto a 7.5% SDS-PAGE gel.
Tritium Exchange Assay on Crude Cell Lysate
RNR/pET23b(+)/BL21(DE3) cells (2.66 g) and RNR/pET23b(+)/JM109 cells (3.88 g), both obtained from a 500-mL culture started with a single colony, induced with 1 mM IPTG at A6 00 = 0.5, were resuspended in 12 mL of 0.1 M Tris-HC1, pH 8.0 at 40C
respectively. The cell suspension was passed through a small French Press cell at 16,000 psi. The lysate was centrifuged at 6,000 g for 15 min to remove the cell debris.
The tritium exchange assay procedure was a simplification of the standard
procedure previously described.18 All procedures were carried out in the dark under dim red lights. An assay mixture of 50 gL contained: 50 gM ADP, 1 mM dGTP, 10 mM MgSO4, 10 mM DTT, 100 mM Tris-HCI pH 8.0, 90 jiM [5'-3H] AdoCbl (S.A.=8.1 x 10⁶ cpm/jimol), and lysate (0-17 jtL, 0-1000 jtg protein). The mixture except lysate was pre-incubated at 550C for 5 min. Lysate (or buffer, in the control case) was added to start the exchange reaction. The reaction was stopped after 30 min by loading the mixture onto a Sep-pak C18 cartridge which had been previously washed with 10 mL of MeOH followed by 10 mL of H20. The cartridge was washed with 3 mL of H20, and a 1-mL
aliquot was removed for scintillation counting.
Activity Assays for T. acidophila RDPR
All the activity assays for T. acidophila RDPR were performed at 550C in the dark under dim red lights.
[5, 8 -3H]-ADP Assay
This assay procedure was a modification of the previously described ADP assay procedure.10 The concentrated [5, 8-3H]-ADP stock (Lot number: 3238-149, 28.5 Ci/mmol, 99.5% as of 5/20/96) was lyophilized to remove ethanol and diluted with unlabelled ADP to desired specific activity. A typical final assay mixture contained in a volume of 260 jiL: 10 RM ADP (S.A. = - 2 x 10⁵ cpm/nmol), 1 mM dGTP, 1 mM MgC12, 10 mM DTT, 100 jiM AdoCbl, 25 mM HEPES pH 7.5, and 0.1-0.2 gM (0.5-1 ktg/50 tiL) T. acidophila RDPR. The mixture including everything except AdoCbl was pre-incubated at 550C for 2 min. At time zero a 50-jiL (usually <50 jiL, if corrected for AdoCbl volume) aliquot was removed, placed in a boiling water bath for 2 min, and then placed on ice. AdoCbl was added in the dark to start the reaction. A 50-jtL aliquot was removed at each desired time point. The aliquot was heated in a boiling water bath for 2 min to
stop the reaction, and then placed on ice. After all the time points were taken, 5 kl of 1 M Tris solution (pH-11) and 5 U of calf intestine alkaline phosphatase were added to each aliquot. The solution was then incubated at 370C for 1 h.
Deoxyadenosine (dA) was separated from adenosine (A) by chromatography on a (6.7 x 10 cm) silica gel plate (1/6 of the original (20 x 20 cm) plate) eluting with
potassium tetraborate saturated methanol.10 Five time points (from a 260-gL total assay volume) were spread evenly over the 6.7 cm length. Prior to chromatography, 10 nmol
(1 jgL of 10 mM solution) of carrier dA and A were spotted onto the TLC plate
respectively followed by 5 gL of the ~ 60 gL sample onto the same spot where carriers were spotted. The plate was dried with a heat gun, and then eluted with potassium tetraborate saturated methanol for - 40 min. The plate was visualized using UV light and the region of the plate containing the desired compound (dA) was cut out and soaked in 1 mL of water in a 20-mL scintillation vial for 10 min before the addition of 9 mL of Poly-Fluro scintillation fluid. The sample was well mixed by shaking and
counted for 5 min. As a control, 5 gl of the sample before TLC chromatography was also spotted onto TLC plate and analyzed for total radioactivity (dA + A) subsequent to elution with H20 under same conditions. Product formed was calculated from the
percentage of radioactivity of dA over the total radioactivity of dA and A.
[8, 5'- 3H] -GDP Assay
The assay procedure was similar to the [5, 8-3H]-ADP assay described above. The concentrated stock of [8, 5'-3H] -GDP (Lot number: 3232-250, 39.5 Ci/mmol, 98.8% as of 10/28/96) was diluted with unlabelled GDP to the desired specific activity. Carrier dG and G (10 nmol, 1 tL of 10 mM solution) were spotted onto the TLC plate respectively before the chromatography step. A typical final assay mixture contained in a volume of 260 tgL: 10 jiM GDP (S.A. = - 2 x 10⁵ cpm/nmol), 1 mM MgC12, 10 mM DTT, 100 jiM AdoCbl, 25 mM HEPES pH 7.5, and 0.1-0.2 [LM (0.5-1 jtg/50 pLL) T. acidophila RDPR.
[5-3H]-CDP Assay
The assay procedure was similar to the [5, 8- 3H]-ADP and [8, 5'-3H]-GDP assay procedures described above. The concentrated stock of [5-3H]-CDP (Batch 41, 22
Ci/mmol, 95.9% as of 3/12/96) was diluted with unlabelled CDP to the desired specific activity. Carrier dC and C (10 nmol, 1 pgL of 10 mM solution) were spotted onto the TLC plate respectively before the chromatography step. A typical final assay mixture
contained in a volume of 260 gL: 10 gM CDP (S.A. = - 2 x 10⁵ cpm/nmol), 1 mM MgCl2, 10 mM DTT, 100 gM AdoCbl, 25 mM HEPES pH 7.5, and 0.1-0.2 RtM (0.5-1 ktg/ 5 0 gL) T. acidophila RDPR.
[2- 14C]-CDP Assay
This assay procedure was a modification of the previously described [2-14 C]-CTP assay procedure for RTPR.18 The concentrated stock of [2- 14C]-CDP (Lot number: 3232-100, 59.1 mCi/mmol, 97.9% as of 1/29/96) was diluted with unlabelled CDP to the desired specific activity. A typical assay mixture contained in a final volume of 510 gL: 1 mM CDP (-~ 2 x 10³ cpm/nmol), 1 mM dGTP, 1 mM MgCl2, 30 mM DTT, 25 mM
HEPES pH 7.5, 100 gtM AdoCbl, and 10 gtM (100 kg/ 100 gL) T. acidophila RDPR. The entire mixture, except AdoCbl, was pre-incubated at 550C for 2 min. At time zero, a
100-ptL aliquot (usually <100 gL, if corrected for AdoCbl volume) was removed and quenched with 50 gL of 2% pre-chilled perchloric acid. AdoCbl was then added in the dark to start the reaction. A 100-tL aliquot was removed at each time point, quenched with 50 gtL 2% pre-chilled perchloric acid by vortexing, and then placed on ice. After all the time points were taken, 12 gtL of 1 M KOH was added to each sample to neutralize the solution. Alkaline phosphatase buffer (50 mM Tris pH 8.5, 1 mM EDTA) (50 gL) was added followed by addition of 5 U calf intestine alkaline phosphatase. The samples were then incubated at 370C for 1 h.
Deoxycytidine (dC) and cytidine (C) were separated by (0.75 x 7 cm) AG1-X2 columns (borate form, 50-100 mesh) prepared by the method of Steeper and Steuart.19 Each column was pre-washed with 20 mL of water. After carrier dC and C (120 nmol) were added to each aliquot, the sample was loaded onto the column and then eluted with 13 mL of water. A 1-mL aliquot was subjected to scintillation counting.
HPLC Analysis of [2-14C] -CDP Assay Products
The remaining 12-mL aliquot of the 13-mL eluate from the [2- 14C]-CDP assay described above was lyophilized and redissolved in 1 mL of H20. The 1-mL aliquot
was subjected to reverse phase HPLC analysis using an Econosil C18 column with H20
as the eluate. At a flow rate of 1 mL/min, the column was washed with MeOH for 15 min and the eluate was switched to H20 over a period of 15 min. The column was
equilibrated in H20 for an additional 15 min. After sample injection, the column was
washed with H20 at a flow rate of 1 mL/min, and 1-mL fractions were collected and
analyzed by scintillation counting. Cytosine, cytidine (C), and deoxycytidine (dC) eluted isocratically in H20 at ~ 5, 8.5, and 13 min respectively.
HPLC Analysis of [2- 14C] -CDP
[2-14C]-CDP was converted to cytidine (C) by alkaline phosphatase and then
analyzed by reverse phase HPLC to determine the radiochemical purity of the original [2-14C]-CDP. The reaction mixture contained in 50 gL: 0.27 jiM [2- 14C]-CDP (Lot
number: 3232-100, S.A. = 2182 cpm/nmol), 5 U alkaline phosphatase, 5 mM Tris pH 8.5, 0.1 mM EDTA. The mixture was incubated at 370C for 1 h, and 10 gtL was diluted to 1 mL followed by the reverse phase HPLC analysis similar to the [2-14C]-CDP assay
product analysis described above. The flow rate was reduced to 0.8 mL/min, and 0.8-mL fractions were collected and analyzed by scintillation counting. Cytosine, cytidine
(C), and deoxycytidine (dC) eluted isocratically in H20 at - 6, 10.6, and 16 min
respectively (corresponding to - 5, 8.5, and 13 min at 1 mL/min flow rate).
Large Scale Growth of T. acidophila RDPR Overproducing Strain RNR/pET23b(+)/BL21(DE3)
This protocol was for a 15-L growth (10 x 1.5 L in 4 L flasks) using two floor shakers. Two freshly transformed colonies of the T. acidophila RDPR overexpressing strain
RNR/pET23b(+)/BL21(DE3) were used to inoculate 2 x 100 mL LB media in 500 mL flasks. Ampicillin was freshly added to liquid LB medium to 100 jg/ mL at all stages. After - 10 h overnight growth at 30-320C, 5 mL from one of the two 100 mL cultures
(A600 = ~ 0.77, 0.89 respectively) was used to start each 1.5 L media in a 4 L flask at
370C. When A600 reached ~ 0.6-0.8 after ~ 5 h growth (doubling time - 30 min), IPTG
was added to 0.8 mM. A 1-mL sample was removed every h and A600 was recorded.
Cells were harvested 4 h after induction by centrifugation at 8,000 g for 20 min, rapidly frozen in liquid nitrogen, and then stored at -800C. Typically, ~23 g cells were obtained from the 15 L growth. A 7.5% SDS-PAGE gel was run to check the induction of T. acidophila RDPR.
Purification of T. acidophila RDPR
The purification procedure was modified from the original procedure developed by Tauer and Benner.10 All purification steps were carried out at 40C. Aliquots of 100-500 [tL were saved, from each stage of the purification for subsequent protein concentration determination and activity assays. Tris buffer was used throughout the entire
purification process: 50 mM Tris, 1 mM EDTA, pH 8.0 (at 40C) with freshly added 1 mM P-mercaptoethanol (70 gL/L). All columns were pre-equilibrated in this buffer and approximately 9-10 L was required for the entire purification.
Cells (23 g) were thawed and resuspended in - 90 mL Tris buffer, and lysed by passing through a French Press at 16,000 psi. Cell debris was removed by
centrifugation at 10,000 g for 20 min. PMSF (dissolved in minimum amount of ethanol, - 1 mL) was added to 1 mM (0.17 mg/mL) final concentration to the supernatant. With stirring, streptomycin sulfate solution (5% (w/v) in Tris buffer) was added slowly to a final concentration of 1% (w/v) over a period of 15 min. The solution was stirred for an additional 15 min. Precipitated DNA was then removed by centrifugation at 10,000 g for 20 min. Ammonium sulfate solid was then added to the supernatant (-110 mL) slowly with stirring to 60% saturation (390 g/L) over a period of 20 min and the solution was left stirring for an additional 30-40 min. The protein precipitate was recovered by centrifugation at 10,000 g for 20 min. The protein pellet was then dissolved in - 22 mL of Tris buffer and loaded onto a (4.5 x 30) cm Sephadex G25
column (- 500 mL bed volume) equilibrated in Tris buffer to remove excess ammonium sulfate and other small molecules. The protein containing fractions were pooled (- 170 mL) and the conductivity was checked to ensure clean desalting.
The desalted protein solution was loaded onto a (6 x 16) cm Q-Sepharose Fast Flow column (- 500 mL bed volume) equilibrated in Tris buffer and washed with Tris buffer until A280 reading was less than 0.1 to remove non-binding proteins. T. acidophila RDPR
was then eluted with a linear (500 mL x 500 mL) 0 -0.5 M NaCl gradient in Tris buffer containing 1 mM (0.17 mg/mL) PMSF. Activity assays (described in next section) as well as SDS-PAGE gels were run on every 2-3 fractions (400 drops, - 15 mL per fraction) and the T. acidophila RDPR containing fractions were pooled (~ 350 mL, eluting at - 0.3 M NaCl). The solution was then concentrated by the 400-mL Amicon using YM30 membrane to ~ 25 mL and then diluted back to 250 mL to decrease its ionic strength. The diluted protein solution was loaded onto a (3 x 20 cm) dATP-Sepharose affinity column at a rate of less than 1 mL/min. The affinity column was then washed with Tris buffer untill A280 was less than 0.1. A 7.5% SDS-PAGE gel was run on the flow-through
to check affinity binding. T. acidophila RDPR was then eluted with 100 mL of 10 mM ATP in Tris buffer (pH carefully adjusted back to 7.6) and then washed with Tris buffer. The ATP containing fractions (~ 150 mL) were then combined and concentrated by the 400-mL Amicon with YM30 membrane. The solution was concentrated and diluted several times until A260 of the flow through was less than 0.05, ensuring the removal of
excess ATP. The final protein solution was further concentrated via Centriprep-30 (clear base, MW cut-off 30,000 kDa) and exchanged into the storage buffer: 50 mM Tris pH 8.0, 1 mM EDTA, 1 mM DTT, 15% glycerol. The solution was rapidly frozen in liquid nitrogen and stored in aliquots at -800C.
The G-25 column was cleaned by washing with 3 volumes of H20. The Q-Sepharose
Fast Flow column was cleaned by washing with 3 volumes of 1 M NaC1. The dATP-Sepharose affinity column was cleaned immediately after use with 4 volumes of 0.1%
SDS in H20 at room temperature followed by an additional 4 volumes of H20.
Protein Analysis During Purification
A modified [5, 8-3H]-ADP assay was used during T. acidophila RDPR purification to monitor the activity for its convenience and time efficiency relative to the standard [5,
8-3H]-ADP assay described above. Typically, a cocktail for 40 assays (1.6-mL total
volume) was prepared for each purification. All reagents including AdoCbl, but
without T. acidophila RDPR were pre-mixed and stored frozen at -200C wrapped in foil. The concentration of the reagents was 1.25x the desired final concentration: 10 RM ADP (S.A. = - 2 x 10⁵ cpm/nmol), 1 mM dGTP, 1 mM MgCl2, 10 mM DTT, 100 jiM AdoCbl, 25 mM HEPES pH 7.5, 15 mM hydroxyurea. Hydroxyurea was added to prevent the interference from E. coli RNR activity. For a 50-jtL total reaction mixture, 40 jtL was from the assay cocktail and 10 gL was from either the protein solution or Tris buffer. A single fixed time point of 10-15 min at 550C was used subsequent to the addition of protein solution to start the reaction. Removal of the phosphates with calf intestine
alkaline phosphatase was shortened to 30 min. No background counting control was performed, and the sample was only counted for 3 min. The assay can be completed in -3 h.
Complimentarily, 7.5% SDS-PAGE gels were used to follow the course of
purification. If the gels were prepared before starting a column, the entire procedure can be completed within 1.5 to 2 h.
Determination of Extinction Coefficient
Purified T. acidophila RDPR was treated with DNAse in a volume of 1.1 mL: 25 mM HEPES (pH 7.5), 0.12 mM T. acidophila RDPR (12 gg/gL), 20 U DNAse, 1 mM MgCl2. The mixture was incubated at room temperature for 15 min. The protein solution was then loaded onto a (1.5 x 4.5) cm Sephadex G-25 column pre-equilibrated in Tris buffer
(50 mM Tris, pH 8.0 at 40C, 1 mM DTT) and washed with the same buffer. Fractions of 1 mL were collected and UV spectrum was taken. Protein concentration was
determined on the same fraction using BSA as the protein standard. Extinction coefficient of T. acidophila RDPR was calculated according to Beer-Lambert Law.
Results and Discussion
Extraction and Restriction Mapping of Plasmid RNR/pET23b(+)
The restriction map of T. acidophila RDPR is attached in Appendix II. Since the
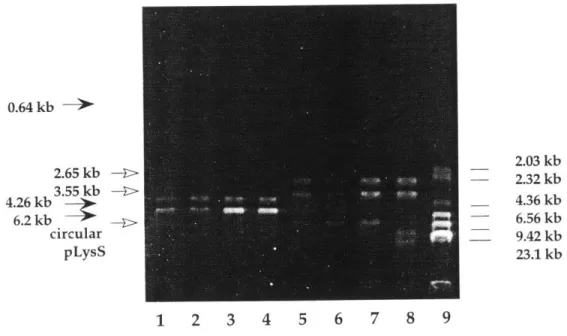
plasmid RNR/pET23b(+) was extracted from BL21(DE3)pLysS cells, plasmid pLysS was extracted at the same time. The restriction maps of plasmid RNR/pET23b(+) (6.2 kb), and pLysS (4.9 kb) are shown in Figure 1.1 and Figure 1.2.
From the plasmid map, it can be seen that for RNR/pET23b(+), all four enzymes (NotI, NdeI, HindIII, and BamHI) are single cutters; for pLysS, BamHI cuts twice at location 1.87 kb and 2.51 kb, HindIII cuts once at location 1.5 kb, and neither NotI nor
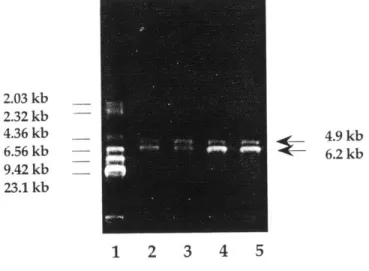
Ndel cuts. The expected band sizes from the digests performed are listed in Table 1.1. The experimental results with HindIII, BamHI, and NotI+NdeI digests are shown in Figure 1.3 and Figure 1.4.
In Figure 1.3, the HindIII digest gave the expected 6.2 kb band for RNR/pET23b(+) and 4.9 kb band for pLysS. In Figure 1.4, BamHI digestion gave the expected 6.2 kb band for RNR/pET23b(+) and 0.64 kb, 4.26 kb bands for pLysS. The 0.64 kb band was rather faint on the agrose gel. The double digestion with NotI and NdeI gave bands of 2.65 kb and 3.55 kb for RNR/pET23b(+) and uncut circular pLysS which migrated differently from linear DNA. Colony 4 gave extra bands in the NotI+NdeI double digest which could have arisen from supercoiled circular pLysS DNA. Overall, the restriction mapping pattern confirmed the presence of both plasmids.
Small Scale Induction Check on T. acidophila RDPR Expression
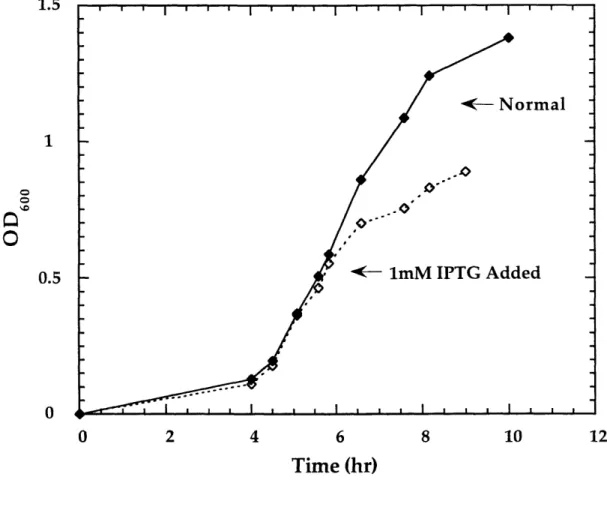
No obvious induction was observed with the original clone pET23b/#8/0081293 in BL21(DE3)pLysS obtained from Benner. Modest induction was observed with the new transformants. A typical growth curve of RNR/pET23b(+)/BL21(DE3) is shown in Figure 1.5. The cell growth slowed down upon the addition of IPTG which usually correlates well with good induction. Induction was observed at starting A600 of 0.6-1.0,
IPTG 0.6-1 mM. To save time and material, the final induction condition was chosen to be at A600 of 0.6-0.8 with 0.8 mM IPTG. Since maximum overexpression of T. acidophila
RDPR is at a level estimated to be -5% of total cellular protein, it is important not to overload the SDS-PAGE gel in order to observe clear induction on the gel. It should be noted that despite the theoretical MW of T. acidophila RDPR of 96.9 kDa, the enzyme migrates at 85 kDa based on the high range MW marker from Sigma as shown in Figure 1.6.
The discrepancy in MW by SDS-PAGE gel relative to its calculated MW based on gene sequence, caused us to submit the purified protein to MIT Biopolymer Lab for
automated Edman sequencing. The results, attached in Appendix III, are identical to that predicted by the gene sequence: MIKEV. Although C-terminal clipping remains a possibility, the fact the recombinant T. acidophila RDPR retains the native specific activity makes it less likely. It was also observed that RNR from archaeon Pyrococcus furiosus had a deduced protein MW of 200 kDa where as the native protein had a MW of
90 kDa as reported by Fontecave's Laboratory in France.11 This discrepancy was caused by the presence of two inteins within the 200 kDa protein which presumably were
spliced out to generate the 90 kDa mature enzyme. The presence of inteins in T. acidophila RDPR could also be a possibility for the MW discrepancy as there is "an
apparently significant predispostion for inteins to insert within genes encoding DNA and nucleotide modifying enzymes of Archae.11"
Tritium Exchange Assay on Crude Cell Lysate
This specific tritium exchange assay carried out was rather simplified as the purpose of the experiment was to check the expression of T. acidophila RDPR in BL21(DE3) cells. Only one time point was taken. The standard procedure 18 should be followed for more quantitative analysis. Although it was previously shown that 3 mL of H20 was
sufficient to remove all the 3H20 from the assay mixture,18 this control reaction should
have been repeated.
The experimental results are listed in Table 1.2. When no lysate was added, there was a basal tritium exchange rate over the course of 30 min at 550C. The host strain JM109 does not contain DE3 gene that produces T7 polymerase upon IPTG induction,
thus no T. acidophila RDPR was expressed in JM109 cells. The result showed a slightly higher cpm value above background controls, with no enzyme dependence. This also showed that in normal E. coli cells, there was no significant tritium exchange activity which is specific for AdoCbl-dependent RNRs. Clear enzyme dependence was observed for BL21(DE3) host cells with the radioactivity released being significantly
above the background level indicating the expression of T. acidophila RDPR. These results clearly showed the overexpression of T. acidophila RDPR in BL21(DE3) upon IPTG induction.
Activity Assays for T. acidophila RDPR
Due to the low specific activity of T. acidophila RDPR (< 100 nmol/mg/min) compared with other RNRs, the coupled spectrophotometric assay with
TR/TRR/NADPH reducing system is not sensitive enough for the detection of enzymatic activity. Therefore, radioactive assays are used for T. acidophila RDPR.
For the assays using 3H-labelled nucleotides, a sample TLC plate showing the
separation of dA from A, dC from C, and dG from G is shown in Figure 1.7 with their Rf values listed in Table 1.3. It is shown that C and G do not dissolve very well in the
eluent, thus leaving a long faint trail on the plate. However, the fact that the
deoxynucleosides have greater Rf values relative to the nucleosides makes the product analysis possible. Clear time dependence was observed for the TLC based assays. Sample assay time curves are shown in Figure 1.8, Figure 1.9, and Figure 1.10 for the [5, 8-3H]-ADP, [8, 5'-3H] -GDP, and [5-3H]-CDP assays respectively.
To obtain good separation, particularly for dA and A, it was important to keep the spot small, dry the plate well, and preferably run the solvent front for greater than 8 cm. The background counts that co-migrate with the deoxynucleosides in time zero points for the TLC based assays relative to total radioactivity are close to the radiochemical impurity of the starting materials.
A sample assay time curve for the [2-14C]-CDP assay is shown in Figure 1.11. The
time zero time point typically gave a high background of 300-400 cpm (corresponding to - 2% of total counts). It was noticed that the new lot purchased (Lot number: 3232-100) had a radiochemical purity of 97.9% as of 1/29/96 while the previous lot (Lot number: 2901-101) had a radiochemical purity of 99.5% as of 5/11/92. The same high
background was observed with different lots of borate columns. The HPLC analysis of the [2-14C]-CDP assay products, as shown in Figure 1.12, shows impurities eluting off at 3-5 mL. There is no peak at - 8.5 mL where C elutes as expected. At assay time point zero, there is no peak at ~ 13 mL where dC elutes; after 1 min, small amount of product dC is formed. The HPLC analysis on the [2-14C]-CDP substrate, as shown in Figure 1.13, shows impurities eluting at 3-5 mL before the major peak of C. The HPLC analysis
results suggest that the high background is not caused by the borate column separation step. It likely arises from the impurity present in the initial substrate, possibly cytosine which elutes at - 5 mL and some other derivatives that can pass through the borate column. Although the background counts are high compared with previous experience in the Stubbe lab, it is still tolerable for current experimental purposes. For single turnover experiments, further purification of the substrate is required.
Attempts to use borate columns to separate dC from C in the [5-3H]-CDP assay as in the [2-14C]-CDP assay gave very high background counts (- 10% of the total
radioactivity loaded). This could be explained by the tritium washout by H20 in the 5
position. Therefore, the TLC separation method is recommended for the [5-3H]-CDP assay.
Overall, when a comparison is made between the [2-14C]-CDP assay and the [3H]-nucleotide assays, the TLC based assays using [5, 8-3H]-ADP, [8, 5'-3H] -GDP, and
[5-3H]-CDP are cost-efficient (~ $300/250 jiCi vs. - $400/10 gCi) and have a higher
sensitivity as the substrates have a higher specific activity. Therefore, the [3
H]-nucleotide assays have been used during the enzyme purification process as only 0.5-1 gtg protein are required per 50 pL assay aliquot, as well as in the allosteric regulation studies when low substrate concentrations (< 10 jiM) are studied (Chapter 2). However,
the borate column based [2- 14C]-CDP assay is faster and better established than the TLC based assays.
Large Scale Growth of T. acidophila RDPR Overproducing Strain RNR/pET23b(+)/BL21(DE3)
As plasmid RNR/pET23b(+) carries ampicillin resistance, plasmid stability could be a potential problem.20 Plasmid stability was checked once on a small 10 mL culture
starting from a single colony following the standard protocol,20 and no plasmid loss was observed. However, when liquid culture transfer was involved as when a small overnight culture was used to start a larger culture, the dilution factor becomes very important. Dilution of 1:40 was carried out once and the induction was very poor likely the result of plasmid loss. It was also noted that the A600 reading did not slow down
upon addition of IPTG in that specific growth. It is thus recommended to use at least 1:200 dilution, especially when the overnight culture has reached stationary phase of A600 - 1.3. If the small culture is started from a single colony early in the morning and
used before A600 reaches 1.0, the dilution factor can be lowered to 1:40. Overall, it is a
good idea to minimize the final A600 of the small culture (by lowering growth
temperature and reducing growth time) and to maximize the dilution factor at reasonable time expense.
Purification of T. acidophila RDPR
The purification procedure involves removal of nucleic acid and protein by standard batch fractionation procedures, followed by anion exchange chromatography on Q-Sepharose column. The results of the latter are shown in Figure 1.14 and Figure 1.15. The relative specific activity (cpm/A280) corresponded very well to the relative intensity
of the T. acidophila RDPR band on SDS-PAGE gels. T. acidophila RDPR elutes at ~ 0.3 M NaCl as a quite sharp peak with light yellow color, followed by a broad intense yellow fraction. Based on the color, it can roughly be estimated in which fractions T. acidophila RDPR elutes. A shallower gradient of (500 mL x 500 mL) 0-0.5 M NaCl is now used and gives better separation.
The second column involves the use of dATP affinity column. As ATP co-elutes with T. acidophila RDPR, it is impossible to monitor the protein concentration with UV spectroscopy at A280. One can either pool all the ATP fractions or run a quick
SDS-PAGE gel (only half length of the gel needed to be run as there will only be one major band on the gel) to check the protein location and pool the appropriate fractions. An efficient way is to start concentrating the first 2-3 fractions (30-50 mL) that contain T. acidophila RDPR, while running the SDS-PAGE gel to check the latter fractions. A typical SDS-PAGE gel of dATP affinity column fractions is shown in Figure 1.16.
The activity assay on the dATP affinity column fractions did not correspond well with the protein density on the SDS-PAGE gel. The counts were low and at the same level for all the fractions. It could be that high ATP concentration (~ 10 mM) interfered with the assay. In the sample purification described, 100 mg of protein was obtained with specific activity of 40.5 nmol/min/mg based on the [2-14C] CDP assay. A sample purification table is shown in Table 1.4. A SDS-PAGE gel for the entire purification process is shown in Figure 1.17.
Determination of Extinction Coefficient
The UV spectrum of T. acidophila RDPR is shown in Figure 1.18. The final protein UV spectrum is found to have a max X276 with a molar extinction coefficient of 56,000 cm-1M -1. However, it should be noted that it is assumed that T. acidophila RDPR has a similar tyrosine content as BSA which is the basis for the Lowry assay.
Sample Calculation: A =ccl
A276 = 0.52, 1 = 1 cm
c = [RDPR]=0.9275 tg/gL = 0.9275 g/L / 10,000 g/mol = 9.275 jaM
References
(1) Thelander, L.; Reichard, P. Ann. Rev. Biochem. 1979, 48, 133-158.
(2) Lammers, M.; Follmann, H. Ed., The Ribonucleotide Reductases-A Unique Group of Metalloenzymes Essential for Cell Proliferation; Springer-Verlag: Heidelberg, 1983.
(3) Stubbe, J. Adv. Enzymol. Relat. Areas Mol. Biol. 1990, 63, 349-417. (4) Reichard, P. Science 1993, 260, 1773-1777.
(5) Stubbe, J.; van der Donk, W. A. Chem. Biol. 1995, 2, 793-801.
(6) Willing, A.; Follman, H.; Auling, G. Eur. J. Biochem. 1988, 178, 603-611. (7) Auling, G.; Follmann, H. in Metal Ions in Biological Systems; Sigel, H. Sigel, A. Ed.; Marcel Dekker, Inc., New York, 1994; Vol. 30, pp
(8) Ashley, G. W.; Harris, G.; Stubbe, J. J. Biol. Chem. 1986, 261, 3958-3964. (9) Tauer, A., Ph.D. Thesis, Eidgenossische Technische Hochschule, 1994. (10) Tauer, A.; Benner, S. A. Proc. Natl. Acad. Sci. 1997, 94, 53-58.
(11) Riera, J.; Robb, F. T.; Weiss, R.; Fontecave, M. Proc. atl. Acad. Sci. 1997, (12) Lunn, C. A.; Kathju, S.; Wallace, B. J.; Kushner, S.; Pigiet, V. J. Biol. Chem. 1984, 259, 10469-10474.
(13) Russell, M.; Model, P.
J.
Bacteriol. 1985, 163, 238-242.(14) Berglund, O.; Eckstein, F. Methods Enzymol. 1974, 34B, 253-261.
(15) Knorre, D. G.; Kurbatov, V. A.; Samukov, V. V. FEBS Lett. 1976, 70, 105-108.
(16) Lowry, O. H., Rosebrough, N.J., Farr, A.L., & Randall, R.J. J. Biol. Chem 1951, 193, 265-275.
(17) Laemmli, U. K. Nature (London) 1970, 227, 681-685. (18) Booker, S., Ph.D. Thesis, MIT, 1994.
(19) Steeper, J. R.; Steuart, C. D. Anal. Biochem. 1970, 34, 123-130.
(20) Studier, F. W.;. R., A. H.; Dunn, J. J.; & Dubendorff, J. W. in Methods in Enzymology; Ed.; 1990; Vol. 185, pp 60-89.
(P)PPO
N
HO
OH
\E /1 U ~RNR
NDP/NTP
ErSH
E-SH
/--S
El
dNDP/dNTP
thioredoxin (TR)
thioredoxin reductase (TRR)
NADPH
Scheme 1.1 Ribonucleotide reductase catalyzes a key step in DNA biosynthesis. Courtesy of Dr. W. A. van der Donk.
E. coli, mammalian Class I
FeoO.Fe
Class IV,--ao.
L. leichmanniiCH2Ad
/--o
H
H
E
anaerobic E. coli 9j
MngO-Mn
B. ammoniagenes Class II Class IIIScheme 1.2 RNRs use a wide range of cofactors. The cofactors used by the four major classes of RNRs are shown. Although chemically diverse, it seems likely that each of these cofactors can be used to help form a thiyl radical (center), which is essential for catalysis in at least two, and probably all four, classes of RNRs. Courtesy of Dr. W. A. van der Donk.
H20
t
TRTRRINADPH.40
-Scheme 1.3 Proposed mechanism for nucleotide reduction by RNRs. A transient thiyl radical initiates the nucleotide reduction process by abstracting the 3'-hydrogen atom from the nucleoside diphosphate. H20 is lost, and the two cysteines on the cx-face of the nucleotide then deliver the required reducing equivalents, generating a
3'-ketodeoxynucleotide and a disulfide radical anion. This intermediate is subsequently reduced to give dNDP and a disulfide and to regenerate the thiyl radical. N, base. Courtesy of Dr. W. A. van der Donk.
Table 1.1 Expected digest pattern of plasmid RNR/pET23b(+) and pLysS
Enzyme RNR /pET23b(+) pLysS
# of Site Band Size (kb) # of Site Band Size (kb)
HindIII 1 6.2 1 4.9
BamHI 1 6.2 2 0.64, 4.26
NotI+NdeI 1+1 2.65, 3.55 0+0 circular
Table 1.2 Tritium exchange assay results
Host Strain Lysate (pL) Protein (gg) Time (min) 3H20 CPM
0 0 0 430 0 0 30 1227 JM109 3 168 30 1424 JM109 17 952 30 1436 BL21(DE3) 6 120 30 2865 BL21(DE3) 17 340 30 7398
Table 1.3 Rf values of deoxynucleosides and nucleosides*
dA/A dC/C dG/G
dN 0.71 0.66 0.75
N 0.51 0.45 0.43
*The Rf values may vary slightly with different salt concentration in the assay mixture.
Table 1.4 Sample purification table for T. acidophila RDPR
Sample Protein S.A. * Tot. U Pur. Factor Yield (%)
(mg) (U/mg)
Lysate 1071 0.93 999.5 1.0
DNA 2311 0.86 1977.0 0.9 100%
Q-sepharose 926 2.16 2000.0 2.3 100%
dATP 100 19.80 1980.0 21.4 100%
*Assay condition was as of the ADP assay used for purification described in the experimental section.
1.53
1.75
Nde 12.85
Plasmid map of RNR/pET23b(+). Selected sites are highlighted. Adapted
Figure 1.1
BarD i4874) EcoR I(1) NCO 1:45f6) S.B-&sr07 1(598) Drd 1(4343) BXmn 107 I(SOmi Baul3 1(42: ,.Xmn 1(/l 8au38 Icz~l Bd 1mas) Eaml108 1(3Mae Drd llf3t a1 (4886bp) ala v set OSpM 1319Mn -ApaB 0t1188) NrEag 13017 Eag lI267=j / Xbai (1424o
;\-r
TC prosoler Cla Insits) Hind 111f1123) -EcoA Vn sal)Sal 1127ran '? lsa il1992)
EcON I , \2 I 9 21 BsrG 142454) 1Pms 1%24491 1 Pme kPIs) SBýAMI) pLysE (4886bp)
Plasmid map of pLysS. Selected sites are highlighted. Adapted from
Figure 1.2
2.03 kb 2.32 kb 4.36 kb 6.56 kb 9.42 kb 23.1 kb S4.9 kb 6.2 kb 1 2 3 4 5
Figure 1.3 Restriction digest pattern with HindIII. Lane 1 contains the molecular size markers (HindIII digest of X DNA). Lane 2-5: colony 1-4. Source: Book I, p.47.
0.64 kb -> 2.65 kb 3.55 kb 4.26 kb 6.2 kb circular pLysS 2.U3 KD 2.32 kb 4.36 kb 6.56 kb 9.42 kb 23.1 kb 1 2 3 4 5 6 7 8 9
Figure 1.4 Restriction digest pattern with BamHI, and NotI+NdeI. Lane 1-4: colony 1-4 with BamHI; Lane 5-8: colony 1-4 with NotI+NdeI. Source: Book I, p.47.
1.5 0.5 0 * 1 1 7 1- I I I I I j I I II I 1 1 1
Time (hr)
Figure 1.5 Sample growth curve of RNR/pET23b(+)/BL21(DE3). Started from a single colony, 100 Rg/mL ampicillin, 10 mL culture size.
l -- Norma
0--m
•- 1mM IPTG Added I 4 B202 kDa 116 kDa 97 kDa 66 kDa RDPR 85 kDa MW 1 2 3 4 5
Sample induction gel of RNR/pET23b(+)/BL21(DE3). Lane 1: BL21(DE3) without plasmid. Lane 2-5, t = 0, 1, 3, 4 h. Induced at A600 = 0.6, IPTG = 0.8 mM.
Source: Book I, p.64. Figure 1.6
dG
dA
dC
A / (1 \ G \ ` (I I A Sc-A dA A C dC C G dG G + + + dA dC dGFigure 1.7 Sample TLC plate of deoxynucleosides and nucleosides separation. Eluted with potassium borate saturated methanol. Drawing is based on UV intensity.
40
3020
10
Figure 1.8 I I I I I I I I I I I I I I I i I I I I0
2
4
6
8
10
12
14
16
Time (min)
Sample [5, 8-3H]-ADP assay. Assay conditions: 10 jiM ADP (S.A. = 1.55 x 10⁵ cpm/nmol), 1 mM MgC12, 10 mM DTT, 100 gM AdoCbl, 1 mM dGTP, 100 mM Tris pH 8.0, 0.2 jtM T. acidophila RDPR. Source: Book II, p. 85.
assay curve--I I i i i iI , I I I I I I1I I ' t I I
![Figure 1.9 Sample [8, 5'- 3 H] -GDP assay. Assay conditions: 10 gM GDP (S.A. = 2.2 x 10⁵ cpm/nmol), 1 mM MgCl2, 10 mM DTT, 100 ptM AdoCbl, 100 mM Tris pH 8.0, 0.053](https://thumb-eu.123doks.com/thumbv2/123doknet/14246231.487569/52.918.124.732.190.710/figure-sample-assay-assay-conditions-mgcl-adocbl-tris.webp)
![Figure 1.11 Sample [2- 14 C]-CDP assay. Assay conditions: 1 mM CDP (S.A. = 2.2 x 10 cpm/nmol), 1 mM MgCl2, 30 mM DTT, 100 gM AdoCbl, 25 mM HEPES pH 7.5, 10 jM T](https://thumb-eu.123doks.com/thumbv2/123doknet/14246231.487569/54.918.115.707.181.723/figure-sample-assay-assay-conditions-mgcl-adocbl-hepes.webp)
![Figure 1.12 HPLC analysis of [2- 14C]-CDP assay product. Eluted with H 2 0. Flow rate: 1 mL/min](https://thumb-eu.123doks.com/thumbv2/123doknet/14246231.487569/55.918.76.724.201.786/figure-hplc-analysis-cdp-assay-product-eluted-flow.webp)
![Figure 1.13 HPLC analysis of [2-14C]-CDP. Eluted with H20. Flow rate: 0.8 mL/min.](https://thumb-eu.123doks.com/thumbv2/123doknet/14246231.487569/56.918.132.712.202.785/figure-hplc-analysis-cdp-eluted-flow-rate-min.webp)