ÉCOLE DE TECHNOLOGIE SUPÉRIEURE UNIVERSITÉ DU QUÉBEC
THESIS PRESENTED TO
ÉCOLE DE TECHNOLOGIE SUPÉRIEURE
IN PARTIAL FULFILLMENT OF THE REQUIREMENTS FOR A MASTER’S DEGREE WITH THESIS IN AEROSPACE ENGINEERING
M. A. Sc.
BY
Niloofar MORADI-KHANIABADI
RAPID AIRFOIL DESIGN FOR
UNCOOLED HIGH PRESSURE TURBINE BLADES
MONTREAL, DECEMBER 01, 2015 © Copyright 2015 reserved by Niloofar Moradi
© Copyright reserved
It is forbidden to reproduce, save or share the content of this document either in whole or in parts. The reader who wishes to print or save this document on any media must first get the permission of the author.
THIS THESIS HAS BEEN EVALUATED BY THE FOLLOWING BOARD OF EXAMINERS
Dr. Hany Moustapha, Thesis Supervisor
Mechanical Engineering and AeroÉTS at École de technologie supérieure
Dr. François Garnier, Thesis Co-supervisor
Mechanical Engineering at École de technologie supérieure
Dr. Roger Champagne, President of the Board of Examiners Software and IT Engineering at École de technologie supérieure
Dr. Sylvie Doré, Member of the jury
Mechanical Engineering at École de technologie supérieure
Dr. Panagiota Tsifourdaris, External Evaluator Pratt & Whitney Canada Corp
THIS THESIS WAS PRESENTED AND DEFENDED
IN THE PRESENCE OF A BOARD OF EXAMINERS AND PUBLIC ON NOVEMBER 17, 2015
ACKNOWLEDGMENT
Though only my name appears on the cover of this dissertation, a great many people have contributed to its production. I owe my gratitude to all those people who have made this dissertation possible and because of whom my graduate experience has been one that I will cherish forever. This thesis represents three years of graduate studies while working full time. These three demanding years would not have been possible without the immense support and encouragement of my academic and technical supervisors, my colleagues, my loving husband, family and friends.
First and foremost, I would like to thank my supervisor, Dr. Hany Moustapha. Dr. Moustapha has not only encouraged and guided me throughout my graduate studies but
also has had a significant impact on my career. During the final semester of my bachelor degree, Dr. Moustapha offered me an internship position in the Turbine Aerodynamics department of Pratt & Whitney Canada, which led to my full time position in that department a few months later.
I also would like to express my deepest gratitude for my technical supervisor, Mr. Edward Vlasic, who has been a dedicated mentor since the beginning of my career at P&WC. Mr. Vlasic patiently guided me through this research project with his vast knowledge and skill. He encouraged me and helped me stay focused and disciplined over the past three years. His keen eye and attention to detail were instrumental in editing my thesis and making my first conference presentation experience (ASME Turbo Expo 2015) a success I will remember always. I am forever grateful for having had the opportunity of working alongside, and learning from, him.
I would like to thank my co-supervisor, Dr. Garnier for his guidance.
I also would like to thank my colleagues at Pratt & Whitney Canada for their moral and
Bruno Chatelois, and Daniel Lecuyer of Pratt & Whitney Canada for their insight, expertise and contribution that greatly assisted this work.
Last but not least, I would also like to thank my family and express my eternal gratitude to my parents, for their everlasting love and encouragement and for teaching me to see every challenge through to the end. I also must acknowledge my husband and best friend, Jayson, for his love, patience, understanding and encouragement.
CONCEPTION RAPIDE DE SURFACES AÉRODYNAMIQUES POUR AILETTE NON-REFROIDIE DE TURBINE HAUTE PRESSION
Niloofar MORADI-KHANIABADI
RÉSUMÉ
Le processus de conception de moteur d’avion est hautement itératif, multidisciplinaire et complexe. Le succès de la conception de tout moteur d’avion réside dans l’optimisation de l’interaction entre plusieurs disciplines traditionnelles de l’ingénierie telle que l’aérodynamique et la structure. Dernièrement, l’emphase est placée sur l’intégration des systèmes et sur l’utilisation d’outils d’optimisation interdisciplinaires dans la phase de conception préliminaire. Ce document présente l’étude de la création automatique de surfaces aérodynamiques pour les ailettes non-refroidies de turbine haute pression dans la phase de conception préliminaire, communément appelé Rapid Airfoil 3D (RAF-3D). L’algorithme utilise « Turbine Aero Meanline (TAML) » en parallèle avec une base de données de paramètres de concepts antérieurs de profils aérodynamiques de P&WC, des règles de conception internes et les meilleures pratiques pour définir un concept préliminaire de surfaces aérodynamiques. Celles-ci peuvent être utilisées par les divers groupes analytiques pour compléter les premières analyses structurelles et vibratoires. L’aérodynamique des surfaces résultantes est validée en utilisant le code interne 3D RANS.
Grâce à RAF-3D, le temps nécessaire au groupe de l’aérodynamique des turbines de P&WC pour fournir des surfaces aérodynamiques 3D préliminaire aux groupes d’analyse de structures et de vibration sera divisé par dix. De plus, l’évaluation préliminaire des spécialistes de structure et de vibration sera plus précise puisque leurs calculs seront basés sur une première ébauche des surfaces aérodynamiques en 3D.
RAPID AIRFOIL DESIGN FOR
UNCOOLED HIGH PRESSURE TURBINE BLADES
Niloofar MORADI-KHANIABADI
ABSTRACT
The aero-engine design process is highly iterative, multidisciplinary in nature and complex. The success of any engine design depends on best exploiting and considering the interactions among the numerous traditional engineering disciplines such as aerodynamics and structures. More emphasis has been placed lately on system integration, cross discipline use of tools and multi-disciplinary-optimization at the preliminary design phase. This current work investigates the automation of the airfoil generation process, referred to as Rapid Airfoil 3D (RAF-3D), for uncooled high pressure turbine blades at the preliminary design phase. This algorithm uses the turbine aero meanline (TAML) in parallel with a database of parameters from previously designed P&WC airfoils, in-house design rules and best practices to define a pre-detailed airfoil shape which can be fed back to other analytical groups for pre-detail structural and vibrational analyses. Resulting airfoil shapes have been aerodynamically validated using an in-house 3D RANS code.
RAF-3D will shorten the turnaround time for P&WC’s turbine aerodynamics group to provide a preliminary 3D airfoil shape to turbine structures group by up to a factor of ten. Additionally, the preliminary assessments of stress and vibration specialists will be more accurate as their assessments will be based on a “first pass” 3D airfoil.
TABLE OF CONTENTS
Page
INTRODUCTION ...1
CHAPTER 1 LITERATURE REVIEW ...5
1.1 RAF-I ...5
1.1.1 Mid-section parameter prediction ... 5
1.1.2 Hub and tip sections parameter extrapolation ... 7
1.2 Preliminary Parameter Prediction ...9
1.3 Airfoil Generation ...10
1.4 Automation & Integration ...13
CHAPTER 2 RAPID AIRFOIL 3D (RAF-3D) APPROACH ...15
2.1 Mid-section Parameter Prediction ...19
2.2 Hub and Tip Sections Parameter Extrapolation ...24
CHAPTER 3 3D AIRFOIL SHAPE GENERATION ...29
3.1 Area Matching Parameters ...34
CHAPTER 4 AUTOMATION AND PROGRAMMING ...35
4.1 Read and store baseline database information ...36
4.2 Read and store TAML output data ...37
4.3 Calculate final airfoil section parameters ...38
4.4 Updating CAD model with airfoil section parameters ...39
CHAPTER 5 VALIDATION ...41
CONCLUSION ...49
FUTURE WORK ...51
LIST OF TABLES
Page Table 2.1 RAF-3D concept airfoil parameter origin ...27 Table 5.1 Cases I, II, and III HPT stage efficiency comparison: ...47
LIST OF FIGURES
Page
Figure 0.1 Gas turbine design steps...3
Figure 2.1 Cone angle definition ...17
Figure 2.2 Airfoil geometry terminology ...17
Figure 2.3 Airfoil geometry terminology ...18
Figure 2.4 In-house mid-section throat approximation ...22
Figure 2.5 Kacker & Okapuu stagger prediction ...23
Figure 2.6 RAF-3D stagger prediction for HPT blade mid-section ...23
Figure 2.7 Uncovered turning criterion ...24
Figure 3.1 Basics of RAF-3D parameterized 2D airfoil section ...29
Figure 3.2 Basics of RAF-3D points and curve definition for 2D airfoil section ...30
Figure 3.3 Parameterized airfoil pocket ...31
Figure 3.4 Stacking for airfoils with cavity ...32
Figure 3.5 Corrected stacking for airfoils with cavity ...32
Figure 3.6 CAD model restacking capability ...33
Figure 3.7 CAD Model Extension Capability ...34
Figure 4.1 RAF-3D overall process ...36
Figure 4.2 Traiangulation of database parameters ...37
Figure 4.3 RAF-3D automation sequence using the GUI ...39
Figure 5.1 Test Case 1 ...44
Figure 5.2 Test Case II ...45
LIST OF ABREVIATIONS
BP Best Practices
CAD Computer-Aided Design
CFD Computational Fluid Dynamics CG Center of Gravity
GUI Graphical User Interface HPT High Pressure Turbine
LE Leading Edge
LED Leading Edge Diameter LEMA Leading Edge Metal Angle LEWA Leading Edge Wedge Angle
PMDO Preliminary Multi-Disciplinary Optimization
PT Power Turbine
P&WC Pratt & Whitney Canada RAF-3D Rapid Airfoil 3D
RANS Reynolds-Averaged Navier-Stokes TAML Turbine Aero Meanline
TE Trailing Edge
TET Trailing Edge Thickness TEWA Trailing Edge Wedge Angle
INTRODUCTION
Gas turbine technology has continuously evolved for over 80 years. Increasing cost of fuel and greenhouse gas emissions have driven the industry to develop gas turbine engines with ever improving efficiencies. Many different technologies have been introduced to achieve this. The turbine, being at the core of the gas turbine engine, is an area that has received much attention for improvement. Given an extended design schedule and infinite computational power, this improvement could be enhanced further; however this is impractical or impossible. The gas turbine industry, like any other, is very interested in advancing its design process, and has been focusing its attention on improving the overall design process and all the sub processes, which include the many interactions among different engineering disciplines (for example aerodynamics, structures, and dynamics) and life cycle disciplines such as manufacturability and cost (Panchenko and al., 2002). The concept design stage, an early sub process in the overall design cycle, is an extremely important step. Pratt and Whitney Canada (P&WC) aims to use the potential of a Preliminary Multi-Disciplinary Optimization (PMDO) project in order to greatly reduce the design time and achieve better over-all engine performance (Brophy, Mah and Turcotte, 2009) because “the best engineering effort cannot totally right a poor concept selection” (Ryan and al., 1996). In addition, the overall risk to an engine program will be greatly reduced because the need in development, for example, to “cut-back” a portion of the blade tip to reduce dynamic stresses, will most likely, be eliminated. Rapid Airfoil 3D (RAF-3D) is an important part of the P&WC-ETS joint PMDO program aiming to automate and improve the preliminary airfoil design process, which is currently a manual and sometimes tedious process.
A great deal of research has been done in the field of turbine design process improvement, not the least of which are optimization, tool improvement, and process automation. It has to be emphasized here that aerodynamic design of an airfoil is affected by many other aspects such as stress and dynamics. The whole design process is a series of iterations during which all analysts have to integrate conflicting requirements.
It is important to provide some background and describe P&WC’s current 3D airfoil design process before introducing RAF-3D in the subsequent chapters. Figure 0.1 summarizes the gas turbine design process starting from customer’s inquiry for a new product to the production phase and after market, with aerodynamics at the heart of the whole process.
Focusing on the aerodynamics block of Figure 0.1, and zooming in further to concentrate on turbine aerodynamics, preliminary airfoil design at P&WC starts at the meanline level where the velocity triangles are calculated in a free vortex environment with the corner points of each airfoil defining the gaspath.
At this stage if the design forecast is promising, the aerodynamicist will take a ‘baseline or reference’ 3D airfoil and manually update several parameters at the mid-section, with information taken from the meanline. Considering a typical three section design of a high pressure turbine blade (which will be the focus of this work), the aerodynamicist must then predict the parameters for hub and tip sections of the airfoil using different design rules and knowledge from previous turbine designs. A cycle zero airfoil will then be produced based on modified reference sections that each meets the cross-sectional area requirement.
3
Figure 0.1 Gas turbine design steps (Cohen, Rogers and Saravanamuttoo, 1996)
The focus of this thesis was to resolve the problem of limited accuracy at the pre-detailed design phase due to the lack of a realistic 3D airfoil shape and the amount of time that is required to design with the current manual process.
The primary objective of this thesis was to accelerate the concept design cycle of an airfoil. In order to achieve this objective the following were performed. First, a set of correlations, which was derived from data collected from previously designed airfoils, was developed.
Second, a parametric 3D CAD model was created from which a 3D airfoil shape was successfully defined. Third, the entire airfoil generation process (RAF-3D) was automated. The process was successfully validated by recreating three existing airfoils by using RAF-3D process. Each airfoil’s performance was analyzed and compared to its reference using Computational Fluid Dynamics (CFD) and found acceptable. It should be noted here that at the start of this thesis, feasibility studies were performed on the various aspects of this project, for example creation of useful correlations and a simple yet robust 3D CAD model, to evaluate the probability of successfully achieving all targets.
This thesis is structured as follows. Chapter 1 summarizes the findings of relevant literature and previous works. Chapter 2 provides a detailed description of the methodology implemented, RAF-3D. Chapter 3 presents details of parameterized 3D CAD model construction. Chapter 4 summarizes the automation aspects of this work. Chapter 5 presents the results of the successful validation process.
Successfully achieving the objective of this thesis would allow for the methodology to be expanded to other airfoil types and thereby adding its benefits to, not only pre-detailed design phase. Furthermore, the time savings forecasted by this process will be significant.
CHAPTER 1 LITERATURE REVIEW
This chapter presents a detailed review of relevant previous work and literature. The first section provides a detailed summary of work done at P&WC in 2012 (RAF-I), which served as the foundation for the current work. In the following sections, a summary of other relevant past work is presented.
1.1 RAF-I
An important precursor to the project at hand (RAF-3D) is the work done by Karim Baioumy RAF-I (Baioumy and Vlasic, 2012). The outcome of Baioumy’s work, summarized in a P&WC internal report, was a direct input to RAF-3D. The outcome of his work and the associated findings, were carefully examined and in some cases modified to improve the quality of RAF generated airfoils. RAF-I mainly concentrated on generating a database of all design parameters available in the existing meanline design reports dating from 1985 to 2011. The intent was to observe any trends that might be useful for approximating certain design variables for a new design, and also to facilitate projection of the mid values from meanline to hub and tip of the airfoil (2012).
The tasks carried in RAF-I could be divided into two main categories: mid-section parameter prediction and hub and tip sections parameter extrapolation.
1.1.1 Mid-section parameter prediction
Baioumy concentrated primarily on generating an extensive database of aerodynamic parameters for P&WC`s previously designed airfoils. This step was essential to update some of the correlations (Kacker and Okapuu, 1982) relating certain airfoil geometric parameters to meanline predicted aero parameters.
One of the major challenges for defining a three dimensional airfoil from the one dimensional calculations of the meanline is the relative uncertainty of some of the parameters predicted by the meanline. Examples of these parameters would be throat opening and stagger angle. There are also parameters that are necessary for designing an airfoil but not available in the meanline output such as leading and trailing edge wedge angles. These parameters were also the focus of Baioumy`s work.
G.R. Gress (1979) developed an approximation for mid-section throat opening using data collected from previous designs. Baioumy collected meanline throat opening values dating back to the 1980s and plotted that against G. R. Gress approximation. By performing linear regression through the data, he came up with an offset value, which is applied to the approximation described above. It is important to point out that Baioumy focused on the “normal range” of throat opening values based on five previously designed P&WC uncooled HPT blades and his assumption of the offset value is an outcome of this. For other airfoil types, a study has to be performed to evaluate the validity of this offset value. Further details on throat approximation are presented in later chapters. Baioumy`s work has been validated by comparing the final design throat opening of five different high pressure turbine (HPT) blades (currently in service) to the proposed approximation. The test cases were selected from a pool of in-service P&WC airfoils designed within the last decade (to ensure capturing the latest design practices) and whose performances have materialized through engine test. The comparison resulted in a 10% error band, which considering the preliminary stage of design and the associated uncertainties on target throat openings is deemed acceptable.
Stagger angle is another parameter upon which Baioumy concentrated as this parameter is not well approximated to the degree necessary in the free-vortex meanline calculations. Baioumy has utilized the existing Kacker and Okapuu’s (1982) correlation between stagger and flow angles. In the original correlation, for given values of inlet and exit flow angles, the stagger angle could be found. Baioumy has updated the correlation by including data from more recent designs (1985 to 2011) and correlated inlet flow angle to stagger angle for specific ranges of exit flow angle. While reviewing this approach using the five test cases
7
described before, the hypothesis of lack of accuracy in this approximation was confirmed as the percentage error between final design stagger value and the proposed approximation ranged from 2 to 41%. The high error percentage was explained by the fact that his proposed correlations resulted from performing linear regression on data collected for all vanes (cooled and uncooled) and shrouded and unshrouded blades (high pressure and power turbines). In order to reduce the prediction error, data was modified to include HPT and PT blades only. The test cases were repeated with this modified correlation and the maximum error band in stagger angle prediction was reduced to 18%, from the original 41%.
Kacker and Okapuu’s (1982) meanline predictions also include a correlation between the ratio of airfoil maximum thickness to airfoil chord (tmax/C) and airfoil turning (the addition of the inlet and exit flow angles). Baioumy made an attempt to improve this correlation by tabulating more recent data (from 1982 onwards) for mid, hub and tip of the airfoil. The data has been divided into two main categories: shrouded and unshrouded airfoils (2012). This parameter (tmax/C) is one that is more often used for stress calculation purposes and was not used in RAF-3D calculations. However the collected data will be useful when expanding RAF-3D to cooled airfoils, for example, where maximum thickness is a key parameter to ensure a cooling insert can be passed through the airfoil core.
As mentioned before, certain important design parameters such as uncovered turning, leading edge wedge angle and trailing wedge angle are not predicted in the meanline. Baioumy made an attempt to come up with correlation for these parameters, but this attempt was not fruitful.
1.1.2 Hub and tip sections parameter extrapolation
As a part of data mining activity, Baioumy attempted to create correlations between existing mid-section hardware data and hub and tip sections as the meanline radial predictions cannot be used when it comes to hub and tip section geometric parameters. The data has been carefully examined as a part of this review to identify the best correlations to be used in RAF-3D.
Hub and tip throat openings have been predicted using the data available on previously designed uncooled HPT blades (Baioumy and Vlasic, 2012). Baioumy has plotted mid throat opening values against hub throat opening and has performed linear regression through the data to come up with a correlation that would extrapolate hub throat opening. A similar activity has been performed for tip throat opening and a separate correlation has been found. This approach has been used to predict hub and tip sections’ stagger angle, inlet and exit flow angles, and leading edge diameter (Baioumy and Vlasic, 2012). The resulting correlations have been validated using the five test cases described in previous section and the percentage error band was deemed acceptable for the preliminary nature of RAF-3D.
In order to estimate hub and tip section meridional chords, Baioumy used a different approach. He attempted to correlate mid meridional chord to that of hub and tip section through the use of cross sectional area. For this he extracted design section areas of several previously designed airfoils. The reason he adopted this approach rather than directly correlating meridional chords (as described above for other parameters), was to ensure that the resulting correlations capture the cone angle effect, since an aerodynamicist may often choose to design an airfoil on an angled section cut. The main flaw with the proposed approach is the fact that often, at the pre-detailed phase of a design activity, target area distributions may not be known, in which case the area dependant correlations cannot be used. An alternative approach to predict hub and tip meridional chords was then adopted for use in RAF-3D algorithm which will be described in a later chapter.
The work carried out in RAF-I (2012) provided a good database of previously designed P&WC airfoils and resulted in an improvement in some of the correlations, such as those for throat opening and stagger angle predictions with more recent data. The correlations developed in RAF-I that appeared to result in more accurate estimates, have been used in RAF-3D to predict certain parameters at hub, mid, and tip sections, which ultimately facilitates the 3D airfoil shape generation. As noted previously, there were other correlations that did not appear to be very accurate. As a sub activity of RAF-3D, further studies were
9
carried out to either improve the accuracy of these correlations or come up with alternative approaches to predict certain parameters with the aid of the database developed in RAF-I.
The following section presents a review of other relevant work.
1.2 Preliminary Parameter Prediction
Preliminary parameter prediction refers to the initial 1D or 2D parameter calculations that focus on predicting the flow parameters. Throughout the past decade there has been much work focusing on improving the accuracy of velocity triangles predicted through meanline calculations. As an example, Moroz, Govorushchenko and Pagur (2006) have attempted to carry out 1D flow analysis on a multistage turbomachine, consisting of turbine and compressor. Assuming one dimensional steady equilibrium adiabatic flow, an attempt has been made to solve the continuity equation, from which the velocity triangles for each stage are established (2006). In other research, Moroz, Govorushchenko and Pagur (2005) discuss the validity of the one, two and three dimensional analyses by initially creating a 3D airfoil shape by method of reverse engineering, in which using the chord, section area, inlet and outlet metal angles design section were obtained from the 2D calculations (as a three dimensional model of the airfoil was not available). The exit metal angles were then changed to provide the required mass flow rate for 3D aerodynamic analysis. They challenge the accuracy of the 1D, 2D and 3D aerodynamic computation results by comparing them to test data (2005). After a comparative analysis of the simulation results and experimental data, it was concluded that the accuracy of the simulation was acceptable. As expected, there are some differences noticed when comparing the 2D and 3D simulation results as 2D calculations do not capture the span wise flow interactions (as an example) and thus may result in a slightly different predicted performance (Moroz, Govoruschenko and Pagur, 2005). Otto and Wenzel (2010) have briefly described the Rolls Royce Deutschland automated compressor airfoil design process, which begins with obtaining the overall flow and the geometrical parameters with use of one-dimensional meanline calculations. Span
wise parameter distribution is then predicted with the aid of through-flow calculations, where the parameters are predicted for hub and tip.
The approach adopted by RAF-3D, which is discussed in detail in the following chapters, is similar to the reverse engineering approach adopted by Moroz Govorushchenko and Pagur (2005) for obtaining the 3D airfoil shape (from parameters such as metal angles, chord, etc), where a “baseline” airfoil model and meanline parameters coupled with database of previously designed airfoils are used to generate a preliminary airfoil shape.
1.3 Airfoil Generation
This section focuses on previous work done for generating a parameterized model and ultimately a 3D airfoil shape. Considering the limited number of parameters that could be obtained and/or predicted from the meanline, the parameterized model, used for preliminary airfoil design, needs to be as simple as possible yet rather flexible to result in acceptable curvature distributions on the pressure and suction surfaces of the airfoil. As Corral and Pastors (2004) have described in their work, blade parameterization could be divided into two main approaches. The aerodynamic surface could be defined as a series of points or by a set of curves. The first approach is very difficult to optimize as it involves modifying all surface points, and that is perhaps a contributing factor to the popularity of the latter approach. There have been many studies done on the effect of curvature distribution on airfoil Mach distribution and the associated losses. Corral and Pastors have named stagger angle and throat opening to be the parameters that could be varied in cases where changing curvature alone cannot achieve a smooth airfoil section (2004). This is an important point to consider when automating the preliminary airfoil design process. The possibility of modifying throat opening and stagger angle would then give RAF-3D more flexibility, after having updated all parameters associated with velocity triangles and those coupled to manufacturability constraints. Another assumption pointed out in this work is that suction and pressure surfaces are defined with three and two piece curves respectively, with an exception made for thinner airfoils where the pressure surface would consist of a three piece
11
curve (Corral and Pastors, 2004). This approach would result in five control points which, considering the preliminary nature of RAF-3D, might reduce flexibility of the model and introduce sudden variations in curvature distribution on airfoil surfaces. As mentioned before, the shape of an airfoil’s Mach number distribution is strongly related to smoothness of curvature distribution along its section. Li and al have carried out a study on the optimization of a transonic wing shape in a preliminary design environment. They address the issue that, when an aerodynamic shape goes through the optimizer to gain performance and the resulting shape is not as smooth as before, the calculated benefit may not eventually materialize (Li, Krist and Campbell, 2006). Perhaps by performing a high fidelity 3D CFD analysis, one could get a better understanding for how much of the performance improvement of this “non-smooth optimized surface” might be realized.
Anders et al. (2002) of BMW Rolls-Royce have published a paper on their construction of a parametric blade design system. In this work, the authors have come up with a system in which a 3D turbine or compressor blade is generated through two dimensional surface blade profile generation. The program introduced in this work is a rule based design system that adopts a parametric approach (Anders, Haarmeyer and Heukenkamp, 2002). Through the use of an in house code called AutoBlading, the authors have transformed the existing blades to one common representation in order to detect any possible correlations between parameters. This approach was used to come up with a standardized design approach for several compressors such as Trent500 and Trent800 HP compressor (2002, p. 12). This is very similar to the approach taken in RAF-I. One of the distinct advantages of the program presented by Anders et al. is the fact that they have minimized the use of B-splines, which were thought to overcome the surface smoothness problem (2002). Overusing B-splines for the purpose of airfoil shape definition will break the link between the very basic aerodynamic parameters and the final airfoil shape. This means that the final shape will be a function of spline tangencies as opposed to aerodynamic parameters. Some of the other features of this program consists of 3D stacking of the airfoil, suction and pressure surface curvature smoothness, airfoil thickness distribution, and airfoil cloning. Airfoil cloning is another BMW Rolls Royce in house code, where the knowledge from previous designs is carried
forward to a new upcoming design through the use of a database of all previously designed airfoils in a unique parameterized manner, allowing the user to load a baseline airfoil and update the meanline aero parameters (such as metal angles) through a GUI (Otto and Wenzel, 2010). The BMW Rolls Royce works presented above (Anders, Haarmeyer and Heukenkamp, 2002 and Otto and Wenzel, 2010) highly depend on previously designed airfoils, which might be a limiting factor for exploring new design spaces. Basing a new design on the proposed cycle and the resulting velocity triangles and using previous designs as a guideline might be a better approach.
In a work focusing on multidisciplinary optimization of an axial turbine, Moroz et al. (2004) have also adopted the approach of working on the basis of design sections creation and stacking them to get a 3D airfoil shape. Seven parameters such as relative pitch, incidence, flow exit angle and leading edge radius have been used for parameterization. An airfoil section profile is constructed using the Bezier curves for pressure and suction surface definition, in addition to metal angles, trailing edge thickness and chord. The sections are then leading edge (LE) or trailing edge (TE) stacked. In order to facilitate leaning or bowing of the airfoil, NURBS has been proposed as an alternative stacking method.
The importance of having smooth airfoil sections and 3D airfoil surfaces to achieve optimal performance has been highlighted in the above sections. Curvature smoothness and its strong effect on Mach number distribution were also discussed. Taking the importance of curvature distribution smoothness into account, a very good approach for airfoil section definition is the methodology proposed by Pritchard (1985). In his work, Pritchard notes the minimum parameters for defining an airfoil section followed by his approach for curvature definition. Similar to other works, Pritchard defines the airfoil as four distinct surfaces: suction, pressure, leading edge and trailing edge surfaces. What distinguishes his approach compared to others is the fact that the suction surface is defined as a two piece curve and pressure surface as a single piece curve (1985). This definition respects both geometry related points that have been emphasized throughout this literature review: CAD model simplicity and
13
flexibility. Consequently, the RAF-3D parameterized CAD model, aiming for maximum simplicity and flexibility, is based on Pritchard’s model
1.4 Automation & Integration
This section focuses on the automation aspect of an airfoil design process. Otto and Wenzel (2010), in an attempt to speed up and simplify the creation of existing Isight processes of Rolls Royce Deutschland, have adopted the example of the automated compressor airfoil design process.
The design process has been described in four simplified steps. First, the overall flow and the geometrical parameters are obtained with use of a one-dimensional meanline prediction. Span wise parameter distribution is then predicted with the aid of through-flow calculations. The 2D airfoil section design is then carried out using the flow angles obtained in the previous step and the 3D geometry is obtained by stacking these sections. In the last step, using 3D CFD, the lean and bow of the airfoil are optimized for the best performance. Once this process is done, surface generation is used to find the airfoil that meets all the set criteria. Airfoil sections are modified by altering the aerodynamics parameters through a Rolls Royce in house code called Parablading, which includes several other sub functionalities for meshing and interface with CAD based tools. Parameter modification is done based on a parameter distribution curve; this is to say that if the parameter distribution from hub to tip is a smooth one, the airfoil shape will most probably be smooth. This is especially true about metal angles, throat opening and stagger angle. Once the airfoil shape is finalized, a blade to blade solver, MISES, is used for every design section through which losses, Mach distribution, and velocity vectors could be better estimated. The program is also capable of performing preliminary stress analysis on the resulting airfoil. All of these sub-processes have been linked through the use of Isight optimizer (Otto and Wenzel, 2010).
The design system introduced by Anders et al. consists of the following modules: AutoBlading, Blade Profile Optimization, Parametric Blade Stacking, Radial Blade
Smoothing and interpolation, parametric CAD interface, and a parametric database (2002, p. 10). The authors have pointed out that to fully automate the final blade design process was “not a feasible objective” (2002, p. 25). Overall, the program introduced appears to be a good preliminary design tool with many advantages noted. This new process is said to be more user friendly, reduce design time, improve overall quality of design sections and increase process repeatability. One improvement that could perhaps be incorporated is to automatically update the aerodynamic parameters by using a graphical user interface that could read and/or calculate the necessary parameters obtained from 1D or 2D calculations. This would increase the accuracy by eliminating a source of human error and also reduce the required set up time. In another work, C. Xu and Amano (2002) have described their proposed optimum aerodynamic design process for turbine blades. This approach also begins with meanline analysis. Radial work distribution and gaspath definition are then found from a 2D axisymmetric through-flow analysis, which is a preliminary design module. Similar to the previous methods, the authors generate airfoil sections and a 3D airfoil shape by stacking the sections. The main difference between this work and the others previously discussed is the use of Navier-Stokes CFD for the purpose of 3D shape optimization. The authors have adopted the Balwin-Lomax turbulence model to optimize the lean, bow and sweep of the airfoil by the means of monitoring the changes in Mach distribution.
As seen from the above discussion, attempts have been made to automate the airfoil generation process through linking certain in house codes and CFD optimization. The ultimate vision for the airfoil module of the PMDO project of P&WC is to have a platform that links airfoil shape definition, CFD analysis, stress calculations and possibly an optimizer that would automate interactions involving aerodynamics and stress. As it will be explained in subsequent chapters, RAF-3D is an important step towards this goal in that it generates the first pass 3D airfoil shape in minutes using the turbine meanline as the primary source of information along with other sources of data and processes available to P&WC.
CHAPTER 2
RAPID AIRFOIL 3D (RAF-3D) APPROACH
This section presents a detailed description of proposed RAF-3D approach for constructing the first pass 3D uncooled HPT blade airfoil shape.
RAF-3D generates a preliminary 3D airfoil consisting of three design sections (hub, mid and tip) that respect all aerodynamic design considerations. RAF-3D has four main inputs:
1. Turbine Aero Mean Line (TAML);
2. a database of P&WC aerodynamic parameters pertaining to previously designed airfoils (and in the specific case of this work, uncooled high pressure turbine blades); 3. an existing airfoil as baseline;
4. some design best practices and guidelines.
As explained previously, TAML inputs and calculations govern some of the aerodynamic parameters at mid-section. The 1D meanline calculations are some of the most important inputs for RAF-3D.
As described in the literature review section, in the early stage of this work (RAF-I), a database of all design parameters available in the existing P&WC meanline and/or design reports dating from 1985 to 2011 was constructed. The intent was to observe any existing trends and predict some of the more critical mid-section parameters, such as throat opening, and compare with those predicted in the meanline calculations. This database was also used to create the mid to hub and tip correlations that are needed for predicting the hub and tip sections’ parameters.
An existing ‘baseline’ airfoil is used to predict the mid-to-hub and mid-to-tip ratios for parameters, such as meridional chord. In order to choose the appropriate airfoil, the engine
type (turboshaft, turboprop, etc), size, altitude, rim speeds and temperatures must be taken into account as these parameters will translate to stress requirements of the blade.
Some of the in-house aero design best practices are another input for RAF-3D, where parameters such as uncovered turning (Figure 2.7) are set to values based on these guidelines.
Once the parameters for three design sections are read, calculated and/or predicted, a fully parameterized 3D CAD model (constructed from the three design sections) is updated to generate the first pass 3D airfoil shape. A careful study of geometrical airfoil parameters was crucial for pinpointing the minimum number of parameters necessary at each airfoil section for defining a pre-detail three dimensional airfoil.
The minimum parameters necessary for defining each airfoil section in RAF-3D were found to be as follows:
• Airfoil count; • section radii; • cone angle;
• meridional chord (Bm); • leading edge diameter (LED); • trailing edge thickness (TET);
• leading edge metal angle (LEMA) referred to as “inlet blade angle” in Figure 2.2; • trailing edge metal angle (TEMA) referred to as “exit blade angle” in Figure 2.2; • leading edge wedge angle (LEWA);
• trailing edge wedge angle (TEWA); • stagger angle;
• throat opening;
17
Figure 2.1, Figure 2.2, and Figure 2.3 are visual representation of the key parameters listed above.
Figure 2.1 Cone angle definition
Figure 2.3 Airfoil geometry terminology (wedge angles and uncovered turning)
A 2D airfoil section CAD model was developed in order to validate whether the parameters noted above were indeed the minimum for defining an airfoil section, while providing flexibility. The chosen parameters were shown to be sufficient for controlling the airfoil section. Chapter 3 provides details on construction of this parameterized CAD model. A multi-surface sweep with three design sections will generate the preliminary 3D airfoil shape. The resulting airfoil will be evaluated to ensure it meets the stress and dynamics requirements.
In order to best summarize RAF-3D process of generating a 3D airfoil shape in the pre-detail environment, the process has been broken down to two steps: mid-section parameter prediction and hub and tip sections parameter extrapolation. Before exploring details of these steps however, all assumptions must be listed.
By carefully examining previously designed airfoils and using design best practices and guidelines, the following has been assumed:
19
1. All sections are designed with a zero cone-angle. This is an acceptable assumption as the gaspath of an uncooled HPT blade normally has a small flare at the hub and no flare at the tip. Consequently, designing with zero cone-angle throughout is desirable. Even if the gaspath is flared at the hub, to design with a cone angle or not is up to the aerodynamicist.
2. For all sections, incidence and deviation angles are assumed constant as per P&WC in-house design best practices. This assumption must be revisited when expanding RAF-3D approach for other airfoil types.
3. Per P&WC airfoil design guidelines, TEWA for mid-section of a typical uncooled HPT blade is set to a recommended value. Reviewing the data collected on previously designed airfoils (RAF-I) revealed a small span wise variation in TEWA of uncooled HPT blades in some cases. Consequently, TEWA is assumed to be constant from hub to tip for RAF-3D approach.
4. Baioumy made an attempt to come up with a correlation for predicting LEWA as a part of RAF-I activities. This attempt was not fruitful, however. As LEWA is a key parameter for defining airfoil section shape, RAF-3D assumes LEWA for each design section equal to that of the existing ‘baseline’ airfoil. This is used just as a first guess, as it (among a few other parameters) may be varied to achieve the area requirements.
2.1 Mid-section Parameter Prediction
TAML is one of the main sources of information for RAF-3D. It contains inputs for each section and global parameters such as airfoil count and gaspath corner points. Focusing the attention on mid-section parameter prediction, apart from the parameters that are assumed constant (see previous section), the following parameters at mid-section are read from TAML inputs: mid-section radii, axial chord (Bx), leading edge diameter (LED), trailing thickness (TET), and leading and trailing edge gas angles.
If the analyst chooses to design on a cone angles, the meridional chord (Bm) is calculated thusly:
= ( ) (2.1)
As cone angle is assumed to be zero for all sections, Bm at mid-section is equal to Bx at that section, which is obtained from TAML.
Incidence and deviation are also assumed constant for all design sections as bper design guidelines and best practice for uncooled HPT blades. With this assumption and extracting inlet and exit flow angles at mid-section from turbine meanline, LEMA and TEMA can also be calculated:
LEMA @ = [Inlet Flow Angle (from TAML)@ ] – [incidence] (2.2)
Similarly,
TEMA @ = [Exit Flow Angle (from TAML)@ ] + [Deviation] (2.3)
For the mid-section parameters listed thus far, TAML has been the primary source of information. There are some parameters for airfoil shape definition for which there is a need for a database of P&WC aerodynamic parameters pertaining to previously designed airfoils such as throat opening, stagger angle and uncovered turning.
As described earlier, RAF-I has improved the accuracy of mid-section throat estimation. Original TAML throat opening approximation developed by Kacker and Okapuu for mid-section of the airfoil is listed below (Kacker and Okapuu, 1982):
21
τ = 1/K1 ∗ (2 ∗ π ∗ R/n – K2 ∗ TET) ∗ cos (α out) (2.4)
Where:
τ = Throat opening ; R = Section radius; n = Number of airfoils;
TET = Trailing edge thickness; α out = Exit flow angle;
K1 = 0.92; K2 = 2.50.
Data collected on throat opening values dating back to the 1980s were plotted in Figure 2.4 against this approximation. By performing linear regression through the data, an offset trend was noticed, in which throat area approximated in TAML appeared to be more open than the approximation. Observing this trend, RAF-3D modified this approximation by applying an offset value to the original equation.
As pointed out before, in order to evaluate the accuracy of this approach, five test cases from previous high pressure turbine blade designs were carried out. In these cases throat openings were estimated using RAF-3D. These values were then compared to the final design values at the mid and a percentage error was calculated. The largest error was 10%. A modest restagger of the blade, to achieve the ultimate target throat opening, is estimated not to adversely affect the airfoil shape enough to invalidate either the aerodynamics acceptability or structural and stress conclusions at the preliminary design phase.
Figure 2.4 In-house mid-section throat approximation
Stagger angle, influenced strongly by camber and airfoil count, is another important parameter needed during the airfoil design process. It is not only of high significance from an aerodynamics point of view, but also from a vibratory stress perspective. Additionally, stagger angle could also be used for decreasing or increasing the cross sectional area to achieve the target area distribution. This parameter is currently not well approximated in the free-vortex meanline calculations. In an attempt to improve the accuracy of stagger prediction at mid-section, the existing Kacker and Okapuu’s (1982) correlation between stagger and flow angle has been used and updated with the latest P&WC designed airfoils. In the original correlation, for given values of inlet and exit flow angles, the stagger angle could be found. RAF-3D (modified Baioumy and Vlasic’s (2012)) however has explored the possibility of correlating inlet flow angle to stagger angle for specific ranges of exit flow angle. This approach was evaluated by comparing the RAF-3D estimated stagger angles of five test cases to the actual final design stagger angles. Even though the approach proposed here did not appear to have increased the accuracy of the existing Kacker and Okapuu’s correlation, it is still a better option as it includes the latest P&WC designs. Figures 2.5 and 2.6 are representations of Kacker and Okapuu’s and RAF-3D stagger prediction.
23
Figure 2.5 Kacker & Okapuu stagger prediction for a typical turbine blade section (1982)
Figure 2.6 RAF-3D stagger prediction for HPT blade mid-section
Uncovered turning is the last parameter necessary for defining an airfoil section in RAF-3D. This parameter is not estimated in the meanline. Therefore, industrial experience and in-house design best practices for uncovered turning have been determined based on the airfoil exit Mach number (Figure 2.7).
Figure 2.7 Uncovered turning criterion
2.2 Hub and Tip Sections Parameter Extrapolation
Up to this point, the details of mid-section parameters in RAF-3D have been discussed. However as mentioned before, the meanline cannot be used to the same extent when it comes to hub and tip parameter prediction due to the free vortex assumptions made in the meanline calculations. Hub and tip sections parameters prediction can be categorized into four groups:
1. Parameters that are read from meanline (hub and tip design sections or corner points); 2. parameters that have been assumed as constant (discussed earlier);
3. parameters that are scaled using an existing final design airfoil as baseline, ; 4. parameters that are predicted using correlations found from the database.
Meridional chord, LED and TET for hub and tip sections are predicted by scaling an existing airfoil as the baseline. Below is RAF-3D formulation for calculating meridional chord for hub and tip sections.
25
Hub meridional chord:
( ) = (( )) (2.5)
( ) = ( ) ∗ ( ) (2.6)
Tip meridional chord:
( ) = ( ) (2.7)
= ( ) ∗ ( ) (2.8)
LED and TET at hub and tip sections are also calculated similarly. Furthermore, a minimum allowable TET value is imposed to ensure manufacturability of the airfoil trailing edge. Leading and trailing edge metal angles for hub and tip sections are calculated in a similar manner to that of the mid-section with the difference being that inlet and exit flow angles for hub and tip are not read directly from the meanline. Inlet and exit flow angles for hub and tip are calculated through correlations with respect to mid inlet and exit flow angles found through linear regression of the data in the RAF-3D database. P&WC designed airfoils data were gathered and was carefully segregated in appropriate groups (based on airfoil types) in order to pinpoint any existing trends. Correlations relating mid section inlet and exit flow angles to that at hub and tip sections are shown below:
Hub section: ( ) = ∗ ( ) + (2.9) ( ) = ∗ ( ) + (2.10) Tip section : = ∗ ( ) + (2.11) = ∗ ( ) + ℎ (2.12)
Having predicted the inlet and exit flow angles at the hub and tip, and assuming incidence and deviation angles as discussed earlier, hub and tip LEMA’s and TEMA’s can be calculated. RAF-3D predicts hub and tip sections’ stagger angle and throat opening similar to the approach used for inlet and exit flow angles.
Uncovered Turning for hub and tip is set to the upper limit value according to the corresponding exit Mach number, which is found in meanline output.
Table 1 is a summary of the parameters used to parameterize the airfoil section CAD model and a brief description of the source of the values assigned to each parameter.
27
Table 2.1 RAF-3D concept airfoil parameter origin
Concept Airfoil Parameters
Parameters MID HUB & Tip
Airfoil count TAML TAML
Inlet radius TAML TAML
Exit radius TAML TAML
Design section radius Calculation Calculation Cone angle Constant = 0 Constant = 0 Meridional chord TAML Baseline design ratio
LED TAML Baseline design ratio TET TAML Baseline design ratio Stagger angle Correlation Correlation (w.r.t mid)
LEMA Calculation Calculation TEMA Calculation Calculation
Incidence BP BP
Deviation BP BP
Inlet flow angle TAML Correlation (w.r.t mid) Exit flow angle TAML Correlation (w.r.t mid) Throat opening Correlation Correlation (w.r.t mid)
Uncovered turning BP BP
LEWA 1st guess baseline 1st guess baseline
CHAPTER 3
3D AIRFOIL SHAPE GENERATION
As mentioned earlier, a parameterized 2D airfoil section CAD model was developed in order to visually inspect the outcome of RAF-3D parameter prediction. This 2D section model was used to generate a 3D airfoil by CG (center of gravity) stacking the 2D hub, mid and tip sections and then sweeping a surface from hub to tip using multi-section surface with guide curves.
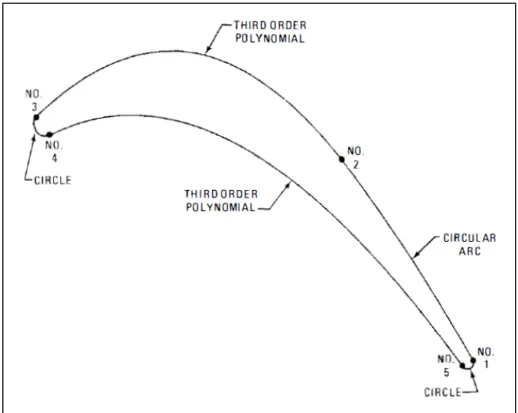
The 2D airfoil section was generated based on a modified RATD (Rapid Axial Turbine Design) algorithm presented by Pritchard in 1985 (Pritchard,1985). Figure 3.1 and Figure 3.2 depicts the high level image of the parameterized 2D airfoil section for RAF-3D.
Figure 3.2 Basics of RAF-3D points and curve definition for 2D airfoil section (Pritchard,1985)
As seen in Figure 3.2, the smoothness of pressure and suction curves for each section are controlled by defining three spline tension values on each curve (suction and pressure curves 1-2, 2-3, and 4-5). An extensive study was performed on five test cases for all three design sections (hub, mid and tip) to come up with the default spline tension values for suction and pressure sides. These default values are very likely to generate a smooth airfoil section, but the analyst has the opportunity of modifying these values should it be necessary, for example, to achieve a target metal area at a given design section. The smoothness of resulting design sections are important as these three sections are used to loft four surfaces (leading edge, suction, pressure and trailing edge surfaces) that will generate the resulting three dimensional airfoil shape. Any abrupt changes in curvature of even one section will directly translate to an uneven airfoil surface.
In addition to rigorous parameterization of airfoil sections, the RAF-3D CAD model developed has several unique features, some of which will be highlighted here. Due to
31
complex stress criteria for uncooled high pressure turbine blades, these airfoils often have an internal pocket to improve stress and lifing, in addition to lowering blade weight. The RAF-3D CAD model has this built-in pocket definition feature that can easily be activated or deactivated as the analyst sees fit. An airfoil cavity was defined by five parameterized sections constructed by defining wall thickness, leading and trailing edge diameter, as well as section radii. The airfoil cavity sections are created by offsetting the external surfaces. Figure 3.3 is a visual representation of pocket definition in RAF-3D.
Figure 3.3 Parameterized airfoil pocket
As pointed out before, the first pass airfoil shape is CG stacked by default. Typically, this is done by finding the CG of each design section and passing a spline through the CG of each section. In case of airfoils with a cavity however, this approach is not applicable (for airfoils with cavities with depth ratio of larger than 50%, this methodology would result in a skewed airfoil shape due to sudden change in airfoil net metal area just below the airfoil cavity). In order to ensure airfoil surface smoothness in all cases, a new CG stacking approach was defined for airfoils with a cavity. In this case, the CG of each airfoil section (hub, mid and tip) is found as described for airfoils with no pocket (black line in Figure 3.5). In addition, the airfoil is cut into three span wise solids of identical height and the three-dimensional center of gravity of each solid is measured separately (red line in Figure 3.5). The 3D CG of each solid is then shifted tangentially to coincide with the respective section cut CG. This
methodology resulted in a smooth CG spline and smooth airfoil shapes for blades that have a cavity. The images below depict the approach described above.
Figure 3.4 Stacking for airfoils with cavity
Figure 3.5 Corrected stacking for airfoils with cavity
After defining the first pass airfoil shape, changes often need to be made to cater for stress and dynamics issues that arise. One of the quickest and most effective ways to resolve stress or dynamics issues is to modify the stacking of the airfoil by leaning or shifting each section as necessary. The ultimate goal of this project is to define a first pass airfoil shape that respects aerodynamics, stress and dynamics requirements and with this in mind, it was
33
necessary to incorporate parameters in the parameterized CAD model that would allow user defined stacking. Consequently, the capability to independently axially shift and/or to tangentially rotate each design section has been incorporated in RAF-3D CAD model. Figure 3.6 is a visual representation of this feature.
Figure 3.6 CAD model restacking capability
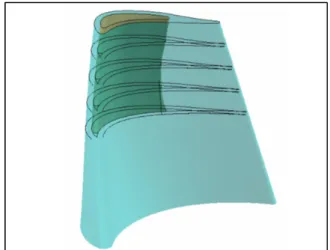
Another important feature that is built into the RAF-3D CAD model is the capability to extend the airfoil at both hub and tip since an important criterion for performing CFD analyses is that the airfoil intersects the gaspath. While testing the CAD model it was noticed that, for the test cases performed, the CAD program was unable to extend the airfoil with the default extension option available in the CAD package. This is because all test case airfoil were highly twisted from hub to tip which was resulting in airfoil surfaces crossing in the extended airfoil sections. In order to overcome this issue, the CAD program would require more guidance for extending the airfoil shape. This was done by first making a copy of the tip section and placing it at the radius to which the airfoil was to be extended (red airfoil section in Figure 3.7). This airfoil section is then rotated through an extrapolation of the airfoil section at that given radii (blue airfoil section in Figure 3.7). Finally, the axial chord of the airfoil section is scaled down to keep leading and trailing edge surfaces smooth before and after the extension. The same approach is applied for extending the root of the airfoil.
Figure 3.7 CAD Model Extension Capability
3.1 Area Matching Parameters
RAF-3D generated airfoils will need to be analyzed for stress and lifing. These analyses often reveal that the first pass airfoil might need minor tweaks to resolve high stress issues, for example. Often this can not be achieved by restacking the airfoil alone, and changes in airfoil section metal area are needed to resolve major stress issues. If this is the case, it is important to be able to change section area by using aerodynamic parameters in a manner that will have the minimum impact on the aerodynamic characteristics of the airfoil. As per previous design experience, here’s a list of parameters in the recommended order that should be varied to change airfoil section area:
1. PS curvature; 2. LEWA; 3. LED;
4. Meridional Chord; 5. TEWA.
35
CHAPTER 4
AUTOMATION AND PROGRAMMING
The proposed RAF-3D approach has been described above in details. This methodology is a significant improvement in comparison to the current preliminary airfoil shape definition process. In order for the time-saving benefits of RAF-3D process to materialize, the automation of the described procedure is necessary. In order to simplify the coding aspect of this project and, more importantly, in order to ensure that the code is as simple and concise as possible, RAF-3D can be broken down into four main functions that can be accessed through a Graphical User Interface.
The four main functions are:
1. Read and store baseline database information; 2. Read and store TAML output data;
3. Calculate final airfoil section parameters;
4. Update CAD model with airfoil section parameters.
Figure 4.1 RAF-3D overall process
4.1 Read and store baseline database information
This function first prompts the user to locate the desired database file, then reads the database file, and asks the user to choose from a list of reference airfoils identified in the database file. Once the user selects the appropriate reference airfoil, the associated design parameters are imported from the file in the form of structured data. The data are then used to calculate several additional parameters determined solely from the database parameters which are also required later in the RAF design process. All pertinent data are saved to parameter place holders in the unique data structure associated with the program.
The method used to locate each required parameter in the structured data allows future database structural changes without necessarily requiring revision to this importing function. This is because the function finds each parameter by triangulating it using the row and column headings rather than fixed coordinates. This allows the data table to be anywhere within the excel sheet, the rows and columns to be rearranged in any order, and for the
37
addition of any number of additional rows or columns whether or not they contain data. The function need only be updated if the column and row headers are revised. Figure 4.2 illustrates this flexible functionality.
Figure 4.2 Traiangulation of database parameters
4.2 Read and store TAML output data
The TAML reader function was one of the most challenging functions to program because the file structure regularly evolves, the number of sections differs depending on the number of stages in the engine, and the text file is structured to ease readability for the user rather than to ease processing by automated tools
Similar to the database reader, this function starts by prompting the user for the location of the TAML output file to be read. The function then steps through each section of the TAML file identified by key section header text and extracts only needed data from each section. The function is able to identify how many stages there are in the file and step through the TAML output file accordingly. All parameters including those from each individual stage are imported. The data is then used to calculate several additional parameters which are required later in the RAF design process determined solely from TAML output file parameters. All pertinent data are saved in parameter place holders in the unique data structure associated with the program.
The user is prompted to select the appropriate airfoil, which in case of this work would be an HPT uncooled blade.
Because the TAML output file structure may vary depending on the number of stages in the design, the function uses the number of stages parameter to identify the limit of stages to expect in the file. This ensures that the reader does not get lost looking for stage data that does not exist in the file.
This function also takes advantage of the user readability of the TAML output file. User readability ensures that the file will be structured such that many parameters are arranged in a matrix format. The function identifies the relevant column header text and looks beneath it to find the parameter value or text to be imported. This approach makes the function tolerant of added data and lines in future revisions of the TAML output file format. The approach taken also makes the function tolerant of entirely new sections that could be added to the TAML output files in the future. Another feature of the function is that it is tolerant of any offset in parameter alignment with respect to the key text used to locate the parameter as it reads several characters wider than the expected parameter position and trims blank space from either end before converting the text to numerical format. The most notable features of the function is that the code is structured and thoroughly commented to facilitate rapid understanding and expanding the function to read additional parameters which is done by copy and paste of only a single line to add the parameter to the data structure and second single line to find and import the data to the data structure.
4.3 Calculate final airfoil section parameters
The function of calculating the final airfoil section parameters is the core of the algorithm. Here all necessary calculations (correlations, etc) to get RAF-3D design parameters (as described in chapter 2) are performed on the imported information from the airfoil database and TAML output taken from the structured data arrays.
39
4.4 Updating CAD model with airfoil section parameters
The parameters that have been calculated in the algorithm are passed through a gateway program, which deals with execution control and data transfer, to pass all parameter values to CAD software. A function then assigns these values to the respective parameters in CAD model and generates an updated 3D airfoil shape.
A preliminary graphical user interface has been generated, which requires the user to load a TAML output file, and select an appropriate reference airfoil. Once the RAF-3D process has been completed, the interface displays the airfoil parameters by section and a 3D view of the airfoil allowing the user to rotate, pan, and zoom. As pointed out in chapter 3, the user also has the ability to change certain parameters that may impact area distribution with minimal impact on aerodynamic characteristics of the airfoil.
Figure 4.3 illustrates the RAF-3D sequence that is executed using the GUI.
41
CHAPTER 5 VALIDATION
Validation plays an integral part in the assessment of any new process. As described earlier, RAF-3D consists of different elements which have been tested individually. For example, the parameterized RAF-3D CAD model was tested extensively to ensure model robustness. In order to ensure that any potential RAF-3D related issues are segregated from CAD model robustness issues, the CAD model was first tested by using five previously designed airfoils. As these airfoils are successful final designs, this ensured that there are no conflicting parameters causing the CAD model to fail when updating the 3D airfoil shape. This approach was a great help in ironing out some of the CAD model issues (such as airfoil hub and tip extension) by adding additional constraints where needed or resolving any conflicting constraints. Once these five test cases were completed successfully, validation of the CAD model was continued with additional test cases where airfoil parameters were predicted by RAF-3D. Some features that were greatly improved as a result of extensive testing were airfoil pocket definition, airfoil stacking and hub and tip airfoil extensions. Also, as explained before, the correlations developed were validated by comparing resulting parameters from RAF-3D to the final design (already in service) values and then by visually inspecting the resulting airfoil sections and 3D airfoil shape.
RAF-3D methodology has been used to create a preliminary airfoil shape. The resulting airfoil shapes’ performance have been compared, through Computational Fluid Dynamics (CFD), to their respective final airfoil designs at P&WC that are already in service. Steady-state turbine flowfields were predicted using the 3D, Reynolds-Averaged Navier-Stokes (RANS) code descried both by Ni (1999) and Davis et al. (1996). Numerical closure for turbulent flow was obtained via the k-ω turbulence model, Wilcox (1998). The in-house 3D RANS CFD code described has been validated with different Pratt and Whitney turbine test data (Pratt and Whitney internal documents). An O-H grid mesh topology was employed for
all simulations, and approximately 550,000 grid points per passage were used for three-dimensional simulations. The viscous-grid provided near-surface values of y+ less than 1 for all no-slip boundaries and gave approximately 7 grid points per momentum thickness in airfoil and endwall boundary layers. All walls were adiabatic and rotational.
In the CFD steady-state stage analysis, the vane and blade sectors of each stage were coupled by a mixing plane. All simulations were performed at engine representative conditions for each high-pressure transonic turbine stages. The mainstream inlet boundary conditions were provided from the combustor exit while the mainstream exit boundary conditions were provided from a multi-stage CFD simulation that included the downstream stage. The mainstream inlet boundary conditions were specified as circumferentially averaged radial profiles of absolute total pressure, absolute total temperature and absolute flow angles while the mainstream exit boundary condition was specified as a circumferentially averaged radial profile of static pressure. The latter boundary condition accounts for the downstream stage effect.
Of the five test cases noted previously, three of the most recent were selected to test RAF-3D. These test cases will herein be referred to as test cases I, II and III. For each test case, a TAML output was used in conjunction with assumptions, the airfoil database, correlations, and calculations described previously to generate RAF-3D airfoil shapes.
It must be noted that the following test cases assume a redesign of the high pressure turbine blade only, where the upstream high pressure turbine vane was not changed. As the concept HPT blade and the final design HPT blade have the same HPT vane upstream, it is necessary to ensure that RAF-3D airfoil results in the same HPT stage reaction. The stage reaction requirement (a meanline input) was verified by performing Euler CFD and restagger was applied to the RAF-3D airfoil where necessary. The concept airfoils’ stage reaction was matched to the respective final design airfoil.