UNIVERSITÉ DE MONTRÉAL
STUDY OF HUMAN CORTICAL MICROSTRUCTURE USING MAGNETIZATION TRANSFER AND T2* MAPPING WITH APPLICATION IN MULTIPLE SCLEROSIS
GABRIEL MANGEAT
INSTITUT DE GÉNIE BIOMÉDICAL ÉCOLE POLYTECHNIQUE DE MONTRÉAL
MÉMOIRE PRÉSENTÉ EN VUE DE L’OBTENTION DU DIPLÔME DE MAÎTRISE ÈS SCIENCES APPLIQUÉES
(GÉNIE BIOMÉDICAL) AVRIL 2016
UNIVERSITÉ DE MONTRÉAL
ÉCOLE POLYTECHNIQUE DE MONTRÉAL
Ce mémoire est intitulé:
STUDY OF HUMAN CORTICAL MICROSTRUCTURE USING MAGNETIZATION TRANSFER AND T2* MAPPING WITH APPLICATION IN MULTIPLE SCLEROSIS
présenté par: MANGEAT Gabriel
en vue de l’obtention du diplôme de : Maîtrise ès sciences appliquées a été dûment accepté par le jury d’examen constitué de :
M. STIKOV Nikola, Ph. D., président
M. COHEN-ADAD Julien, Ph. D., membre et directeur de recherche
Mme MAINERO Caterina, M. D., Ph. D., membre et codirectrice de recherche M. BELLEC Pierre, Ph. D., membre
DEDICATION
ACKNOWLEDGEMENTS
First of all, I would like to thank my research supervisor Julien Cohen-Adad and co-supervisor Caterina Mainero. I have been realizing many times how lucky I was to have them as directors. Julien has a very appreciated perspective of work in research. He knows that the productivity of his students comes from their personal motivation and thus does a lot to make them love their work (schedule flexibility, research topic flexibility, encouraging to publish and participate to conferences, and so on). Caterina has an admirable sense of finding the pertinent questions to work on and the points to deepen. Her welcoming open-mindedness made it very agreeable to work with her. They both have a considerable experience in their field of research, which permitted me to learn how to conduct a research project in biomedical sciences. During these two years of master, they knew how to listen to me, discuss my problems, congrats me and assist me when needed. I feel to have significantly widen my knowledges and experience thanks to them. I would like to acknowledge Nikola Stikov and Pierre Bellec, whom with it is always enjoyable to discuss various research ideas and who accepted to be part of the jury.
I thank my colleagues at NeuroPoly, Benjamin De Leener, Tanguy Duval, Ryan Topfer, Sarah Dupont, Simon Levy, Ariane Saliani, Grégoire Germain, Alexandru Foias, Nibardo Lopez Rios, Arul Venugopal, Manh-Tung Vuong and all the others, as well as Yves Goussard and Corentin Friedrich whom with I shared and I share an enjoyable and humorous everyday life at work. I wish not to forget all people who have left NeuroPoly at this day and whom with I had great work (and non-work) times.
Many thanks to my colleagues and collaborators at the Martinos Center, particularly Sindhuja Govindarajan, whom with I have started to collaborate more that 3 years ago, Elena Herranz, who experienced with me all the “beginner steps” of the Martinos, Céline Louapre, who namely explained me how to operate an MRI scanner, and many details about MS, Andrada Treaba, Costanza Gianni and Christian Langkammer whom with I had the chance to share research topics, of course, Tobias Granberg and Russell Ouellette, who maintain a gainful motivation to work and whom I really enjoy to share some projects. As well as my Lab-mates Nicolo Fuin, Reza Atefi, Stefano Pedemonte, David Izquierdo, Wei Tang and others. All these person went with me during my first steps in clinical research and significantly contributed to the experience I have acquired today.
I also want to thank some friends, namely Maël Richard, who never hesitated to explain me many medical details and who enjoyed to speak about my research project, as well as Gaëlle Seret and Jérémie Pilon whom with I discussed about some statistical issues.
My thanks are certainly going to my family, Johanna, Aline, Thomas, Frédérique and Frédéric who have been supporting me to continue my projects even though it implied to live 6000km away from them. Finally, my girlfriend Blanche Normand merits a special acknowledgement for supporting me before various deadlines, namely, the last two weeks. Finally, I want to thanks the MEDITIS program (NSERC), the QBIN fellow program and the NeuroPoly laboratory for financial support.
RÉSUMÉ
Description du problème: La sclérose en plaques (SEP) est une maladie dévastatrice touchant plus de 100.000 personnes au Canada (MS Society of Canada). Les déficits fonctionnels engendrés par la maladie peuvent se traduire en troubles moteurs, cognitifs et sensoriels ayant un grand impact sur les activités sociales et professionnelles des patients. Le coût socio-économique de la SEP est colossal. Premièrement, la qualité de vie des patients ainsi que celle de leur familles peut se voir considérablement altérée. Deuxièmement, les traitements diminuant les effets handicapant de la SEP sont extrêmement dispendieux, leur coût annuel est estimé à plusieurs milliards de dollars au Canada (Karampampa et al. 2012) ainsi qu’aux USA (Hartung et al. 2015). De nos jours, la SEP ne se soigne pas et les détails de sa pathophysiologie restent obscures.
La SEP est une maladie du système nerveux central, chronique, inflammatoire et démyélinisante. Elle est caractérisé par la formation de lésions inflammatoires et démyélinisantes prenant place dans la moelle épinière et dans les matières blanche et grise du cerveau.
Bien que l’Imagerie par Résonance Magnétique (IRM) soit resté l’outil principal de diagnostic de SEP, les lésions observées dans la matière blanche ne corrélaient que très peu avec les déficits fonctionnels observés. Récemment, il à été montré que la démyélinisation de la matière grise est un meilleur indice de l’aggravement fonctionnel (Mainero et al. 2015). Cependant, les techniques d’IRM classiques sont difficilement utilisables pour l’imagerie du cortex, en effet, son épaisseur est seulement 2 à 4 mm et la résolution spatiale d'une IRM standard est de l’ordre de grandeur de 1 mm, ce qui n’est pas suffisant pour examiner précisément la pathologies corticales.
L’IRM à ultra-haut champ (7 Tesla) à été montré capable d’imager des détails microstructurels du cortex, grâce à un gain en résolution et en signal sur bruit. Récamment, il a été montré que la relaxation transverse (apellée T2*) acquise à 7 Tesla est un marqueur sensible de la progression de la pathologie corticale des patients polyscléreux, notamment, de la démyélinisation corticale (Pitt et al. 2010; Mainero et al. 2015; Cohen-Adad et al. 2011). Cependant, des effets confondants réduisent la spécificité qu’a le contraste T2* à quantifier la myéline (notamment, le contenu en fer, ou les vaisseaux sanguins) (Hwang et al. 2010; Lee et al. 2012). Une seconde mesure indépendante serait bénéfique pour augmenter la spécificité d’une potentielle estimation de quantitée de myéline. Le Ratio de Transfert de Magnétisation (MTR) à aussi été démontré sensible à la myéline dans le cortex (Derakhshan et al. 2014; Chen et al. 2013) et serait une excellent mesure
complémentaire car ses principes physiques sont différents de ceux de T2*. Mentionnons qu’il n’est pas facile d’imager T2* et MTR dans le cortex car le cortex est fin, très convolué et sa géométrie varie beaucoup entre individus.
Objectifs: Le premier objectif de cette étude est de combiner MTR et T2* en utilisant des statistiques multivariées, dans le but d’augmenter la spécificité, de l’imagerie de myéline. Le deuxiéme objectif est d’évaluer les bénéfices d’une telle combinaison pour l’étude de la pathologie corticale de patients polyscléreux.
Méthode: Des sujets sains (témoins) et des patients polyscléreux ont été scannés à 7 Tesla et à 3 Tesla pour acquérire les données T2* et MTR respectivement. Un modèle multivarié d’estimation de myéline à été développé et consiste à (i) normaliser les données T2* et MTR (ii) extraire le signal commun aux deux contrastes en utilisant une analyse en composantes indépendantes (ICA). La dépendence à l’orientation du champ B0 et l’épaisseur corticales ont aussi été calculé et incluses dans le modèle. Une comparaison avec des précédents résultats histologiques et des simulations ont permis de valider le gain obtenu en utilisant les métriques combinées. Un modéle Linéaire Général (GLM) à été utilisé pour évaluer les différences entre patients vs sujets témoins. L’âge, le genre et l’épaisseur corticale moyenne furent inclus comme régresseurs dans le GLM. Des estimations de la spécificité et sensibilité ont été faites sur certaines régions du cortex en utilisant des courbes ROC. Finalement, une étude laminaire de la pathologie diffuse fut conduite en utilisant des coupes à différendes profondeurs du cortex.
Résultats: De fortes corrélations ont été observées entre MTR et T2*, dans le cortex entier (r = 0.76, p = 10−16), suggérant que les deux métriques soit en partie influancées par la même source de contraste, supposée étant la myéline. Les valeurs moyennes du MTR et T2* dans le cortex sont respectivements de 31.0 +/− 0.3% et 32.1 +/− 1.4 ms. La carte de myéline résultant de la combinaison a montré une tendance similaire aux travaux histologiques de quantification de myéline (r = 0.77, p = 0.01). Des différences significatives inter hémisphères ont été détéctées dans le cortex moteur primaire, le cortex posterieur singulier et le cortex visuel (p=0.05). Les GLM ont révélés des régions de démyélinisation significatives dans les cortexes moteurs, visuels, auditifs et somato-sensoriels (p<0.05). Ces différences se sont montrées statistiquement significatives quand les cartes de myélines combinées étaient utilisées, alors qu’aucune différence significative ne fut détectée en utilisant les autres métriques seules (c.à.d MTR et T2*). De plus, les cartes
combinées ont été montrées capables de révéler des aires de démyélinisation dans les cortexes de jeunes patients polyscléreux (diagnostiqués in y a moins de 3 ans).
Discussion: Cette étude à démontré que les modalitées MTR et T2* sont fortement corrélées dans le cortex. La combinaison de MTR, T2*, épaisseur corticale orientation par rapport à B0 est un moyen efficace pour étudier la myélo-architecture corticale avec plus de spécificité qu’en utilisant seulement T2* ou MTR. Ceci fournit un outil puissant pour l’étude des fines variations de myéline survenant dans le cortex des patients polyscléreux. Les premières applications de la méthode supportent le fait que la démyélinisation corticale est un évènement survenant tôt dans la sclérose en plaques, même en présence d’un handicap neurologique léger.
Impacte: La quantification non-invasive de la pathologie corticale de la SEP est la pièce manquante du puzzle pathophysiologie de la SEP. Comprendre les liens entre la pathologie de la matière blanche, la pathologie de la matière grise et les déficits fonctionnels peut i) aider à comprendre des détails fins des mécanismes de la SEP ii) aider à concevoir et cibler des futures traitements.
ABSTRACT
Problem description: Multiple Sclerosis (MS) is a devastating disease affecting around 100,000 people in Canada (MS Society of Canada). The functional deficits resulting from the disease include motor, cognitive and somatic troubles, affecting the social and professional activities of MS patients. The socio-economic cost of MS is colossal. Firstly, life quality of MS patients and those of their family members can be drastically hampered. Secondly, existing treatments that reduce handicapping effects of MS are expensive, with an annual cost estimated in billions of dollars in Canada (Karampampa et al. 2012) and in the USA (Hartung et al. 2015). To date, MS is not curable and its pathophysiological mechanisms are still obscure.
MS is known to be a chronic, inflammatory, demyelinating disease of the central nervous system. It is characterized by the formation of inflammatory and demyelinating lesions in the spinal cord and in the brain’s white and gray matters.
While Magnetic Resonance Imaging (MRI) has been the main tool for diagnosing MS, correlations of white matter lesions with functional deficits remain poor. Recently, it was shown that grey matter demyelination provides a more specific assessment of functional worsening
(Mainero et al. 2015). However, it is difficult to image the grey matter with standard MRI methods because the cortex is only 2-4 mm thick and the spatial resolution of standard MRI system is on the order of 1 mm, which is not sufficient for proper examination of cortical pathology.
Ultra-high field MRI (7 Tesla) was shown to reveal microstructural features thanks to an increase in signal to noise ratio and spatial resolution. Recently, transverse relaxation (characterized by a time constant: T2*) at 7 Tesla was shown to be a sensitive marker of pathology and disease progression associated with demyelination in the cortex of MS patients (Pitt et al. 2010; Mainero et al. 2015; Cohen-Adad et al. 2011). However, several confounds hamper the specificity of T2* measures (iron content, blood vessels) (Hwang et al. 2010; Lee et al. 2012). An independent measure would increase the specificity to the myelin content. Magnetization Transfer Ratio (MTR) imaging has been shown to be sensitive to myelin content (Derakhshan et al. 2014; Chen et al. 2013) and thus would be an excellent complementary measure because its underlying contrast mechanisms are different than that from T2*. However, mapping MTR and T2* in the cortex is challenging because the cortical ribbon is thin, highly convoluted and its geometry varies across individuals.
Goals: The first goal of this study was to combine MTR and T2* using multivariate statistics in order to gain insights into cortical myelin content. The second goal was to assess the benefits of the combination to study the cortical disease progression in various groups of MS patients.
Method: Healthy Control (HC) subjects and MS patients were scanned at 7 T and at 3 T to obtain T2* and MTR data, respectively. A multivariate myelin estimation model was developed, and consists of (i) normalizing T2* and MTR values and (ii) extracting their shared information using independent component analysis (ICA). B0 orientation dependence and cortical thickness were also computed and included in the model. Comparisons with previous histological work and simulated MRI data were used to validate the improvement given by the combined metrics. General Linear Models (GLM) were used to assess group differences in MS versus HC. Age, gender and mean cortical thickness were included as regressing factors. Sometimes, specificity/sensitivity assessment using Receiver Operating Characteristics (ROC) curves was performed on various cortical areas. Finally, laminar study of the diffuse pathology was achieved in a group of early MS patients by using samplings at diverse cortical depth.
Results: High correlations were found between MTR and T2* in the whole cortex (r = 0.76, p = 10−16), suggesting that both metrics are partly driven by a common source of contrast, here assumed to be the myelin. Average MTR and T2* were respectively 31.0 +/− 0.3% and 32.1 +/− 1.4 ms. Resulting combined map showed similar trends to that from histological work stained for myelin (r = 0.77, p = 0.01). Significant right-left differences were detected in the primary motor cortex, the posterior cingulate cortex and the visual cortex (p = 0.05). General linear models have revealed regions of significant cortical demyelination, namely in the motor, visual, auditory and somatosensory cortices (p<0.05). These differences were statistically significant while using the combined myelin map, although no significant difference was detected when using others matrices (i.e. MTR and T2*) taken alone. Moreover, the combined myelin map was shown to detect areas of diffuse demyelination in the cortices of early MS patients (p<0.05, disease duration < 3 years).
Discussion: This research demonstrated that MTR and T2* are highly correlated in the cortex. The combination of MTR, T2*, cortical thickness and B0 orientation may be a useful means to study cortical myeloarchitecture with more specificity than taking each contrast separately. This provides a powerful tool to study slight and early cortical demyelination in MS patients. Pioneer
applications of the method support subpial demyelination as an early event in MS, even in the presence of mild neurological disability.
Impact: Non-invasive quantification of the MS cortical pathology is the missing piece of the MS pathophysiology puzzle. Effectively relating WM pathology, GM pathology and functional worsening, will i) help to understand fine MS mechanism ii) help to design and target future MS treatments.
TABLE OF CONTENTS
DEDICATION ... III ACKNOWLEDGEMENTS ... IV RÉSUMÉ ... VI ABSTRACT ... IX LIST OF TABLES ... XVI LIST OF FIGURES ... XVII LIST OF SYMBOLS AND ABBREVIATIONS... XXV LIST OF APPENDICES ... XXVII
CHAPTER 1 INTRODUCTION ... 1
1.1 Publications ... 3
1.2 Memoire organization ... 4
CHAPTER 2 LITTERATURE REVIEW ... 6
2.1 Medical review ... 6
2.1.1 Physiological bases ... 6
2.1.2 Pathophysiology of Multiple Sclerosis ... 24
2.2 Physical Review ... 33
2.2.1 MRI basics ... 33
2.2.2 Quantitative MRI ... 36
2.3 Mathematical Review ... 43
2.3.1 Multimodal combination challenges ... 43
2.3.2 Independent Component Analysis (ICA) principles ... 44
CHAPTER 3 METODOLOGY ... 49
3.1 Approach of the problem ... 49
3.2 Publications resulting of this mémoire ... 49
3.3 Coherence between publications ... 50
CHAPTER 4 ARTICLE 1: MULTIVARIATE COMBINATION OF MAGNETIZATION TRANSFER, T2* AND B0 ORIENTATION TO STUDY THE MYELO-ARCHITECTURE OF THE IN-VIVO HUMAN CORTEX ... 52
4.1 Abstract ... 53
4.2 Introduction ... 54
4.3 Material and Methods ... 56
4.3.1 Data acquisition ... 56
4.3.2 Data processing ... 56
4.3.3 Multivariate Myelin Estimation Model (MMEM) ... 59
4.4 Results ... 62
4.4.1 MTR, T2*, CT and B0 orientation mapping ... 62
4.4.2 Pearson’s correlations between MTR and T2* ... 64
4.4.3 Distribution graph ... 66
4.4.4 Multivariate myelin estimation model (MMEM) ... 67
4.5 Discussion ... 74
4.5.1 Sensitivity and specificity of MTR and T2* for quantifying myelin content ... 75
4.5.2 Combining MTR and T2* using ICA ... 76
4.5.3 Interpretations of the combined myelin estimation (CME) maps ... 76
4.5.4 Limitations and futures studies ... 80
4.6 Acknowledgements ... 81
CHAPTER 5 SUPPLEMENTARY METHODOLOGICAL INFORMATION ... 86
5.1 Comparison between 7T T2* and 3T MTR in the in vivo human cortex, ISMRM 2014 .. ... 86 5.1.1 Purpose ... 86 5.1.2 Methods ... 87 5.1.3 Results ... 87 5.1.4 Discussions ... 90 5.1.5 References ... 90 5.1.6 Acknowledgments ... 91
CHAPTER 6 SUPPLEMENTARY PUBLISHED WORK : APPLICATIONS IN MULTIPLE SCLEROSIS ... 92
6.1 Multivariate combination of magnetization transfer ratio and quantitative T2* to detect subpial demyelination in multiple sclerosis, ISMRM 2015 ... 92
6.1.1 Target audience ... 93 6.1.2 Purpose ... 93 6.1.3 Methods ... 93 6.1.4 Results ... 95 6.1.5 Discussion ... 98 6.1.6 References ... 98 6.1.7 Acknowledgements ... 98
6.2 Multivariate combination of quantitative T2* and T1 at 7T MRI detects in vivo subpial demyelination in the early stages of MS, ECTRIMS 2015 ... 99
6.2.1 Background and goals ... 99
6.2.2 Methods ... 100
6.2.4 Discussion ... 102
6.2.5 Disclosure ... 102
CHAPTER 7 GENERAL DISCUSSION ... 103
7.1 Choice of Atlas. ... 104
7.2 Histological validation ... 105
7.3 HC and MS matching ... 105
7.4 Limitations of the surface-based analysis ... 105
7.5 The choice of an ICA-based combination ... 106
7.6 Glial cells and MRI ... 106
7.7 P-values… ... 106
CHAPTER 8 CONCLUSION AND RECOMMENDATIONS ... 108
BIBLIOGRAPHY ... 110
LIST OF TABLES
Table 2-1, Overview of various MRI contrasts that have been shown sensitive to the main pathological components of MS. These studies have looked at the sensitivity of MR modalities to MS-related pathology, however they did not address (or to a lower extent) the issue of specificity.This list is not exhaustive, studies were selected by pertinence and recent publication dates. ... 27 Table 2-2, Overview of MRI contrasts mainly used to observes various types of MS lesions. This list is not exhaustive (especially for WM studies). While thousand of studies exists on the topic, studies were selected by pertinence and recent publication dates, with the emphasis put on quantitatives MR modalities. ... 30 Table 4-1. Mean, inter-subject SD and coefficient of variation (COV) of MTR, T2* and CT maps. Left and Right tables are showing results for left (LH) and right (RH) hemispheres respectively. ... 63 Table 4-2. Pearson’s coefficient calculated vertex-wise between each pair of the following parameters: MTR, T2*, CT and B0 orientation for left (LH) and right (RH) hemispheres. ... 65 Table 4-3. Resulting coefficients of the linear models defined in equation 2,3 and their
inter-subjects SD. Coefficients values are expressed in percentages in order to show their relatives contributions to the output maps (ME_MTR and ME_T2*). a is the constant coefficient, b is the coefficient of the main metric (MTR in the ME_MTR regression and T2* in the ME_T2* regression), c is the CT coefficient, d and e are the coefficients of the B0 orientation dependency (see equations (2) and (3)). ... 68
LIST OF FIGURES
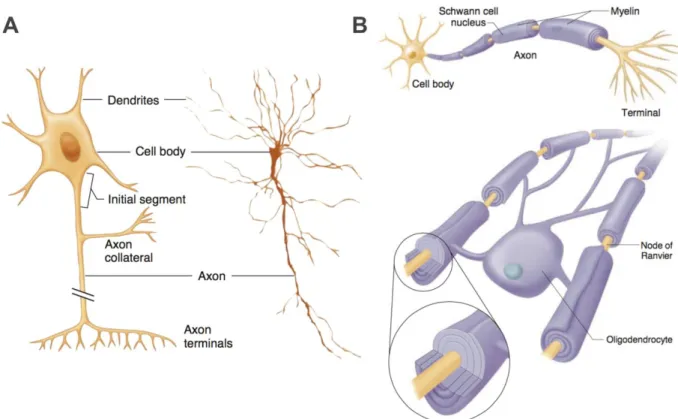
Figure 2-1, Adapted from (Widmaier et al. 2013, Fig. 6-1 & 6-2). Representation of a neuron and its basic components as well as the shape of a neuron observed through a microscope (A). Representations of axons encompassed by macromolecules of myelin. Myelin is produced by oligodendrocytes cells in the CNS and by Schwann cell in the Peripheric Nervous System (PNS). The portion of bare axon in between two myelin blocks is called Node of Ranvier. ... 7 Figure 2-2, Adapted from (Widmaier et al. 2013, Fig. 6-9 & 6-12). Polarisation of the cell membrane, anions such as Cl- keeps the extracellular fluid neutral, in term of electric charge, while some negatively charged proteins keep the intracellular fluid negatively charged. At rest, the typical potential difference between intra- and extra- cellular fluids is -70 [mV] (A). Gradient in ions concentration is creating a diffusion flux through the membrane. For example, if the sodium channels open, a flux of Na+ ions will enter the cell because their concentration is lower inside the cell. To maintain the gradient in concentration, Na+/K+ -ATPase pumps use energy contain in ATP to pump K+ inside the cell and pump Na+ outside (B). ... 8
Figure 2-3, Adapted from (Widmaier et al. 2013 Fig. 6-19). Variations of the membrane potential resulting of K+ and Na+ fluxes (A). Variations of membrane permeability after an action potential for both K+ and Na+ (B). Steps 1-7 represents: 1) The membrane is at its steady potential -70 [mV]. 2) an external depolarizing stimulus brings the membrane potential to the threshold potential. 3) Na+ channels open, thus Na+ ions enter rapidly. This results in a fast depolarisation of the membrane (up to 30 [mV]). 4) Na+ channels close while K+ channels open. 5) K+ ions exit the cell, inducing repolarization of the membrane. 6) An hyper-polarisation occurs because K+ channels close slowly and too much K+ is left out. 7) back to the steady potential. ... 10 Figure 2-4, Adapted from (Widmaier et al. 2013 Fig. 6-22). Principle of the propagation of the membrane depolarisation. i) The local depolarisation of the membrane by an action potential will trigger the neighbouring membrane to depolarise itself (because K+ and Na+ channels are voltage-gated channels sensitive to a neighboring depolarisation). ii) the “already depolarised” membrane is refractory so that only the resting membrane will be depolarised and so on. ... 11
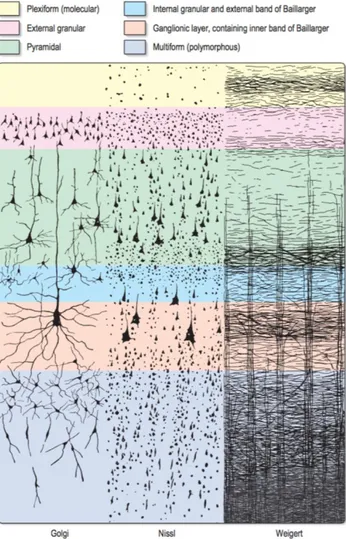
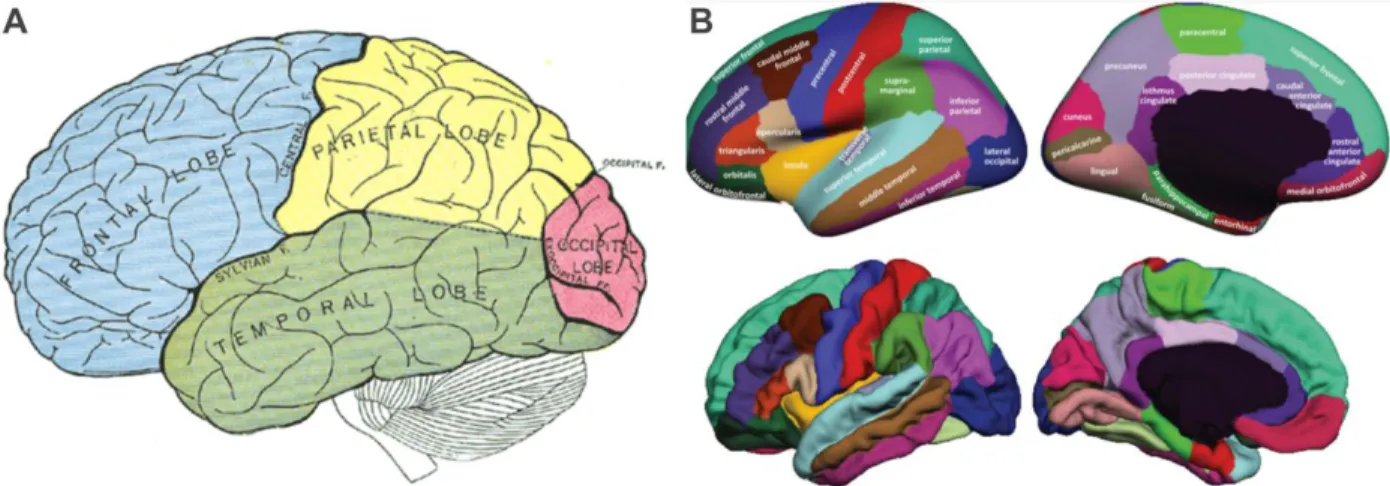
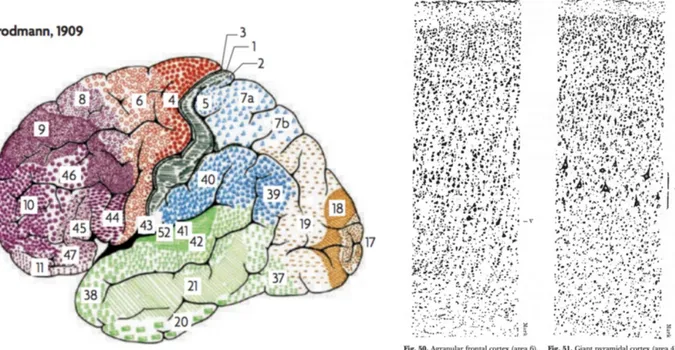
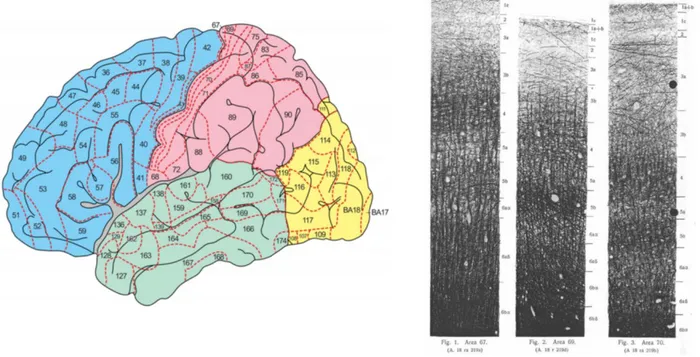
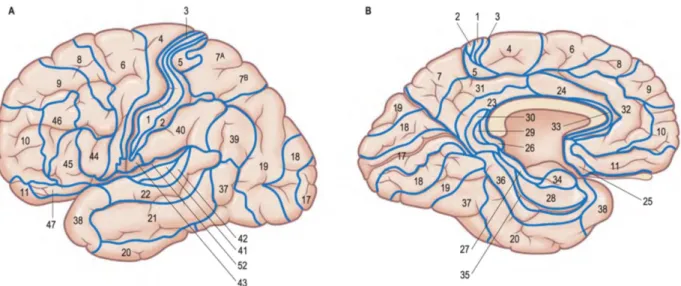
Figure 2-5, Adapted from (Widmaier et al. 2013 Fig. 6-23). Representation of the saltatory conduction. Concentration of voltage-gated sodium channels is low in the myelinated regions. Action potentials occur only at the nodes of Ranvier, where axon is bare and the concentration of voltage-gated sodium channels is high. Action potentials thus “jump” from one node to the next as they propagate along a myelinated fiber. ... 12 Figure 2-6, MRI T1-w image, sagittal view. The cortical grey matter (GM) is the outer (dark) layer of the brain, while the inside white region is the white matter (WM). ... 13 Figure 2-7, Adapted from (Widmaier et al. 2013). Representation of the main glial cells of the central nervous system. ... 15 Figure 2-8, From (Gray & Standring 2008). Representation of the structural organisation of neurons through the differents layers of the cortex. The most frequent types of neocortical neurones, showing typical connections with each other and with afferent fibers are represented. ... 16 Figure 2-9, From (Gray & Standring 2008), representation of the six cortical layers as revealed by three different stainings, namely the Golgi staining, the Nissl staining and the Weigert staining. These staining methods are complementary, they respectively show the whole neurons (soma + dendrites), the cells bodies only and the myelinated fibers only. ... 17 Figure 2-10, (A) Basic four-areas parcellation of the cerebral cortex, made by Henry Gray in 1858 (Gray & Standring 2008). These four areas are: the frontal lobe (blue), the parietal lobe (yellow), the temporal lobe (green) and the occipital lobe (red). (B) Anatomical atlas made from cortical gyri parcellation (Klein & Tourville 2012). ... 18 Figure 2-11, atlas of the Brodmann areas (left,(Zilles & Amunts 2010) of the Human cortex and samples of the cellular organisation of the brodmann area (BA) 6 and BA 4 in monkeys (right, (Brodmann 1909)). ... 20 Figure 2-12, Nieuwenhuys atlas: restored version of the myelo-architectural Vogt-Vogt atlas (left, (Nieuwenhuys et al. 2014) and sample of the myelinated fibre, stained with the Weigert method made by Vogt and Vogt in 1911 (Vogt 1911). ... 21 Figure 2-13, From (Gray & Standring 2008), shows a detailed parcellation in Brodmann Areas (BAs) in lateral (A) and medial (B) views of the left hemisphere of the Human cortex. Here is a non-exhaustive functional description of some BAs: ... 22
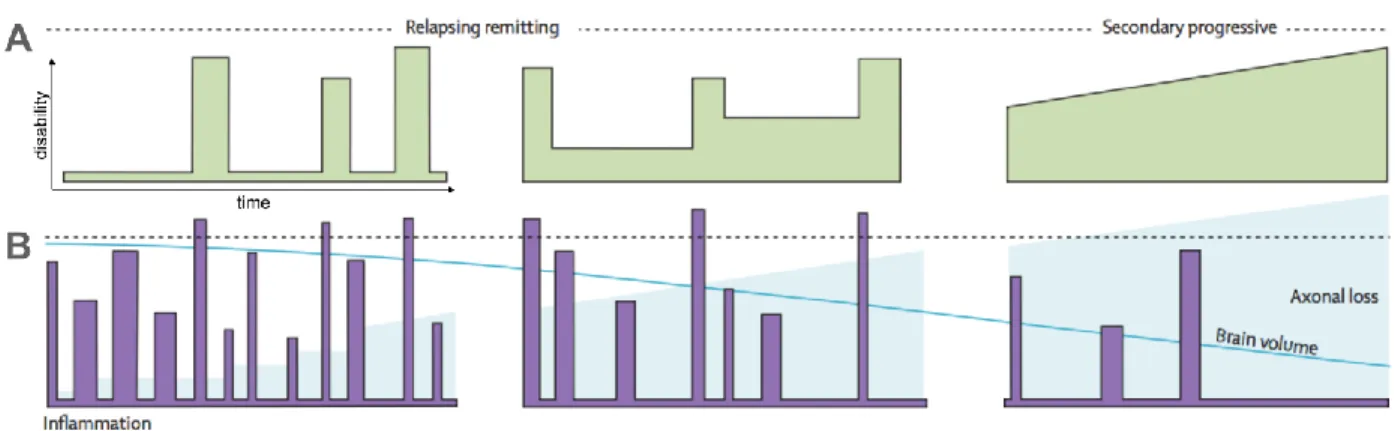
Figure 2-14, From (Gray & Standring 2008). Representation of the five main neural organisations of the cerebral cortex (B) and a map of their respective location (B). ... 23 Figure 2-15, adapted from (Compston & Coles 2008). (A) Example of the progression of the disability over time for RRMS and SPMS patients. (B) Example of the progression of inflammation events, axonal loss and brain atrophy over time for RRMS and SPMS patients. ... 24 Figure 2-16, Adapted from (Compston & Coles 2008) (A) and (Mainero et al. 2009) (B). A: Example of WM plaques or lesions observed in RRMS and SPMS patients. B: Example of plaques or lesions in the cortical grey matter of MS patients. ... 25 Figure 2-17. (A) Representation of the four types of cortical lesions (courtesy of Dr. C. Louapre). (B) Example of cortical lesions seen on MS patients, using 7T FLASH T2* modality. Adapted from (Mainero et al. 2009) (C) Example of cortical lesions seen on MS patients, using 7T T2*w modality. Adapted from (Pitt et al. 2010). ... 32 Figure 2-18. (A) Representation of the characteristic T1 and T2 relaxation times. The B1 excitation makes the spins collapsing to the xy plane and set them in-phase. T1 is the characteristic realigning time while T2 is the characteristic dephasing time. (B) MRI images of T1 and T2 weighted contrasts, acquired at 7T. ... 35 Figure 2-19. From (Henkelman et al. 2001). Schematic absorption lineshape of protons in the liquid pool (water protons) and protons in the macromolecular pool (protons linked to macromolecules). ... 37 Figure 2-20. Adapted from (G. Mangeat, 2013). Example of MTR image of the brain. ... 38 Figure 2-21, From (Cohen-Adad 2014), shows the transverse relaxation decay curves T2 and T2* as well as an example of experimentals T2*w values acquired at regular TEs. The T2* decay curve is obtained by fitting a negative monoexponential curve on T2*w values while T2* value of a voxel is defined as being the time value for which the signal is 37% of the maximum signal (at t=0). ... 41 Figure 2-22, From (Cohen-Adad 2014), shows two histological maps of myelin content and iron content of the same cortical area, as well as the corresponding T2* map acquired at 7T. ... 42
Figure 2-23, simplified concept of myelin extraction from several myelin-sensitive MRI contrasts. As presented in the previous section, MTR and T2* have both confounding factors hampering their specificity to myelin, but interestingly, their confounding factors are not overlapping. The idea is thus to extract the source of signal shared by both metrics, yielding a better estimator of myelin than when taking each metric separately. ... 43 Figure 4-1. Pre-processing framework. The cortical surface was extracted with freesurfer from an anatomical T1-weighted volume. MT data: mt_on and mt_off volumes were registered to the T1-w volume (Reuter et al., 2010), then the MT ratio (MTR) was computed. mt_off was registered to the cortical surface (CS) using boundary based registration technique (12 d.o.f.) (Greve and Fischl, 2009). The transformation matrix of the registration was applied to the MTR volume. T2* volume was registered to the T1-w volume using header information. Then, T2* volume was registered to the cortical surface using boundary based registration (9 d.o.f.). MTR and T2* cortical maps were computed at each vertex along the mid-cortical surface. Cortical thickness map was acquired by computing the distance between white and pial surfaces for each vertex. B0 orientation map was computed from the angle between the normal of the cortical surface and the orientation of the B0 field. Lastly, the four metrics (T2*, MTR, cortical thickness and B0 orientation) were projected to a common space (fsaverage) using a spherical averaging procedure (FreeSurfer). ... 57 Figure 4-2. Multivariate myelin estimation model (MMEM). MMEM aimed to estimate a cortical myelin map using MTR, T2*, cortical thickness (CT) and B0 orientation maps. The MMEM was divided into two steps. Firstly, two maps were estimated using multi-linear regressions: one using MTR, CT and B0 orientation (ME_MTR) and one using T2*, CT and B0 orientation (ME_T2*). ME_MTR and ME_T2* maps represent myelin-correlated values corrected for partial volume effect and fibers orientation. In order to merge MTR and T2* within the same framework, both linear regressions were performed with a common dependent variable (BMM). Secondly, the shared information between ME_MTR and ME_T2* was extracted using ICA decomposition, for each subject. The ICA decomposed the signal into two component that are mathematically independent. The ‘so-called’ first component of the ICA was the source that share the highest variance between ME_MTR and ME_T2*. The hypothesis being that the first component of the ICA was an indicator for myelin content. . 61
Figure 4-3. (A) Maps averaged across subjects of MTR, T2*, cortical thickness (CT) and B0 orientation. In MTR and T2* maps, white lines are showing the borders of the primary somatosensory cortex (BA1, BA2 & BA3), the somatosensory association cortex (BA5 & BA7), the posterior cingulate cortex (BA31 & BA23) and the visual cortex (BA17, BA18 & BA19). Arrow are also showing the primary motor cortex (BA4) and the primary auditory cortex (BA42). White dashed lines are showing the central sulcus and the calcarine fissure. The colormap was thresholded (mid-value of each distribution) to enhance its dynamic. For un-thresholded maps, see Supplementary Material S4. (B) Maps of the standard deviation across subjects for MTR, T2*, CT and B0 orientation. ... 64 Figure 4-4. Pearson’s correlations between MTR and T2* maps averaged across subjects. Strong correlations were observed in right (r = -0.77) and left (r = -0.75) hemispheres. The colormap shows the data-point density in the scatter and suggest a 2D Gaussian tendency well defined in the center of the distribution. ... 65 Figure 4-5. The graph on the left panel shows the distribution of the four signals used in the MMEM: MTR (blue), T2* (red), CT (magenta) and B0 orientation (green). The abscissa represents vertices defining the cortical surface (total number of vertices = 163,842). For clarity, the vertices order was chosen to make T2* increasing and values were smoothed along the abscissa (100-point window). Error strips represent the inter-subjects SD. Similar trends are observed between the left and the right hemispheres, therefore only the signal of the right hemisphere was plotted. The distribution graph was divided into four ensembles of vertices (1, 2, 3 & 4) based on their signal’s shapes. Vertices corresponding to these regions are plotted on the right panel with the respective colors: light blue, dark blue, yellow & red. ... 67 Figure 4-6. (A) Scatters of the individual data (ME_MTR vs ME_T2*) and both ICA’s resulting components (pink arrows). For each subjects, first ICA’s component is the one sharing most variance between ME_MTR and ME_T2* (pointing upper right). (B) Projection of the ME_MTR and ME_T2* data into the space defined by the two ICA’s components. These graphs are used to assess the non-correlation (r<0.06) of the resulting set of data. The colormap shows the data-point density in the scatters. ... 69 Figure 4-7. Average map of the Combined Myelin Estimation (CME). The mean and SD of CME across the cortex was 50.3±0.7. Overall, we notice a high myelin estimation (yellow/red) in
the primary motor cortex BA4=74±3% (here, % refers to the CME metric, and ±3% refers to the SD across subjects) and in the primary somatosensory cortex (BA1=67±7%, BA2=59±4% and BA3=63±13%). Moreover, a high myelin estimation is also observed in the visual cortex (BA17=67±5% & BA18=68±6%) and the auditory cortex (BA42=57±10%). ... 70 Figure 4-8. (A) Side-by-side comparison between CME maps and its both parents contrasts: ME_MTR and ME_T2*. Major differences between ME_MTR and ME_T2* are circled by white circles. The CME map is labelled with the Brodmann areas used in the histological comparison. (B) Comparison between our myelin-related maps (CME, ME_MTR and ME_T2*) and previous cortical myelin content histology data performed by Braitenberg (Braitenberg, 1962) in different Brodmann areas. The equations of the linear regressions are displayed at the bottom-right of the graph. The linear regression between T2* and histological myelin staining (HMS) is: T2*=-15.2*10-3[ms/a.u.]*HMS+39.4[ms]; and the linear regression between MTR and HMS is: MTR=4.2*10-3[%/a.u.]*HMS+29.0[%]. (C) Pearson’s correlations coefficients between MTR vs Histology, T2* vs Histology, ME_MTR vs Histology, ME_T2* vs Histology and CME vs Histology and their respective P_values. Results suggests first that ME_MTR and ME_T2* contrasts are relevant marker of the cortical myelin content and second that CME is a more specific marker for cortical myelin content than ME_MTR or ME_T2* taken separately. ... 71 Figure 4-9. (A) CME map with an overlay of the PALS-B12 Brodmann Areas (BA). This figure shows a fair adequation between variations of CME and BA borders, for instance in BA1, BA2, BA3 and BA4 (primary motor and primary somatosensory cortex, green arrows), in BA17, BA18, BA19 (visual cortex, blue arrows) and in BA42 (auditory cortex, yellow arrow). (B) CME map averaged within each BA. (C) Mean BA values, as well as the inter-subject SD and the area SD. In comparison with the SD across the entire cortex (26.5%), the intra-area SD is fairly low (in average 11.9%). ... 73 Figure 4-10. Bar graphs representing mean and inter-subject SD values of the different metrics used in the MMEM (CME, MTR, ME_MTR, T2*, ME_T2*) within Brodmann regions. Overall, we observe a fairly good right-left reproducibility. The CME map shows significant hemispheric differences in BA4 and BA31 (more myelin estimated in rh, p<0.05) and in BA17 and BA23 (more myelin estimated in lh, respectively p<0.05 and p<0.01). ... 74
Figure 4-11. Comparison with recent in vivo studies showing different contrasts sensitive to cortical myelin content in healthy adults. (A) quantitative R1 maps averaged across 6 control subjects (Sereno et al., 2013). ΔR1 is the difference between the mean R1 (across the cortex) and the R1 in a specific vertex. (B) T1w/T2w maps averaged across 69 subjects (Glasser and Van Essen, 2011). (C) CME maps averaged across 6 subjects, unsmoothed. Green circles show similarities between CME maps and R1 or T1w/T2w. Red circles show differences. ... 78 Figure 5-1. Mean and SD maps between the six controls for the T2* metric (left) and the MTR values (right). Mean maps (top) shows an increase in MTR and a decrease in T2* in the central sulcus. ... 88 Figure 5-2. Linear regression between T2* and MTR vertices values. The Pearson’s correlation coefficient for this regression is r=-0.77. ... 88 Figure 5-3. Mean values of T2* and MTR across Brodmann regions with different myelin content. Data are averaged between the six controls. Error bars represent SD across subjects. ... 89 Figure 5-4. Map of Pearson’s correlation coefficients between MTR andT2* calculated within Brodmann areas. Repartition graphs are shown for selected regions. Once again, the right-left reproducibility is high, however we note that correlations are slightly higher on the left hemisphere. Overall, we note that correlations are negative, meaning that MTR increases where T2* decreases. ... 89 Figure 6-1. Processing steps applied to combine the cortical information of 7T T2*, 3T MTR and B0 orientation in order to extract a metric more specific to myelin than other metric taken separately. ... 95 Figure 6-2. A. Overlay f the GLM significance maps averaged on the mid-cortical surface. B. Zoom in the lower precentral gyrus (part of BA4). C. Distribution of both control and MS patient groups in BA4p. D. ROC curves of the distributions in C. ... 96 Figure 6-3. Specificity of the subject classification from the assessment of the subpial demyelination in the selected cortical regions, assuming a sensitivity of 60%. ... 96 Figure 6-4. MTR map, T2* map and CME map, averaged across controls. An average decrease of signal between both MTR group maps is observed, which is consistent with a cortical demylination because MTR is proportional to myelin content. T2* is inversely proportional to
myelin content, and as expected we observe an increase if signal. CME proportional to the amount of myelin, and again, as expected we observe a decrease of signal. All these results suggest a subpial demyelination, but, are the observed variations significant? ... 97 Figure 6-5. Result of a HC vs MS GLM performed on BA basis and using the regressors: gender, age and mean cortical thickness. Some significant differences in prefrontal and motor, visual and auditory cortices are observed. We also notice a higher level of significance in LH. .... 98 Figure 6-6. Myelin estimated maps averaged across HC and MS groups. We can visually observe a qualitative loss of myelin around the motor, visual and auditory cortices. Quantitatively, in the whole cortex, CME was decreased while T1 and T2* were increased in MS vs HC: CME=47±0.8% vs 49±1.3%; T1=1727±56ms vs 1654±70ms; T2*=34.0±1.2ms vs 33.0±1.1ms). ... 101 Figure 6-7. Result of the GLM comparing HC vs MS, performed on BA basis, at three cortical depths. Significant loss of myelin in sensory, motor (BA3, BA4, BA6) and prefrontal (BA10) areas (p< 0.05). Significantly higher T1 was observed in frontal cortex (BA45, p< 0.05). No regions were significantly different using T2*. ... 101
LIST OF SYMBOLS AND ABBREVIATIONS
ASA American Statistician AssociationBBB Blood-Brain Barrier
CARS Coherent Anti-Stokes Raman Scattering
CL Cortical Lesion
CLT Central Limit Theorem
CNS Central Nervous System
CSF Cerebro-Spinal Fluid
CT Cortical Thickness
DIR Double Inversion Recovery
DSI Diffusion Spectrum Imaging
DTI Diffusion Tensor Imaging
ECTRIMS European Committee for Treatment and Research in Multiple Sclerosis FLAIR FLuid-Attenuated Inversion Recovery
GM Gray Matter
HC Healthy Control
IC Independent Component
ICA Independent Component Analysis
IF Impact Factor
ISMRM International Society for Magnetic Resonance in Medicine MMEM Multivariate Myelin-Estimation Model
MRI Magnetic Resonance Imaging
MS Multiple Sclerosis
MTR Magnetization Transfer Ratio
NAGM Normal Appearing Grey Matter
NAWM Normal Appearing White Matter
NMR Nuclear Magnetic Resonance
PCA Principal Component Analysis
PET Proton Emission Tomography
PNS Peripheric Nervous System
qPD quantitative Proton Density
qT1 quantitative T1
qT2 quantitative T2
RD Radial Diffusivity
RRMS Relapsing-Remitting Multiple Sclerosis
SBA Surface-Based Analysis
SD Standard Deviation
SNR Signal to Noise Ratio
SPGR SPoiled Gradient Recalled imaging SPMS Secondary Progressive Multiple Sclerosis
TE Echo Time
TR Repetition Time
LIST OF APPENDICES
CHAPTER 1
INTRODUCTION
Multiple Sclerosis (MS) is a neurodegenerative disease of the central nervous system (CNS) affecting around 100,000 people in Canada (MS Society of Canada). MS is the second cause of handicap in young adults. The functional deficits resulting from the disease include motor, cognitive and somatic troubles, affecting the social and professional activities of MS patients. The socio-economic cost of MS is colossal. Firstly, life quality of MS patients and those of their family members can be drastically hampered, they can for example lose their job or not anymore be able to live autonomously. Secondly, existing treatments that reduce handicapping effects of MS are expensive, with an annual cost estimated in billions of dollars in Canada (Karampampa et al. 2012) and in the USA (Hartung et al. 2015). MS is thus a colossal socio-economic concern for the society. To date, MS is not curable and its pathophysiological mechanisms are still obscure.
MS is known to be an inflammatory and demyelinating disease. Inflammation comes from an immune reaction of the nervous system against itself. This mechanism classifies MS with the autoimmune diseases. Moreover, MS attacks and disrupts the protective layer of axons, called myelin. Myelin is essential for the transmission of action potentials in axons, thus amongst neurons. Without myelin, information travels slower and bare axons become vulnerable to external attacks. Unfortunately, loss or degeneration of axons are common outcomes of MS, making it a so-called neurodegenerative disease.
MS patients can present various kind of symptoms. Some patients can keep a good quality of life and a perfect social integrity during their entire life, while others will quickly lose their cognitive abilities and social skills (Lhermitte 1924). One difficulty that clinicians and researchers developing treatment face is that MS is difficult to diagnose. In addition to a neurological examination, Magnetic Resonance Imaging (MRI) is used to detect tissue damages in the brain (and spinal cord). Because MRI can detect in-vivo a variety of MS features in the brain, such as inflammations, oedemas or demyelinating lesions, it has become the principal tool for the study of the disease progression, pathophysiology and treatment assessment.
Until the beginning of 2000s, MS has been primarily known as a white matter disease. However, evidence of diffuse gray matter (GM) pathology has been reported since the nineteenth century (Wyllys Taylor 1894; Brownell & Hughes 1962). This biased view has been partly
influenced by the difficulty in detecting MS lesions in the cortex. Moreover, the damaged WM areas and the observed functional deficits were not correlating well, letting doubts in the comprehension of the pathology. Eventually, progress in MRI technology (including superconductors) allowed to increase the MRI’s magnetic field, permitting to gain resolution and sensitivity in MR images. Notably, 7 Tesla MRI devices led to a significant breakthrough in the study of the progression of MS in the cortical gray matter (also called cerebral cortex). Researchers not only discovered that MS pathology was present in the cortex, but studies found that the cortical pathology was at least as important as in the WM (Kidd et al. 1999; Peterson et al. 2001). Thus, new questions are raised, such as the potential interplay between GM and WM pathology, the role of GM demyelinating lesion or their correlation with functional deficits.
The cerebral cortex is a complex and still poorly-known part of the human brain, where the neuronal fibers converge and inter-connect. Despite its thin structure (2-4mm thick and 1.1-1.5% of the total brain volume), it contains more than 100 billion neurons and 100 trillion neural connexions. The brain cortex is involved in the Human intelligence, consciousness, senses perceptions, memory, motor functions, etc.. Thus, it is not surprising that cortical damages, such as cortical demyelinating lesions can seriously impact nervous functions.
The use of MRI to study myelo-architectural structures in-vivo (and MS damages) of the cortex is still a research practice. Indeed, cortical studies are challenging because of the thin aspect of the cortex, its high level of convolution, the low MR signal caused by a limited spatial resolution and the high structural variability across individuals. Moreover, even when using a cutting edge MRI device, there are only a few MR modalities (sometimes called metrics) capable of producing a good signal and contrast in the cortex.
Recently, T2* acquired with 7 Tesla scanners was shown to provide quantitative markers of the pathology progression and the myelin organisation in the cortex (Deistung et al. 2013; Cohen-Adad et al. 2011; Mainero et al. 2015; Li et al. 2015). Although there are several aspects supporting a significant role of cyto/myelo- architecture in T2* relaxation in the brain, several confounds exist that reduce the specificity of T2* as a marker of myelin, such as the tissues iron level, B0 field inhomogeneities or tissue orientation with respect to B0(Lee et al. 2012; Lee et al. 2011;
An independent measure would increase the specificity to myelin. Magnetisation Transfer (MT) imaging has been shown to be sensitive to myelin content in WM (Schmierer et al. 2004; Schmierer et al. 2007) & GM (Chen et al. 2013; Derakhshan et al. 2014) and thus would be an excellent complementary measure because its underlying contrast mechanisms are substantially different from T2*. The MT effect results from the interaction between water protons and protons associated with macromolecules. Macromolecules, such as myelin can be indirectly imaged by using an off-resonance pulse that will saturate their spins in magnetisation and lower their contribution in an ensuing MR image (Henkelman et al. 2001; Pike Bruce 1996). The term transfer comes from the fact that macromolecules will transfer their magnetisation to the surrounding water molecules, and this mechanism of transfer is the principal source of MT contrast.
The goal of my master’s thesis was to acquire both MR metrics (MTR and T2*) in the cortex of subjects and to combine them by using multivariate statistics in order to obtain a metric more specific to the cortical myelin content. The usefulness of such a metric being to study the cortical myeloarchitecture of the Human brain and the progression of cortical MS pathology.
My research hypotheses were: H1) The combination of T2* and MTR using multivariate statistics will provide a sensitive and specific mapping of myelin content, as validated using previous histology work in humans (Braitenberg 1962; Geyer et al. 2011). H2) The combined metrics corrected for confounds will show changes in the cortex of MS patients versus healthy controls. H3) These changes will be correlated to functional deficits in MS patients, as assessed using clinical scores.
1.1 Publications
During my two years of Master’s study, I’ve been working on the above hypotheses. As a result, I have published one scientific article and one conference poster about the validation of H1
(Mangeat et al. 2014; Mangeat, et al. 2015) as well as one conference presentation and one conference poster about the validation of H2 and H3 (Mangeat et al. 2015; G. Mangeat, et al. 2015; Mangeat et al. 2016). More explicitly, these publications were:
Mangeat et. al., 2015, Multivariate combination of magnetization transfer, T2* and B0 orientation to study the myelo-architecture of the in vivo human cortex. Neuroimage 119, 89–102.
Mangeat et. al., 2014, Comparison between 7T T2* and 3T MTR in the in vivo human cortex, in: ISMRM, poster #1783.
Mangeat et. al., 2015, Multivariate combination of magnetization transfer ratio and quantitative T2* to detect subpial demyelination in multiple sclerosis, in: ISMRM, presentation #0823.
Mangeat et. al., 2015, Multivariate combination of quantitative T2* and T1 at 7T MRI
detects in vivo subpial demyelination in the early stages of MS, in: Mult Scler. Presented at the ECTRIMS, p. 485.
Mangeat et. al., 2016, Association between cortical demyelination and structural connectomics in early multiple sclerosis, in: ISMRM, presentation #237.
1.2 Memoire organization
This present mémoire is divided in eight chapters: Chapter 1 is the present introduction.
Chapter 2 is the literature review. This review first introduces the physiology of a neuron with the emphasis on the axon composition and the key role played by myelin in the transmission of actions potentials. Then, it zooms out to present the laminar organisation of the Human cortex, namely, the various cortical layers, their typical neural composition and the differents techniques used to image the ex-vivo cyto- and myelo-architecture of the Human cortex. It zooms out again, and introduces the whole Human cortex, its various parcellations in cortical areas and the advantages of previous parcellation works. Then, challenges in creating and using cortical parcellations are pointed out. Next, Multiple Sclerosis is introduced. Elements of the pathophysiology are explained, and the various MRI techniques to study the disease features and progression are summarized. Then, the focus is put on cortical MS features and the cutting edge MRI methods to image them in-vivo. The second part of the review introduces the concept of nuclear resonance imaging and its evolutions leading to the concept of quantitative imaging (qMRI). Ensuingly, particular attention is given to the two quantitative MRI modalities MTR and T2*, their contrast mechanism, their sources of signal and their abilities to image cortical myelin content. Thereafter, the rationale behind combining MTR and T2* is presented. The third part of the review is about mathematics. It presents the concept of the Independent Component Analysis
(ICA) decomposition and compares diverse algorithms available in the literature, in term of computation time, robustness and accuracy. Finally, the Mathematics review outlines the problem of groups statistics when using normalized data and derives a solution based on relative distribution parameters.
Chapter 3 gives an overview of the research methodology followed in this mémoire. It shows the scientific publications resulting from this mémoire and explains the scientific approach that links these publications amongst them.
Chapter 4 presents the main scientific publication of this work: Multivariate combination of magnetization transfer, T2* and B0 orientation to study the myelo-architecture of the in vivo human cortex, article published in the scientific journal NeuroImage on October 1st, 2015.
Chapter 5 gives supplementary information about the methodology behind the choice of combining MTR and T2*. It presents Comparison between 7T T2* and 3T MTR in the in vivo human cortex, which is a scientific poster presented in may 2014 at the conference ISMRM (International Society for Magnetic Resonance in Medicine). This work explored the feasibility to combine MTR and T2* metrics in the human cortex.
Chapter 6 discusses the applications of the combination method to study cortical MS pathology. It summarises the study: Multivariate combination of magnetization transfer ratio and quantitative T2* to detect subpial demyelination in multiple sclerosis, which is an oral presentation
presented in june 2015 at the conference ISMRM, as well as the study Multivariate combination of quantitative T2* and T1 at 7T MRI detects in vivo subpial demyelination in the early stages of
MS, which is a scientific poster presented in october 2015 at the conference ECTRIMS (European Committee for Treatment and Research in Multiple Sclerosis).
Chapter 7 is a general discussion about the performed studies. It relates the limitations and the potential weakness of the methods and gives the details of potential improvements relevant for researchers interested in this work.
Chapter 8 concludes this Master’s thesis and states examples of future work relevant to the study of cortical MS pathology using MRI.
CHAPTER 2
LITTERATURE REVIEW
2.1 Medical review
2.1.1 Physiological bases
2.1.1.1 Physiology of the neuron
Neurons are the basic functional units of both the central and the peripheral nervous systems. They are the cells responsible for the transmission of nervous information. Neurons operate by generating electrical signals (ionic currents) that move from one part of the cell to neighboring cells. Depending on the amount and amplitude of stimulations received by neighboring cells, a neuron will decide whether it will transmit the signal, called action potential, or not. This basic principle drives the whole nervous system and leads, for example, to memory, cognition or consciousness. This section will cover the anatomy of the neuron, the principle of circulation of information and the key role played by the molecules of myelin.
2.1.1.1.1 Anatomy
Neurons appear in a wide variety of sizes and shapes, but all share dendrites and axons terminals, used to receive and transmit the nervous information, respectively .Moreover, all neurons have a cell body, called soma, and a wiring system, called axon, that convey the electrical information through the nervous system. Figure 2-1 A shows a representation of a neuron and its basic components as well as the shape of a neuron observed through a microscope. As in other types of cells, a neuron contains a nucleus in its cell body (or soma) that enclose the genetic information as well as ribosomes and machinery necessary for protein synthesis. The dendrites are a series of highly branched outgrowths linked to the soma. their role is to receive the inputs from others neurons. On average a neuron has 1,000 dendrites, but some neurons may have as many as 400,000 dendrites. The number of dendrites increase the cell capacity to receive signal from many afferent neurons. The components that actually transmit the information are the axon terminals. Under the command of an action potential, axons terminals are releasing the neurotransmitters through the synaptic terminals, that reach another neuron or an excitatory cell. Finally, the part of the neuron which links the soma with the axons terminals is a kind of organic wire called axon. An axon can be some micrometers to many centimeters long. Axons are
encompassed by sheaths of myelin, a fatty white substance produced by a cell called oligodendrocyte, Figure 2-1 B. Axons transmit the actions potentials from the cell body to the axons terminals using ionic currents. To understand the key role played by myelin in the conveyance of action potentials, it is important to understand first the principles of membrane ionic currents.
Figure 2-1, Adapted from (Widmaier et al. 2013, Fig. 6-1 & 6-2). Representation of a neuron and its basic components as well as the shape of a neuron observed through a microscope (A). Representations of axons encompassed by macromolecules of myelin. Myelin is produced by oligodendrocytes cells in the CNS and by Schwann cell in the Peripheric Nervous System (PNS). The portion of bare axon in between two myelin blocks is called Node of Ranvier.
The two ions that are playing the main role in neural ionic current are K+ (Potassium) and Na+ (Sodium). At resting state K+ ions are found in high concentration in the intracellular fluid (~150 [mmol/L]), whereas they are found in low concentration in the extracellular fluid (~5 [mmol/L]). Inversely, Na+ ions are present in low concentration in the intracellular fluid (~15 [mmol/L]), but are found in high concentration in the extracellular fluid (~145 [mmol/L]).
Moreover, the cell membrane is equipped with channels which act like a door and which are specific to one kind of ion, for example the potassium channel and the sodium channel. When these channels are open, the gradient in concentration is creating a diffusion flux through the membrane. For example, if the sodium channels open, a flux of Na+ ions will enter the cell because their concentration is lower inside the cell.
In addition to the diffusion gradient, the electrical force plays a role on ions flux. Indeed, some anions such as Cl- keeps the extracellular fluid neutral, in term of electric charge, while some negatively charged proteins keep the intracellular fluid negatively charged. At rest, the typical potential difference between intra- and extra- cellular fluids is -70 [mV]. This negative potential polarises the cell membrane and thus contributes to retain K+ ions inside the cell and to attract Na+ ions inside the cell as well. To maintain the gradient in concentration, Na+/K+ -ATPase pumps use energy contain in ATP to pump K+ inside the cell and pump Na+ outside. Figure 2-2, A represents the polarisation of the cell membrane, while Figure 2-2 B summarises the two forces driving K+ and Na+ flux occurring when channels are open.
Figure 2-2, Adapted from (Widmaier et al. 2013, Fig. 6-9 & 6-12). Polarisation of the cell membrane, anions such as Cl- keeps the extracellular fluid neutral, in term of electric charge, while some negatively charged proteins keep the intracellular fluid negatively charged. At rest, the typical potential difference between intra- and extra- cellular fluids is -70 [mV] (A). Gradient in ions
concentration is creating a diffusion flux through the membrane. For example, if the sodium channels open, a flux of Na+ ions will enter the cell because their concentration is lower inside the cell. To maintain the gradient in concentration, Na+/K+ -ATPase pumps use energy contain in ATP to pump K+ inside the cell and pump Na+ outside (B).
To understand how neurons transmit action potentials, it is necessary to understand how ionic channels open and what happens with the membrane potential when they open. Potassium and sodium channels are triggered by a variation of the membrane potential, they are called voltage-gated channels. Indeed, at rest, the membrane potential is -70 [mV], but if an external stimulus, such as the action of a synapse, changes this membrane potential to approximately -60 [mV], potassium and sodium channels will briefly open. Sodium channels open very briefly (~1 [ms]) whereas potassium channels open for a longer time (~4 [ms]). Moreover, the potassium channels opening is a bit delayed compared to sodium channels opening. Figure 2-3 A shows the variations of the membrane potential resulting of all these ion fluxes. while Figure 2-3 B shows the variations of membrane permeability after an action potential for both K+ and Na+.
To summarize, here are the steps taking place during an action potential: 1) The membrane is at its steady potential -70 [mV]. 2) an external depolarizing stimulus bring the membrane potential to the threshold potential. 3) Na+ channels open, thus Na+ ions enter rapidly (because both electrical force and and concentration gradient influence Na+ to enter the cell). This results in a fast depolarisation of the membrane (up to 30 [mV]). 4) Na+ channels are closing while K+ channels open. 5) K+ ions are going out of the cell, which has for effect to repolarizes the membrane. 6) A hyper-polarisation occurs because K+ channels close slowly and too much K+ is left out. 7) back to the steady potential.
Figure 2-3, Adapted from (Widmaier et al. 2013 Fig. 6-19). Variations of the membrane potential resulting of K+ and Na+ fluxes (A). Variations of membrane permeability after an action potential for both K+ and Na+ (B). Steps 1-7 represents: 1) The membrane is at its steady potential -70 [mV]. 2) an external depolarizing stimulus brings the membrane potential to the threshold potential. 3) Na+ channels open, thus Na+ ions enter rapidly. This results in a fast depolarisation of the membrane (up to 30 [mV]). 4) Na+ channels close while K+ channels open. 5) K+ ions exit the cell, inducing repolarization of the membrane. 6) A hyper-polarisation occurs because K+ channels close slowly and too much K+ is left out. 7) back to the steady potential.
2.1.1.1.2 Circulation of information
After an action potential, the membrane is refractory for 2-4 [ms], meaning that it can not be re-excited while the channels are closing and the pumps are bringing K+ and Na+ concentrations back at their resting values. This refractory period turns out to be essential for the directional transmission of information. Figure 2-4 illustrates the principle of the propagation of the membrane depolarisation. i) The local depolarisation of the membrane by an action potential will trigger the neighbouring membrane to depolarise itself (because K+ and Na+ channels are voltage-gated channels sensitive to a neighboring depolarisation). ii) the “already depolarised” membrane is refractory so that only the resting membrane will be depolarised and so on. This is the principle that causes actions potential propagation along axons.
Figure 2-4, Adapted from (Widmaier et al. 2013 Fig. 6-22). Principle of the propagation of the membrane depolarisation. i) The local depolarisation of the membrane by an action potential will trigger the neighbouring membrane to depolarise itself (because K+ and Na+ channels are voltage-gated channels sensitive to a neighboring depolarisation). ii) the “already depolarised” membrane is refractory so that only the resting membrane will be depolarised and so on.
2.1.1.1.3 The key role of myelin
The velocity with which an action potential propagates along a membrane depends on fiber diameter and whether or not the fiber is surrounded by myelin sheaths (such fibers are called: myelinated fibers). The larger the fiber diameter, the faster the action potential propagates. Indeed, a large fiber offers less resistance to local current, so that more ions will flow in a given time, bringing adjacent regions of the membrane to threshold faster. (Widmaier et al. 2013)
Moreover, the larger part of axons are myelinated. Myelin acts as an insulator that decreases the membrane permeability to ions. Because there is less flux of charge across the myelin, a local current can spread farther along an axon. Furthermore, the concentration of voltage-gated sodium channels in the myelinated region of axons is low. Therefore, action potentials occur only at the nodes of Ranvier, where the myelin coating is interrupted and the concentration of voltage-gated
sodium channels is high, Figure 2-5. As, action potentials jump from one node to the next as they propagate along a myelinated fiber, such propagation is called saltatory conduction.
Propagation via saltatory conduction is faster than propagation in non-myelinated fibers of the same axon diameter because less charge leaks out through the myelin-covered sections of the membrane. More charge arrives at the node adjacent to the active node, and an action potential is generated there sooner than if the myelin were not present. Moreover, because ions cross the membrane only at the nodes of Ranvier, the membrane pumps need to restore fewer ions. Myelinated axons are therefore metabolically more efficient than unmyelinated ones. In this way, myelin adds speed, reduces metabolic cost, and saves room in the nervous system because the axons can be thinner.
Figure 2-5, Adapted from (Widmaier et al. 2013 Fig. 6-23). Representation of the saltatory conduction. Concentration of voltage-gated sodium channels is low in the myelinated regions. Action potentials occur only at the nodes of Ranvier, where axon is bare and the concentration of voltage-gated sodium channels is high. Action potentials thus “jump” from one node to the next as they propagate along a myelinated fiber.
2.1.1.2 Physiology of the Human cortex
2.1.1.2.1 The cerebral cortex
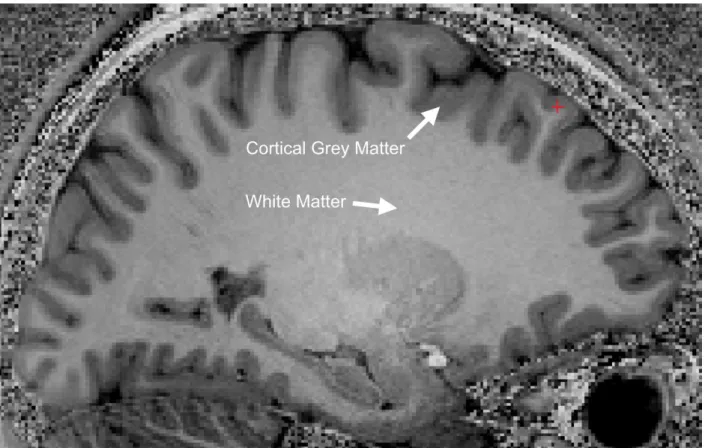
The cerebral cortex is the outer layer of the brain neural tissue, Figure 2-6. Is is often called cerebral Grey Matter (GM) because it appears darker than the inner neural tissue called White Matter (WM). Although GM is commonly used as a synonymous of cerebral cortex, it is important to notice that the term GM actually includes cerebral cortex along with others neural tissues such as the thalamus or spinal grey matter. Basically, GM can be used to design any neural tissue that includes neurons bodies and neurites. In this review GM will refer to the cerebral cortex.
Figure 2-6, MRI T1-w image, sagittal view. The cortical grey matter (GM) is the outer (dark) layer of the brain, while the inside white region is the white matter (WM).
2.1.1.2.2 Cortical composition: neurons and glial cells
In humans, the cerebral cortex is 2 to 4 mm thick. It contains the cell bodies and the dendrites of the cerebral neurons whereas the axons are found in the cerebral white matter. Moreover, neurons
account for only 28% of the cells in the cerebral cortex (Azevedo et al. 2009), the 72% remaning cells are the glial cells, also called neuroglial cells (glia = glue). Glial cells surround the soma, axons and dendrites, one of their role is to provide them with metabolic support. The main glial cells are the Astrocytes, Microglia, Ependymal cells and Oligodendrocytes, Figure 2-7. The Astrocytes help regulate the composition of the extracellular fluid and sustain the neurons metabolically, for example by providing glucose and removing ammonia. Astrocytes also stimulate the formation of tight junctions between the wall cells of the capillaries in order to form the so-called blood-brain barrier (BBB), which prevents toxins and other undesired substances to enter the brain. Microglia are macrophage cells that perform immune function in the cortex and in the central nervous system in general. Ependymal cells form the boundaries between the brain matter and the cerebrospinal fluid. Lastly, the Oligodendrocytes produce the myelin sheaths that cover the axons. As we saw in the precedent section, the myelin sheaths are essentials for the propagation on the actions potentials. Therefore, death of oligodendrocytes in a region of the cortex leads to a demyelination of axons that hampers the afferent communications between neurons. The demyelination processes and effects will be discussed in more details in the next section. So far, glial cells are known to play a secondary role in the information processing but they are critical for the synergy of the central nervous system. Moreover, as well as neurons, they are contributing to the MRI signal, thus, a change in the neuroglial composition implies a change in an MRI image.
Figure 2-7, Adapted from (Widmaier et al. 2013). Representation of the main glial cells of the central nervous system.
2.1.1.2.3 Cortical structure: layer based
The spatial organisation of neuron bodies is uneven in the cortex. A straightforward parcellation can be made by layer: the cortex can be divided in six layers where neurons bodies are found with differents shapes and concentrations. Cortical neuron come in two main forms: excitatory (pyramidal) and inhibitory (Azevedo et al. 2009). Commonly, a neuron ‘belongs’ to the layer in
which its body cell is sited, even if its dendrites span several more layers. Inhibitory neurons are in minority (20%) and have more diverses morphologies. Inhibitory neurons are known as local circuit neurons because they are purely intrinsic, i.e. they remain entirely in the cortex. Some pyramidal neurons are also intrinsic but others make short and long connexions with others parts of the CNS. Figure 2-8 shows a representation of the structural organisation of neurons through the differents layers of the cortex.