INNOVATIVE IN-SITU SNOW PARAME TER
SENSING SYSTEM ALLOWING ACCURATE
REMOTELY SENSED DATA CALIBRATION
FOR IMPROVED FORE CASTING OF HYDRO
POWER RESOURCES.
FINAL TECHNICAL REPORT.
FINAL TECHNICAL REPORT
CONTRACT N°: NNE5/2000/251 PROJECT N°: NNE5/251/2000 ACRONYM:SNOWPOWER
TITLE: 'Innovative In-situ Snow Parameter Sensing System Allowing Accurate Calibration of Remotely Sensed Data for Improved Forecasting of Hydro Power Resources'
PROJECT CO-ORDINATOR:
• FZK - Forschungszentrum Karlsruhe GmbH, Germany (partner 1) P ARTNERS (order according to contract):
• KTH - Kungliga Tekniska Hogskolan, Sweden (partner 2)
• SLF - Swiss Fed. Inst. for Forest, Snow, and Landscape Research as Part of Swiss Federal Research Institute WSL (partner 3)
• HQ - Hydro-Québec, Canada (partner 4)
• INRS - Institute National de la Recherche Scientifique, Canada (partner 5) • SOM - Sommer GmbH & Co. KG, Austria (partner 6)
REPORTING PERIOD : FROM 2001-01-09 TO 2004-31-08 PROJECT START DATE: 2001-01-09
Date ofissue ofthis report: 2004-29-10
DURATION: 36 Months
Project funded by the European Community under the '5th Framework Programme (1998-2002)'
Table of contents
1. PUBLISHABLE FINAL REPORT ... 2
1.1. EXECUTIVE PUBLISHABLE SUMMARY ... 2
1.2. PUBLISHABLE SYNTHESIS REPORT ... 2
2. DETAILED FINAL REPORT ... 4
2.1. OBJECTIVES AND STRA TEGIC ASPECTS ... 4
2.2. SCIENTIFIC ANDTECHNOLOGICAL DESCRIPTION OF RESUL TS ... 5
2.2.1. WP l 'Sensor development' ... 5
2.2.2. WP 2 'Laboratory trials' ... 7
2.2.3. WP 3 'Field tests oflaboratory set-up' ... 10
2.2.4. WP 4 'Hydrological modelling' ... 13
2.2.5. WP 5 'Development ofBench-scale instrument' ... 17
2.2.6. WP 6 'Field test of Bench-scale instrument' ... 21
2.2.7. WP 7 'Large-scale field test' ... 30
2.2.8. WP 8 'Dissemination ofresults' ... 37
2.3. AsSESSMENT OF RESUL TS AND CONCLUSION ... 37
2.4. ACKNOWLEDGEMENTS ... 40
2.5. REFERENCES ... 40
3. MANAGEMENT FINAL REPORT ... 41
3.1. LIST OF DELIVERABLES ... 41
3.2. COMPARISON OF INITIALL Y PLANNED ACTIVITIES AND WORK ACCOMPLISHED ... 41
3.3. MANAGEMENT AND COORDINATION ASPECTS ... 42
Part 1: Publishable Final Report
Confidential
1.1. Executive publishable summary
Non
The objective of the SNOWPOWER project is to increase the precision of filling prognosis of hydro power stations to at least 20% by calibrating remotely sensed data with ground truth data determined by new snow measurement methods. Potential benefits are high, and e.g. only a 10% gain in forecast precision for Switzerland would correspond to a yield of 1.6 TWh or 32 M€.
By now a new electromagnetic cable sensor and a new developed bench-scale instrument (BSI) for snow moisture and density measurements allowing a monitoring of an area of up to 2000 m2 and evaluation software has been developed in the laboratory. The software integrates an air gap correction algorithm and a reconstruction code of the electromagnetic signal that allows the deterrnination of a moi sture and density profile of the snow pack along the cable sensors.
Laboratory and field measurements during three winter periods (2001 - 2004), were carried out both at measurement sites in Switzerland (Davos) and Canada (Quebec) first with a laboratory prototype field system, consisting of a time domain reflectometry cable tester and an impedance analyser. Preliminary data of moisture and density were evaluated and compared to reference measurements in the concemed snow packs with excellent and promising results. Based on the experiences of the first winter campaign, a second campaign (winter 200212003) was launched where the measurement algorithms and the sensor installation methods were refined. During that time a bench-scale instrument, which replaced the laboratory field system, has been developed and was available for test measurements in the last winter period (2003/2004) at the Swiss test site.
Furtherrnore additional hydrological models and the corresponding forecast strategies for hydro power optimisation have been developed, so that the measured snow pack data on the ground can be used to calibrate remote sensing data (RADARS AT) and thus will significantly improve the water reservoir filling predictions.
Although another testing winter with the existing BSI is planned, the measurements already helped to improve snow hydrological models. Measurements on a catchment in Canada indicate that an improvement in precision of melt water run-off prediction of sorne what more than 20% has been achieved.
1.2. Publishable synthesis report
The main objective of the SNOWPOWER project was the efficiency enhancement of hydro power stations, which generate an ecologically very desirable type of energy
In this project we developed a method and created a device for snow density and snow liquid water content measurements which is innovative not only on the level of each single sensor but on method and system levels also. Beside the enhanced remote data calibration and better snow water equivalent (SWE) prediction, we achieved an overall improvement of the satellite data driven hydrologic computation.
Advances in snow hydrological modelling were achieved also. We got a better understanding of the start and development of snow melting processes and a better conversion of the measured physical data into snow properties distribution. We also obtained synergy results for the avalanche waming and flood prediction. This may also be developed for a better prediction of drinking water resources from snow covered areas. Finally the developed field installations and instrument fabrications including a remote control network help to make data collecting much easier.
The project consisted of 8 work packages (WP). First the development and laboratory production of the snow moi sture and density sensor in forrn of a Polyethylene-coated flat-band cable with copper conductors which acts as an electrical transmission line was carried out. The sensor cable was fabricated by a cable manufacturer specialised on the production of high quality cables for low temperatures and harsh environment conditions. The cables were configured and tested in the laboratory. Important cable characteristics for snow moisture and density determination such as the different capacities of the sensors were determined. Both low and high frequency measurements with
an impedance analyser and with a time domain reflectometer were used to determine the dielectric properties of snow. Based on these measurements an algorithm for the determination of snow density and snow liquid water content was established, improved and refined with real data of snow properties (dry and wet snow) during a first field campaign in the Swiss Alps. This field test confirmed the method and proved the suitability of the snow sensor system. Comparison with other reference measurement methods of density and water content measurements confirmed the accuracy of the method. This was the second milestone
The existing hydrological models from the project partners, such as HYDROTEL and ALPINE3D could considerably be improved and were extended to incorporate the ground truth data from the snow sensor and an interface to the snow sensor network software was developed. Major improvements have been achieved in EQeau, an algorithm for combining ground truth data with RADARSAT-l data, by integrating a new approach for a distributed estimation of punctual snow density measurements. The new method uses both multiple regressions (altitude and latitude) and spatial interpolation (inverse distance). From the results it can be concluded that the rigorousness of the image processing chain of RADARS AT data have been improved. The temporal variation of the radar signal during the winter is low but comparable from one data set to another. It was shown that the new approach for the spatial interpolation of the punctual snow densities measurements is reasonably efficient (R2 = 0.83). The improvement of SWE map accuracy of 6% was achieved using ScanSAR data from RADARSAT-l
An adequate installation method ensuring good stability of the sensor under windy conditions, thus minimizing the formation of an air gap around the sensor cable has been developed and an installation guide has been established. Following field experiments, a number of recommendations were identified for improving the quality of the coaxial cables used and for simplifying the design of the junction box between the sensor and the coaxial cables.
Based on the experiences with the laboratory prototype devices, a bench-scale instrument has been designed. This turned out to be most critical and time consuming work package since several problems were encountered during the project. At first the theoretical aspects of the technical realisation of measurements in the snow were assessed. To determine both density and water content of snow two electronic measurement techniques are necessary (Low-frequency Impedance Analysis and High frequency Time Domain Reflectometry Analysis). The system was designed to especially fulfil the requirements that are necessary when dealing with snow: wide range of temperature, low energy consumption and adequate for field use, i.e. light-weight and portable. The test of the bench-scale instrument (BSI) was carried out at the Swiss test site during the melting season in a third winter field campaign. As a conclusion of this test it can be stated, that the system worked failure-free for nearly 4 months in the harsh Alpine environment and has the potential to become an operational taol for the determination of large-scale snow pack density, liquid water content and snow water equivalent. Yet sorne fine-tuning of the system is still necessary to obtain reliable absolute measurement values. Therefore an adequate calibration with materials comparable to snow is indispensable.
A large-scale field test in Canada with the BSI could not be carried out as plarmed due to the delay of the BSI and climatic conditions. Therefore this work package had to be modified and measurements were carried out with the laboratory set-up. Nevertheless important investigations on the influence of temperature and dielectric mixing rule coefficient on the measurements that increase the accuracy of the method were obtained. It can be concluded that the integration of all available snow temperature measurements along the cable is the best method to provide a representative value of the cable temperature when strong variability in the temperature profiles are observed.
As a conclusion it can be stated that the new system has the potential to become an operational tool for the filling prognosis of hydro power stations and for calibrating remotely sensed data.
Part 2: Detailed Final Report Confidential 2.1. Objectives and strategie aspects
The main objective of the SNOWPOWER project is the efficiency enhancement of hydro power stations, which generate an ecologically very desirable type of energy. Thus it belongs as the central relevance to Key action 5.2.5 'Other renewable energies " because of its technical novelty, economic, environmental and social impact. It will contribute to the increase of the share of renewable energy in the European and global energy balance in producing electricity at a cost considerably under 0.15 €/kWh. Seven countries of the EU plus Switzerland and Norway operate hydro power stations where the catchments are under snow coyer in winter. Several other countries of the world have the same situation, especially in Canada where sorne of the world largest hydro power stations are fed with snow melt.
Electricity from water is the c1eanest energy transformation among the renewable sources. So, it addresses also the Key action 6.5.4 'Improving the efficiency ofnew and renewable energy sources'. Hydro power generation avoids emissions, any kinds, especially green house gases. Their efficiency enhancement is the best contribution to the global CO2 reduction as required by the Kyoto agreements. The project will contribute to the consumer satisfaction and quality of life with more electricity without air pollution. The hydro power stations already have a high technical efficiency without severe consequences to the environment. This potential will be remarkably enhanced by the water management improvement as result of the project.
The proposed solution for efficiency enhancement will be suitable for new and existing plants without any restrictions. There is no need of any hardware installations in the power plant itself. By this way the sustainable management and quality of water can also be improved. In this sense it contributes to the EU policy of sustainable use of water resources at catchment-scale. A certain synergy effect will be expected to this policy. In case of project success Europe will have a good competition position for the industrial marketing of the technology and the Canadian partners will benefit directly from use of the technology and from exploitation in North America. In addition a new market will be created for the equipment and Europe will benefit by the increased demand for skilled employment. The Society will also benefit from better flood prediction and avalanche warning as weIl as better management of the water flux both for energy generation and for environmental needs. Drinking water resources that are fed by snow covered catchments will benefit from improved prediction methods. This situation is relevant in the alpine regions of, Austria, France, Germany, Italy and Switzerland as weIl as in the Nordic regions of Scandinavia.
The proposed method is innovative not only on the level of each single sensor but on method and system levels also. Beside the enhanced remote data calibration and better snow water equivalent (SWE) prediction, we expect an overall improvement of the satellite data driven hydrologic computation.
Advances in hydrological modelling can be expected also. We want to get a better understanding of the start and development of snow melting processes and a better conversion of the measured physical data into snow properties distribution. It is obvious that we will get synergy results for the avalanche warning and flood prediction as weIl as a better prediction of drinking water resources from snow covered areas. Finally the intended field installations and instrument fabrications inc1uding a remote control network will help to make data collecting much easier.
2.2. Scientific and technical description of the results
Within the project work was carried out on all of the 8 Work packages. 17 of the planned 20 Deliverables could be issued completely, whereas 1 Deliverable could orny be issued partly and 2 could not be achieved due to a considerable delay in one Work package combined with seasonal reasons. 3 of the 4 planned Milestones could be achieved, whereas 1 Milestone could orny be fulfilled partly.
2.2.1 WP 1 'Sensor development'
The new measurement method for snow properties was originally developed at FZK and will be highlighted by the following explanation. To make this model easier to understand, we use a simplified mixing rule of snow as a mixture of ice (1), air (A) and water (W). Their parts together give the uniform measuring volume:
I+A+W=1 (1)
Mixing rules connect the volume parts and their dielectric coefficients El = 3.16 (at measuring frequencies> 1 MHz e.g. by Time Domain Reflectometry), EA= 1 and Ew = 83 (at O°C) respectively to the mixture dielectric coefficient EM.
(2) To solve the task for the three unknown parts (l, A and W) we need a second measurement of the mixture dielectric coefficient EM2. This second measurement is made at low frequency with an impedance analyser(e.g. at 1 kHz), where the coefficient ofice is EI2=103.
(3)
From (1), (2) and (3) one can determine l, A and W and calculate the snow density D.
D = I*Yi + W*Yw (4)
with Yi and Yw as the densities of ice and water respectively. The density has a distribution which will be volume integrated in order to achieve the Snow Water Equivalent (SWE), which is the product of snow density and snow depth and indicates the amount of water a snow pack would give if it was melted. SWE is the key parameter for forecasting ofwater resources in snow covered regions.
ln WP 1 the development and laboratory production of the snow moi sture and density sensor in form of a PE-coated flat-band cable with copper conductors (Fig. 1) which acts as an electrical transmission line was carried out. This included the development of an air gap correction algorithm and of a reconstruction code. First the electromagnetic field around the sensor structure was calculated for different moi sture and air gap conditions with a numerical calculation code existing at FZK. An optimal cross section was chosen after several sensor cable cross sections were investigated.
Figure 1 - Cable sensor with copper conductors visible
The sensor cable was fabricated by a cable manufacturer specialised on the production of high quality cab les for low temperatures and harsh environment conditions. Figure 1 shows the developed cable sensor. The cables were configured at FZK and the cable sensors were built and tested in the laboratory. Important cable characteristics for snow moisture and density determination such as the different capacities of the sens ors were detemlÏned.
Concerning the air gap correction algorithm, KTH first made literature studies about quasi-TEM mode propagation on multi-conductor transmission lines. Several questions regarding the possibility ofusing the proposed three-conductor cables were investigated, such as how the dominant part of the signal (which can be decomposed into one even and one odd mode) will look like when the cable is submerged in a homogeneous medium, how asymmetric air gaps affect the mode propagation along the cable wh en the modes will not be the simple even and odd modes or how the air gap with known typical shape can easily be described by a very small number of paran1eters.
A preliminary study of an elliptically shaped air gap, described with only one parameter, indicated that it is theoretically possible to recover both the snow perrnittivity and the air gap parameter, using data from one even mode experiment and one odd mode experiment. However, the stability of such a procedure, against measurement errors, has not yet been investigated.
As a tool for treating the problems related to these questions, FZK and KTH used a semi-analytical approach relying on the assumption that the flat conductors are embedded in an elliptically stratified environment. Thus, the boundaries insulation-air and air-snow are confocal elliptical surfaces around the conductors. The elliptical shape is a reasonably good approximation for the thin insulation, and it seems quite representative for the air gap. The size of the air gap has been defined as the distance insulation-snow at the middle of the broadside of the cable. Using quasi-TEM analysis, the reactive transmission line parameters for different values of the air gap and the dielectric constant of the snow have been calculated. The influence of the air gap increased with increasing dielectric constant. Exan1ples: A dielectric constant of 3 and an air gap of 1 mm correspond to a dielectric constant of 2.25 with no air gap. A dielectric constant of 1.5 and an air gap of 1 mm yields a dielectric constant of 1.4 with no air gap.
The reconstruction code for deterrnining snow profiles was developed at FZK. Both frequency and time domain methods were investigated and the so-called inverse problem was solved. An exact algorithm with Greens functions and an optimisation approach was considered. The possibilities and limitations of a Fourier transform of the measurement data from time to frequency domain and back were investigated. The reconstruction algorithm was coded and tested with artificial measurement data. Finally a new software for the convenient evaluation of the measurement data was written (GetMoisture). The algorithm for the reconstruction of the moisture profile of the cable sensors was integrated.
2.2.2 WP 2 'Laboratory trials'
To test and improve the snow moisture and density sensor a laboratory set-up was built. This included the mechanical design, writing software for instrument control and data acquisition and the selection of materials with dielectric properties comparable to snow. The sensor cable was buried in a tank with different materials simulating dielectric properties comparable to snow (Fig. 2 and Table 1).
Figure 2 - Laboratory set-up and tank used for calibration
Table 1 - Materials used for calibration with corresponding permittivities (I:M), measured low frequency capacity(CM) and transit time characteristics(T Mff A) of an electromagnetic TDR pulse.
Material IlM CM IpF/ml T .,!TA
Air 1.00 8.67 1
Sugar 2.01 16.49 1.317
Glass 3.18 24.6 1.559
Salt 3.20 24.54 1.572
Water 80 3.508
A computer progran1 was written to control a time-domain reflectometer (Tektronix I502B) and an impedance analyser (Hew/ett Packard 4192 A), acquire the electromagnetic impulse response of the sensor and process the data with the reconstruction code prepared. AlI program parts were integrated in the GetMoisture software code.
To assess the maximum errors in dielectric coefficient and air gap size, first of aU the cable parameters had to be deterroined. The industriaUy manufactured cables show tolerances in dimensions and in the dielectric constant of the coating. Therefore it is necessary to verify the cable parameters after the manufacturing process and correct the calculated transmission line parameters if necessary. In the case of the three-wire flat-band-cable sensor, the necessary correction procedure wiU be shown.
The flat-band cable can be represented by the equivalent circuit in Figure 3 with 3 capacities.
\
C
iii.
li C2~_ C2 II-C
1/2
C
1/2
+
+
BmC
3 IrFigure 3 - Cross cut of 3-wire-tlatband-cable and corresponding equivalent circuit.
Capacity Cl describes the electrical field lines from one wire through the dielectric medium to the other wire, whereas the capacities C] and C3 are derived from the series configuration of
coating-medium-coating.
The total capacity Cmi between the conductors is:
C
mi=
C
1+
--=--'=--=---
C2BmiC3C
2+
BmiC3(1)
For the determination of the unknown capacities Cl, C] and C3 one needs 3 measurements of the total
capacity in 3 different media. In this case we use measurements in air with Enli= 1, oil with Em] = 2.15 and water with Em3 = 80. From transit time measurements the corresponding pulse velocity Vi is
calculated. Assuming any but constant inductance L, the following equation yields the corresponding total capacities:
1
i = 1,2,3 (2)
v ---=== i - ~LCmi
The resulting non-linear equation system can be solved numerically for Cl. C] and C3• From transit
time both the pulse velocity and the total capacity Cm can be derived. The dielectric constant of the unknown medium yields from equation (1) as follows:
(Cm - CI )C2 Bm
=
--=--=-_....:...:...---=:.-C3(C2 -Cm
+CI
)(3)
For moi sture measurement techniques that are based exclusively on the determination of transit times, the absolute value of the inductance is not significant. Yet for further investigations, e.g. the determination of the spatial distribution of the capacity along a transmission line, it is necessary. From the measurement point of view the reflection of a pulse can be evaluated according to the following equation:
r=ZL-ZO (4)
ZL +Zo
with r as reflection coefficient (relationship of amplitude of transmitted and reflected pulse), ZL as characteristic impedance of the transmission line and Zo as basic impedance (mostly 50 Q).
ZL can also be determined in the frequency domain with a network analyser. To do this a cable of any length is provided with a short cut and with an open circuit and the corresponding input impedances
Zshort and Zopen are measured. The impedance is determined according to:
Z L
=
~
Z shortZ open (5)This procedure is sufficient for measurements at low loss cab les and with low precision demands. If aIl transmission line paran1eters L, C, R, and G are to be determined, it is necessary to deterrnine S11 and S]l of a piece of cable of known length and to do an inversion according to SOMLO (1993). The
crux ofthis procedure is the calibration of the networkanalyzer at the interface between coax-cable and flat-band cable. Furthermore the inversion algorithm is numericaIly instable at transmission line lengths that correspond to multiples of half the wavelength (BAKER-JARVIS et al. 1990). Therefore it is advantageous to determine L and C of a low loss cable with the time-domain reflectometry (TOR). A high frequency compatible resistance is connected to the end of a longer piece of cable. If
the load impedance matches the coax impedance ZL , then a generated TDR pulse that propagates along the cable is perfectly absorbed and no reflection occurs (GRIVET 1970). From the measurement of ZL and the corresponding v , the inductance can be deterrnined with equation (2) and the following (6):
z -
L-R+ JŒL G+jwC
with 0) as radian frequency.
(6)
As for the example of the three wire cable shown in Fig. 3, the results achieved with this method can be shown. The outer conductor is on mass potentia1 and only an excitation of the inner conductor takes place. So the three wire cable is run with one of three possible modes and can be regarded as two wire system. Therefore a description with the usual capacity - and inductance matrices of multi-wire systems is not necessary. Table 2 shows the results for a 1.93 m long cable immersed in different materials.
Table 2 - Measurement results of a three wire cable sensor with symmetrical excitation.
Medium t Single transit time Propagation velocity tell Capacity
[ns] [m/s] [pF/m]
Air 1 7,107 2,715 * 10' 1,218 17,48
Oil 2,15 9,676 1,994 * 10" 2,258 32,27
Water 80 26,773 7,209* 10 17,29 228,78
The inductance was determined from measurements of resistance and transit time in air. The effective dielectric constant Eeff corresponds to the dielectric constant of a homogeneous medium that is able to replace the stratified structure of coating and surrounding material without changing the propagation characteristics.
The measurement results lead to the values shown in Table 3. There is a good correlation between experiment and numerical field simulations achieved with the program MAFIA. The slightly higher deviation of the capacity C2 is due to the variation of the coating thickness caused by the
manufacturing process. Note that the values depend on both the cable thickness and the spacing. Table 3 - Equivalent circuit elements for thin (1.3 mm) and thick (3mm) three wire cable sensor.
Equivalent circuit Experiment MAFIA Experiment Experiment
element Thin cable Thin Cable Thick cable Thick cable
Small spacing Large spacing
CI 3,4 pF/m 3,4 pF/m 8,597 pF/m 2,947 pF/m
C2 323 pF/m 276 pF/m 111,189 pF/m 130,175 pF/m
C3 14,8 pF/m 15,3 pF/m 12,715 pF/m 17,852 pF/m
L 756 nH/m 741 nH/m 756 nH/m 756 nH/m
From these values the characteristic line of the cable sensor can be calculated. As expected, the transit time increases and the impedance of the transmission line decreases with increasing dielectric constant of the surrounding medium. Due to the relatively fast approximation of the impedance to the final value, it is unreliable to derive the moisture from the measurement of the amplitude of the reflected signal.
The performance of the reconstruction code un der various disturbing conditions was evaluated. The laboratory experiments confirmed a sufficient accuracy of the measurement system (e.g. not more than 2% uncertainty in the volumetric water content for air gap sizes less than 2 mm).
2.2.3 WP 3 'Field test a.) Swiss test site Davos
In WP 3 the snow sensor and the laboratory set-up was tested in the field and the results were compared with reference measurements.
At the beginning of project month 4 FZK and SLF/WSL set up four flat band cable sensors at the Davos Weissfluhjoch (WFJ)-test site in Switzerland at an elevation of 2550 m. A 10 m inclined flat-band cable was mounted for monitoring vertical variations in the snow properties in the run of the winter (Figure 3). To keep the band stable also during situations ofheavy wind and massive snow load three poles were positioned under the cable and a new suspension with two springs was tested to prevent the cable from ripping.
Both measures showed to be an important improvement compared to an earlier set-up, however, they were not able to solve the problems completely. In addition to the sloping cable sensor, three cables were placed horizontally on the snow coyer in the course of the winter to measure the spatial variability of the liquid water content and snow density, and especially for detecting water conducting zones during the main snowmelt. The first cable was laid out at a snow depth of 72 cm on Il th of December 200 1, the second at a snow depth of 117 cm on 28 J anuary 2002, and the third at a snow depth of 164 cm at the end of month 6. These cab les followed the natural settlement of the snow pack. No apparent problems arose regarding the placement of the horizontal cables, however, it is not clear if these cab les possibly interrupt or deviate the natural water flow in the snow pack. This issue was investigated in the second field test (2002/03) within WP 6 by conducting dye tracer experiments. The electronic measurement devices of the system (TDR cable tester, impedance analyzer HP 4092, PC) were placed in a shelter -10 m away from the flat-band cable (Fig. 3).
<.
"
Figure 3 - The cable sensor system at Weissfluhjoch Davos (2550 m): the sloping flat-band cable (left), and the electronic devices in the shelter (right).
The high frequency measurements started on Oecember Il, 200 1, whereas the low frequency measurements could not be ran before January 15, 2002, due to a technical problem. After that date, the measurements were running successfully. Only one major incident occurred when a heavy windstorm damaged one of the mountings. However, this damage was repaired immediately. Additional monitoring of snow pack properties at Weissfluhjoch/Davos was carried out during the whole winter. At the end of mon th 7, the impedance analyser for the low-frequency measurements broke down and could not be repaired. It was replaced at the beginning ofmonth 9, just in time before the melting period started. So the lack of data is not a severe problem for the data evaluation. The Davos measurements were stopped at the end of the melting period in month on June 22, when ail the snow on the measurement site was gone.
The signal traces resulting from the cable sensor were evaluated using the 'GetMoisture' software. The following snow parameters were deterrnined and compared to different reference methods: Bulk dielectric constant, bulk snow density and liquid water content (aIl mean values along the cable).
Figure 4 shows the rneasured densities and Figure 5 the rneasured liquid water contents with two horizontal cables of the snow pack in cornparison to manual reference rneasurernents.
500 400 o ... . .,.~'
.
' ........ 1.··' .. · ... · f~ 100 1.3.2002•
o o o o ••
•
Horizontal f1at·band cable 1 Horizontal f1at·band cable 2
Manual measurement for snow layer of cable Manual measurement for snow layer of cable
1.4.2002 1.5.2002 1.6.2002
Figure 4 - Measured density along the two horizontal cables during winter 2001/2002. Dots show manually
determined density of the corresponding snow pack layers. Due to a break down of the impedance analyser no data were available from late March to early May.
.;-E
10
- Horizontal flat-band cable 1 Horizontal flat-band cable 2 - Lysimeter outflow 2400 2000 Ê
.s.
~ 1600 ~ il 12001
0; z:.BOOS
.!! ::> E 400 il ~ o~~==~~~~~----~----~----~~~1LWo24-Apr 4-Mai 14-Mai 24-Mai 3-Jun 13-Jun 23-Jun
Figure 5 - Liquid water content (average value along two horizontal cables) during the melting period of spring
2002. Comparison with accumulated melt-water outtlow from the Iysimeter adjacent to the sensor.
For distinct situations, the reconstruction code was tested and sorne rnoisture profiles of the snow pack could be established. One exarnple is shown in Figure 6.
10 "; 8 2 13 May, 2002 17 May, 2002 0~~~L,---'----'---'---'---r---~ 2.5 5.0 7.5 10.0 12.5 15.0 17.5
Horizontal position along the flat-band cable (m)
Figure 6 - Spatial variability of liquid water content along horizontal flat-band cable 2 on 13 and 17 May 2002, The measurements yielded very good and plausible results. The correspondence with reference measurements on the site was excellent. ln general, the field test 2001102 of Work package 3 at WFJ/Davos showed that the measurement system has potential to become an automatic, unartended tool enduring harsh winter conditions (thick snow pack, low temperatures). With the exception of sorne weeks in December, where an erroneous setting prevented the impedance analyzer from running, and in April, where a break down of an internai electronic component forced us to replace the impedance analyzer, the system ran more or less failure-free throughout the entire winter season. However, with regard to the suspension and the set-up of the sloping flat-band cable a number of imperfections showed up, which were investigated and improved in WP 6.
b.) Canadian test site Quebec
Although not planned in WP 3 INRS and HQ, started preliminary field tests in December 2001 as an opportunity for the Canadian partners to get more familiar with the SNOWPOWER sens or and the measurement methodology. The Chapais experimental Farm of Agriculture and Agri-Food Canada (AAFC), south of Quebec City (Canada), was selected as the test site. Two 20 m long cable sensors were installed diagonally sloping on wooden posts, with one end on the ground surface and the other end at a height of 1.5 m. A temporary polyethylene shelter was installed to protect the coaxial connectors all winter long and to protect the instruments at the time of measurements (Figure 7).
The low- and high-frequency measurements were conducted on 9 different days during the winter. Snow properties were characterized regularly in the vicinity of the cab les. Meteorological data were acquired continuously by an automatic weather station.
The first data sets revealed the need for sorne technical adjustments. After that, the measurement system was satisfactory operational under our environmental conditions from February 15.
The low frequency measurements were quite different from those made by FZK and SLF at WFJ/Oavos, which was mainly caused by electromagnetic interferences with other sources (possibly radio waves).The high-frequency measurements from the TOR showed the expected variations from dry to wet snow. The air to snow transition zone was generally visible.
It was also observed that the cable sensors were ne ver completely covered by snow. The maximum snow depth measured near the low end of the cable was 53 cm. Measured snow densities ranged from 250 kg/m3 to 400 kg/m3
. The measured snow liquid water content in April reached 6%. Snow accumulated differently on both sides of the cable, due to the wind and melted earlier around the wooden posts, creating holes in the snow coyer. Finally, the weight of snow and ice was sufficient to bent the cable vertically and horizontally particularly at the end of the winter. These observations showed the need to consider better ways to obtain an optimal cable installation for next winter.
Furthermore the measurement algorithms was improved and refined with real data of snow properties (dry and wet snow). This frrst field campaign proved the suitability of the snow sensor system. Comparison with other measurement methods confirmed the measurement accuracy. This was the second rnilestone
2.2.4 WP 4 'Hydrological
modelling'-WP 4 already started in the first year and lasted until the end of the project. The existing hydrological .models from the project partners, such as HYOROTEL and ALPINE30 could considerably be improved and were extended to incorporate the ground truth data from the snow sensor and an interface to the snow sensor network software was developed.
a.) Contribution of the Canadian Partners
The Canadian partners INRS and HQ proposed the HYDROTEL hydrological model to be used with the SNOWPOWER instrument and EQeau (RADARSAT-l) to deterrnine the spatial distribution of Snow Water Equivalent (SWE). The HYDROTEL model is a distributed model which is able to update its spatial distribution of SWE from a network of snow survey stations. So, SWE and thickness of snow pack derived from SNOWPOWER data can immediately be used instead of the actual snow survey data, or in conjunction with them.
For the 2003-2004 winter season, a set of SNOWPOWER probes was installed at a watershed site south of Quebec City and bi-hourly measurements of snow depth and snow density were taken from rnid-February through the beginning of April. Weekly snow profiles including temperature, density, snow grain types and diameters were also obtained to test the probes. Previous studies showed that the French CROCUS mode! for snow pack simulation (Meteo-France) was able to simulate accurately the temporal evolution of the snow pack thickness as measured by a laser probe at three sites for three winter periods in Northem Québec (Savary, 2002). For this watershed, the second simulated stream flow peak and volume, without snow coyer updating, were too low. If the snow coyer is updated using the snow survey data of the Québec Oepartment of Environment, the simulated stream flows are quite sirnilar to the measured ones, so that the flood volume is approximate!y the same. In this specific case, simulations in which the snow survey data are replaced by SNOWPOWER data, snow sampler data taken at the SNOWPOWER site or daily simulated CROCUS data, even if added to snow survey data, did not lead to more accurate stream flow simulations. It can be noticed, however, that the frrst increase of stream flow as simulated from CROCUS data is more sirnilar to the measured stream flows than with the other ways of snow coyer updating. These results show the importance of snow coyer updating. In order to obtain very good results, great care should be taken for the choice of strategic
measurement sites with the largest spatial representativeness. Also, the SNOWPOWER site chosen for
practical reason was not ideal for snow cover updating, as it was located in an agricultural field.
An updating comparison was also tried for the main stream flow station in another watershed. Daily
SNOWPOWER data were then simulated using the French CROCUS (Météo-France) snow model. The CROCUS model was applied on the watershed using the available data at three meteorological stations in the mid-watershed sector to drive it. The CROCUS obtained values at those stations were then assumed to be SNOWPOWER probes values and used to update the state variables of the HYDROTEL model. The initial simulation, without snow cover updating, led to a clear underestimation of peak flows. Here, updating the snow cover from snow survey data does not lead to
results as good as for the first watershed. There is an increase of the simulated flows but they are still
too low wh en compared to the observed values. Another updating approach has been obtained by simulating daily values of SNOWPOWER probes at the actual SNOWPOWER site and at three more sites where meteorological stations exist for the center section of the watershed. In that case, the peak flow and volume of the first flood are much better simulated and the second ones are even better, the simulated peak flow being only slightly higher than the observed peak. Another simulation was tested in which the CROCUS values were assumed to be available only on the dates of the snow surveys. The result is similar to the one using daily CROCUS values and snow survey values. One can conclude that a more frequent availability of snow cover values of less than 15 days is not necessary, but as a matter of fact, the availability of daily data by the SNOWPOWER system is very important in case of heavy snowfalls or if intensive melting occurs after a snow survey made at intervals of two weeks and before a major flood event.
Conceming the application of EQeau, a spatial and temporal analysis of the signal variability over the La Grande watershed has been done. The backscattering coefficients were extracted from three (3)
RADARSAT-l SCN data set acquired in 2003-2004 but also in 2000-2001 and 2002-2003. It was
observed that no particular variation of the backscattering coefficients were associated with a specific land use class. Temporal variation of the mean signal during the win ter is generally equal or less than IdB but tbis could be observed for each data set. Generally, the backscattering coefficients are lower
in November and increase during the winter. The normal variation of the backscattering coefficients
with the angles of incidence is not completely eliminated using the temporal ratio for the angles below
23° and above 38°. Finally, the meteorological conditions at the moment of acquisition (rain, wet
snow) introduce significant variation of the backscattering signal.
Major improvements have been acbieved in EQeau, an algorithm for combining ground truth data with RADARSAT-l data, by integrating a new approach for a distributed estimation of punctual snow
density measurements. The new method uses both multiple regressions (altitude and latitude) and
spatial interpolation (inverse distance). The random mean square error could be minimized to 23 kg/m3
(former RMSE 37 kg/m3
) and a regression coefficient R2 of 0.83 could be achieved. The EQeau
software was then modified to run the new approach: read the Hydro-Quebec historic density measurements, caJculated the regression, read the MNA, applied the regression for each pixel, estimated the density for each pixel.
Using the new spatial interpolation approach for snow density as well as new filtering method (Lee)
and a re-sampling pixel size of 375 x 375 m ( instead of 50 m), it is now possible to explain 78% of
the variation of the SWE of the snow pack with an error of 29 mm. This value is better then the error
of39 mm of the former model. Figure 8 shows a comparison of the estimated and measured SWE with
300 é
l
200~
100 4-RMSE=31 mm R2=0.72 100 + 200 250 300 EEN mesuréFigure 8 - Comparison of estimated and measured Snow Water Equivalent.
It can be stated that the direct interpolation of the SWE measured in the field (method applied to densities) allows to explain 72% of the variation of the SWE with an error of 31 mm. So the add on of the radar image allows a 6% gain of information and 2 mm in precision. The maps of the SWE established with the modified EQeau model show a continuous spatial distribution in contrast to the former version. They also show a spatial gradient from East to West with much higher SWE data in the Eastern sector.
From the results it can be concluded that the rigorousness of the image processing chain of RADARS AT data have been improved. The temporal variation of the radar signal during the winter is low but comparable trom one data set to another. It was shown that the new approach for the spatial interpolation of the punctual snow densities measurements is reasonably efficient (R2 = 0.83). The improvement ofSWE map accuracy of6% was achieved using ScanSAR data from RADARSAT-l
b) Contribution ofSLF/WSL
The Swiss partner developed a distributed hydro-meteorological model (ALPINE 3D) designed for alpine and sub-alpine environment. Its purpose is to be used as a snowmelt runoff prediction tool in alpine catchments. ALPINE3D is built up by a number of sub-modules that have been developed and tested extensively in earlier work (SNOWPACK (Lehning et al., 2002), a snow model deve!oped at SLF originally for avalanche risk assessment; a vegetation model, adapted trom Koivusalo and Kokkonen (2002); a radiation distribution mode! (Fierz et al., 2003); and the groundwater-runoff module of PREY AH (Gurtz et al., 1999» .
ALPINE3D has been tested against snow and run-off data trom 2 watersheds where the SNOWPOWER sensor was installed. Figure 9 shows an example of simulated incorning shortwave radiation on a sunny day in January 2003 (12 p.m.) reflecting the great spatial variation due to topography realistically reproduced by the model.
2600 2500 2400 2300 2200 2100 2000 1900 193 ... ..,." . . . . . .
.
. , . . .' . ... .: ... , . " . ,. " ... ','~_~-ir--~::,-~-~=~~~;--\781
.5
780 780.5 191.5 779.5 779Figure 9 - Incoming shortwave radiation on the January 15, 2003 at 12 p.m.
700
600
A frrst approach for updating the simulated snow depth, or the SWE respectively, with actual snow measurements, such as data from the SNOWPOWER sensor, has been introduced into the mode\. This updating approach was tested for one winter season in a subalpine watershed in central Switzerland (Alptal). The test showed that the improvement of the SWE simulation strongly depended on the frequency of available measurements, as well on their location. With the (manual) snow measurements in the Alptal that were taken weekly at some places and monthly at others this updating of the SWE lead to a varying degree of improvement of the SWE simulation at various sites (Figure 10). Obviously, the method was quite rigid and produced an alteration of the snow coyer that was
somewhat overestimated. OveraIl, the coefficient of determination R2 for SWE and snow depth at aIl
15 locations and aIl measurements was only increased from 0.80 to 0.81 in this case. However, with the SNOWPOWER sens or providing SWE at an hourly or daily basis;it can be expected that su ch an updating algorithm becomes more efficient.
Figure 10 - Simulated (Iines) and manually measured (dots) snow depth (top) and SWE (bottom) for two selected sites in the Alptal catchment: a site with weekly measurements (Ieft) and a site with monthly measurements (right). The blue line shows the simulation without snow updating, and the red line represents a simulation with the updating routine.
2.2.5 WP 5 'Development of bench-scale instrument
This turned out to be the most critical and time consuming work package since several problems were encountered during the project.
At first the theoretical aspects of the technical realisation of measurements in the snow were assessed. To determine both density and water content of snow two electronic measurement techniques are
necessary (Low-frequency Impedance Analysis and High frequency Time Domain Reflectometry
Analysis). The system was designed to especially fulfil the requirements that are necessary when dealing with snow: wide range oftemperature, low energy consumption and adequate for field use, i.e. easy and portable. The system consisted of the following modules shown in Figure Il.
Controll Unit Impedance Analyser
Multi- (lA) Datacolletion
plexer 1 kHz - 300kHz
-
(MUX) Comunication Sensor-
1 Cable-.,.
Time Domain Reflectometer 1 (TOR) Power SupplyFigure Il - Modules for the bench-scale instrument
Conceming the low-frequency Impedance-Analysis, the first step for the development of the entire measurement system was the start of the design and configuration of the low-frequency impedance analyser. The measurement frequency is adjustable by software command and is generated by the DDS-method (direct digital synthesis). This measurement frequency is transformed to a measurement bridge, which is connected to the sensor cable. In the control unit, the magnitude and phase of the
resulting voltage in the bridge is evaluated, digitalised and calculated and displayed via an interface.
The technical specifications are as follows:
Power supply: 12 V dc
Operating temperature: - 40 oC +40°C
Measurement frequency: 1khz ... 300khz
Measurement range: 10 pF ... 4000 pF
Data display: Magnitude and phase of complex capacitance
Parameterization: Remote control of measurement program via seriai interface.
A detailed sketch of the set-up for the Impedance analyser module is shown in Figure 12.
Impedance Analyser
DDS - sinus Control-Unit
Oscillator Control
1 kHz-300 kHz Data processing
1
-+
1
1-
-
Measurement r-- Signal r--A/D-Sensor cable bridge processmg converter
1 Il 1 1 1 Powersupply 1
Figure 12 - Detailed sketch of impedance analyser module.
a.) Impedance analyser module
A test set up for experiments for the signal processing was conducted. Aiso experiments with the measurement bridge in relation to measurement object-frequency-measurement were carried out. The first laboratory test showed very good results conceming especially the capacitance measurements at the low frequency range between 1 and 50 kHz. Fig. 8 shows a comparison of the new lA and the HP 4192 for the capacitance measured depending on the frequency.
It was impossible to have the bench-scale instrument ready at the start of the second project win ter (2002/2003), and also the plan to test the device at the Swiss test site during the melting season in May 2003 could not be realized. But it was possible to test the bench-scale instrument in a test field at SOM. Despite the promising laboratory results, the field tests revealed some serious influences of electromagnetic radiation. The following problems were encountered:
The long cable with its shape had the effect of a very powerful antenna, so that influences from terrestrial signais occurred. These signais were mainly electromagnetic radiation as for example radio waves. Unfortunately no shielding could be applied to the cables, as the influences of the environment are the objects of investigation. Further more despite the performance of a four-point measurement the influences of the high capacitance connection cables could not fully be eliminated.
Figure 13 - Capacitor( left) versus flat-band cable (right). Blue: excitation, red: signal.
Figure 13 shows a comparison of the excitation and the detected signal for a perfect capacitor in the laboratory and for the flat-band cable sensor. The disturbances of the signal are cJearly visible. In fact
the peaks due to the disturbing influences could exceed the signal of interest. So an accurate measurement of the capacitance along a long cable in the field is not possible with this initial concept. Therefore an improved concept for the lA had to be developed which included a number of changes in technology. At first a new input amplifier was implemented, which was less sensitive to long cables and their capacitances as they are high for the connection cables. The second and major change was the application of a powerful filter. The best filter specifications conceming the problem had a Quadratur Synchron Demodulator Filter that was eventually chosen. This filter is very narrow banded and allows a direct output of the complex values. Thirdly aIl the relays were replaced by analogue
switches. And finally a more precise determination of voltage was installed.
The new concept had the advantages that it was less sensitive to the influences of the cable length. The input signal was extremely filtered and fully digital processed. Further more the instrument showed a better long term stability.
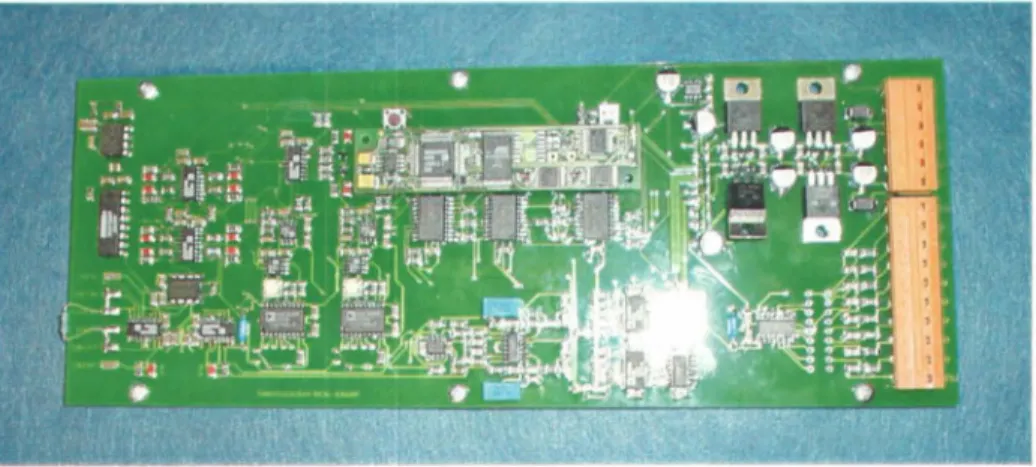
Yet there are to face a few drawbacks related with the setup such as a more complex structure, higher costs of the electronic components and an increase in the CUITent consumption compared to the initial concept. Figure 14 shows the circuit board of the new lA.
Figure 14 -Circuit board of improved lA
b.) Time Domain Reflectometry module
After detailed investigations of available TDR cable testers, a suitable TDR module was chosen and tested for application in the bench scale instrument. It was decided to use the Campbell Scientific TDR 100 since it fulfilled the described requirements (power consumption, ruggedness, field compatibility, etc.). After suitable configuration of the module, it was also tested in the field.
c.) Multiplexing module
The BSI was finally equipped with a multiplexing module which allows the selection of 4 connected flat band cable sensors. Figure 15 shows the final design of the BSI with the different interfaces for the cable sensors, TDR module, modem and communication.
Figure 15 - BSI with lA-module, Multiplexer and option for TOR module connection
d.) Control Unit
The main component is an Embedded Web Module - 16-Bit CPU 80186 with 20 MHz. This control
and communication unit supports TCP/IP, PPP, HTTP and FTP protocols. The measurement specific paramters are edited by browser access to ini-files. The data of every measurement is stored on a Compact Flash Card and if possible automatically send via FTP to a FTP-Server. The Compact Flash
Card allows to archive the data of a few month and can easily be replaced for data collection, if no
remote access is possible. Figure 16 shows the floating chart of the control and communication unit. With the BSI also 8 additional analogue inputs are available, e.g. for temperature measurements for air
temperature and snow temperature profiles or for ultrasonic snow depth measurements.
Figure 16 -Control unit -Measurement and Data storage
Finally the possible set-ups of the modules of the BSI (TDR, lA and multiplexing component (MUX»
in the field (illustrated in Figure 17) were discussed. It was decided to realize set-up 'C', which houses
all the modules in one small box that can be installed close to the flat-band cable sensors. Thus only short lengths of coaxial cables
«
6m) are required which improves the signal quality, reduces signal losses and simplifies the calibration procedure of the system.TOR '''A MUX A B C
Figure 17 - Possible arrangements (A, 8, C) ofTDR, lA and MUX of 8S1 in the field.
2.2.6 WP 6 'Field test of bench scale instrument
In WP 6, the second field campaign, originally the test of the bench-scale instrument (BSI) was planned. Due to the delay of WP 5, the BSI was not ready for installation at the beginning of the second winter. Therefore WP 6 had to be run with the laboratory-scale instrument set up. Learning from the experiences and problems of the first field campaign, we extended WP 6 with very important field tests concerning the sensor installation in the field and the interactions of the sensor with the snow pack properties. A lot of valuable data were collected and the installation of cable sensors as weil as the correct interpretation of the data could be significantly improved.
This WP was again carried out simultaneously at the Swiss and Canadian test sites. a.) Swiss test sites (Davos and Alptal)
At the beginning of month 15 FZK and SLF/WSL set up an 8 m sloping flat band cable sensor at WeissfluhjochiDavos (WFJ)-test site (CH) at an elevation of 2550 m for monitoring vertical variations in the snow properties in the run of the winter and to test a new installation method. To keep the band stable also during situations ofheavy wind and massive snow load this time no poles were used but the cable was mounted with a steeper sloping angle and with a specially designed brake suspension. Three additional flat-band cables were laid out horizontally during winter and were covered by snowfall. An
installation of a second sloping cable was carried out in April 2003 at Davos before the melting season with the aim of testing a different installation fixation and testing a new measurement algorithm which needs two sloping cab les with different angles. Due to serious problerns due to installation and disturbances of the measurements, the algorithm did not work and finally this approach was given up. The system uptime was high also in the second winter (80%). The automatic start of the measurements occasionally failed at the interface between the controlling PC unit and the Tektronix. This happened mainly at very low temperatures, so this rnight be a temperature problem of the electronic components of the Tektronix device, which was not built to operate under such low temperatures.
During the test at WFJ we closely inspected the behaviour of the snow band cable and the electronic
system under harsh alpine winter conditions. ln particular, the following critical components of the
system were exarnined:
• Suspension and set-up of the sloping cable
The original suspension, consisting of a wood en fastener attached with ropes to two iron springs, failed twice during the first winter: after a heavy wind storm in the second half of January, and towards the end of the winter season, wh en the snow load (maximum snow water equivalent: 740 mm)
became too heavy and a spring broke. Consequently, an improved suspension was designed for the
second winter consisting of a cylinder with a mechanical brake (Fig. 18), which kept a constant pressure on the cable. The suspension adjusted continuously when the snow load increased, by releasing the cable.
The sloping angle of the cable sensor is one of the key-factors for the formation of an air gap around the flat-band cable, as well as for the bending of the cable inside the snow pack.
In the frrst winter we set up the cable at an angle of 30° to the ground surface and tried to keep it in its
original position by fixing it on 3 vertical poles. Such poles, however, proved to have negative impacts
during the snowmelt by preferentially melting the snow and generating air gaps around the pole. Also
a sharp bend of the cable formed at the head of the mid-pole after snow pack settling during the
melting period (Fig. 19). In addition, the poles were not stable enough to withstand the heavy snow
load and bent considerably towards the end of the season. Consequently, for the second winter we
decided to set up the cable at a steeper angle (45°) and to omit the supporting poles. The steeper
installation reduced the snow load on the cable, and the cable was kept in its original position during
the whole winter. However, we noted increased flickering of the cable in moderate to high wind speeds in the absence of supporting poles. These movements of the cable most likely generated the large air gaps observed at the surface, and may have caused a cable failure during a snow storm in
January 2003. A further complication was a 90° twist of the cable around its own axes, which may
have increased the water flow along the cable (Fig 20). In the last winter season (2003/3004) the
sens ors where again mounted with springs and the cable was attached to gui ding ropes all along to the ground.
Figure 18 - Suspension of the snow cable sensor for winter 2001/02 (Ieft), winter 2002/03 (middle) and winter 2003/2004 (right).
This suspension has proven to be the most effective in ensuring good stability of the sens or under windy conditions, thus minirnizing the formation of an air gap around the sensor. Following field experiments, a number of recommendations were identified for improving the quality of the coaxial cab les used and for simplifying the design of the junction box between the sensor and the coaxial cables.
• Air gap problem
Air gaps along the flat-band cable are highly undesirable since they both falsify the electronic signal and may also transfer melting water preferentially along the cable. The influence of an air gap on the measurement results can be partially corrected with our correction method, but with respect to a potential preferential water transport along the cable it was crucial to thoroughly inspect the size of the air gap and evaluate its importance as water flow path.
At both sites the air gap showed up in different sizes and shapes, depending on wind speed, wind direction and melting intensity (Fig. 20). The assumption of a symmetric air gap, which is made in the correction algorithm, was not appropriate for many situations. There were dates (27 Feb, 2003; Alptal) where an up to 5 cm opening formed on one side of the band-cable, whereas the other side was in
close contact with the snow. At the WFJ site the air gap was mostly generated by wind. Hence, the
compass orientation of the flat band cable was decisive for the shape of the air gap. We also observed
that air gaps were able to fill up again when the wind conditions had changed. Our overall conclusion
was that the shape of the air gap at the snow surface was very dynamic and unpredictable. lnside the
snow pack, we did not fmd evidence for significant voids around the cable wh en we excavated the
flat-band cable at the sub-alpine site, Alptal, on March 1, 2003. This was at a stage when the snow
pack had settled to a density of 290 kg m-3 and liquid melt water had penetrated to the bottom of the
snow pack (Fig. 21).
Close inspection of the flat-band cable was also carried out to examine whether the snow-band had conducted melt-water preferentially during the snowmelt. A dye tracer had been applied 15 days
earlier (prior to the snowmelt) on the snow surface (area indicated in Fig. 16). A vertical profile was
excavated along the cable and perpendicularly at the lower end of the cable. No stained water was
detected at the lower end of the cable whereas to the left and right of the cable end considerable
stained are as were detected originating from lateral water transport along snow layers. There is
evidence that sorne dye did follow the cable for sorne distance before finding alternative flow paths to
the side of and below the cable, but we did not fmd indications of extensive lateral water flow
expressed in terms of intensely stained areas following the direction of the cable. We think that we can
conclude in general that water flow along the cable is not greater than the natural lateral water flow in the snow pack.
Concerning thermal effects of the sens or on the surrounding snow, we found sorne thermal radiation
effects of a horizontal cable only once, shortly after it was laid out on the snow surface and the coverage by fallen snow was only very shallow. But as soon as the cable was covered with more than 10 cm of snow, this effect was not found anymore.
Figure 19 -(left) Preferential melting around the supporting poles and formation of a sharp bend at the head of the pole in winter 2001/02. (right) Large air gap at the air-snow-interface of the twisted sloping cable in winter 2002/03.
Alptal, 12-Feb, 2003 Alptal, 27-Feb, 2003 Weissfluhjoch 12-Jan, 2003 sensor1 Weissfluhjoch 12-Jan, 2003 sensor2 Weissfluhjoch 20-Feb, 2003
Figure 20 -Observations of air gaps at the snow surface in the vicinity of the snow cable sensor.
Upper end of the nat-band cable
Tracer application
1
area 1 " , ,
• • • • . - • -~ .. I
Figure 21 - Dye tracer indicating the water flow paths during a melt event at the Alptal-site. (left) Front view at the cable end showing no dye tracer in close vicinity of the cable. (right) Vertical cross-section along the flat-band cable. Terrain slope-direction is indicated.
• Comparison of snow sensor measurements with manual measurements
Dielectric constant, bulk snow density, and liquid water content of snow pack (mean value along the cable) were again caJculated from the raw signaIs and the moisture distribution along one of the horizontal cables was reconstructed for different stages of the win ter. The natural settling of the snow cover was reflected niceJy in the horizontal cable measurements. The snow density increased from initially 100-200 kg m-3 to approximately 500 kg m-3 at the end of the winter season, which was in accordance with manual snow density measurements of the corresponding snow layers. The two cab les located at two different depths of the snow pack also reproduced correctly a higher density in the lower part of the profile in February (cable 1) and a faster compaction in the upper part during the snowmelt (cable 2). However cable 2 seemed to have systematically underestimated density, which we think may be explained by spatial differences in the measurement spots of cable and manual density measurements.
No liquid water was detected with the horizontal cables until the end of April, after that the snow pack
had reached its maximum depth. This is supported by the automated snow temperature measurements,
which indicate dry snow conditions and temperatures weil below zero before this period. Once the snowmelt set in, we measured the steadily increasing Iiquid water content with the horizontal cables indicating the downwards penetration of the wetting-front. The upper cable (no. 2) not only reflected an earlier and faster increase in liquid water content than the lower cable, it also reacted more clearly to the diurnal variation caused by melting during the day and refreezing during the night.