HAL Id: hal-01602578
https://hal.archives-ouvertes.fr/hal-01602578
Submitted on 26 May 2020
HAL is a multi-disciplinary open access
archive for the deposit and dissemination of
sci-entific research documents, whether they are
pub-lished or not. The documents may come from
teaching and research institutions in France or
abroad, or from public or private research centers.
L’archive ouverte pluridisciplinaire HAL, est
destinée au dépôt et à la diffusion de documents
scientifiques de niveau recherche, publiés ou non,
émanant des établissements d’enseignement et de
recherche français ou étrangers, des laboratoires
publics ou privés.
childhood and young adult brain tumors: A systematic
review and meta-analysis
Geneviève van Maele-Fabry, Laurence Gamet-Payrastre, Dominique Lison
To cite this version:
Geneviève van Maele-Fabry, Laurence Gamet-Payrastre, Dominique Lison. Residential exposure to
pesticides as risk factor for childhood and young adult brain tumors: A systematic review and
meta-analysis. Environment International, Elsevier, 2017, 106, pp.69-90. �10.1016/j.envint.2017.05.018�.
�hal-01602578�
Contents lists available atScienceDirect
Environment International
journal homepage:www.elsevier.com/locate/envint
Review article
Residential exposure to pesticides as risk factor for childhood and young
adult brain tumors: A systematic review and meta-analysis
Geneviève Van Maele-Fabry
a,⁎, Laurence Gamet-Payrastre
b, Dominique Lison
aaUniversité catholique de Louvain, Louvain Centre for Toxicology and Applied Pharmacology (LTAP), Avenue E. Mounier 53.02, B-1200 Brussels, Belgium bToxalim (Research Centre in Food Toxicology), Université de Toulouse, INRA, ENVT, INP-Purpan, UPS 180 chemin de Tournefeuille, BP 93173 Toulouse, France
A R T I C L E I N F O
Keywords: Child Brain tumors Residential exposure Pesticides Systematic review Meta-analysisA B S T R A C T
Background: Accumulating evidence suggests a positive association between exposure to non-agricultural pes-ticides and childhood brain tumors (CBT).
Objective: (1) To conduct a systematic review and meta-analysis of published studies on the association between residential/household/domestic exposure to pesticides and childhood brain tumors. (2) To clarify variables that could impact the results.
Methods: Publications in English were identified from a MEDLINE search through 28 February 2017 and from the reference list of identified publications. Risk estimates were extracted from 18 case-control studies published between 1979 and 2016 and study quality assessments were performed. Summary odds ratios (mOR) were calculated according tofixed and random-effect meta-analysis models. Separate analyses were conducted after stratification for study quality, critical exposure period, exposure location, specific exposures, pesticide category, application methods, type of pest treated, type of CBT, child's age at diagnosis and geographic location. Results: Statistically significant associations were observed with CBT after combining all studies (mOR: 1.26; 95% CI: 1.13–1.40) without evidence of inconsistency between study results or publication bias. Specifically, increased risks were observed for several groupings and more particularly for gliomas and exposure involving insecticides. Statistical significance was also reached for high quality studies, for all exposure periods, for indoor exposure and, more particularly, during the prenatal period for all stratifications involving insecticides (except for outdoor use), for pet treatments, forflea/tick treatment, for studies from USA/Canada and studies from Europe (borderline) as well as for data from studies including children of up to 10 years at diagnosis and of up to 15 years.
Conclusions: Ourfindings support an association between residential exposure to pesticides and childhood brain tumors. Although causality cannot be established, these results add to the evidence leading to recommend limiting residential use of pesticides and to support public health policies serving this objective.
1. Introduction
Descriptive epidemiology of childhood brain tumor (CBT) has re-cently been reviewed (Johnson et al., 2014). In the United States and Canada, brain and central nervous system (CNS) tumors are the most frequent solid tumors and the second leading cause of cancer-related death in children and adolescents 0 to 19 years of age (Kaderali et al., 2009; Siegel et al., 2013). In Europe, primary tumors of the CNS are the second most common (after leukemia) and the most lethal childhood tumors in children 0 to 14 years old (Gatta et al., 2014; Steliarova-Foucher et al., 2004). CBT include several histologic subtypes, each
with a different incidence rate according to age (higher incidence rates observed in children 0 to 4 years of age in USA and Europe), country (overall incidence varies from 1.12 cases to 5.26 per 100,000 persons in Kuwait and in USA), gender (more common in males) and ethnicity (for review, seeJohnson et al., 2014). The higher incidence rate of child-hood brain tumors occurring before the age of 5 suggests that both prenatal and early postnatal exposures may be especially important.
Improved survival after a diagnosis of CNS tumor recorded over the past 40 years can mainly be attributed to earlier detection and advances in treatment (e.g., surgical techniques, rational use of postoperative radiation and chemotherapy) (Arndt et al., 2007; Wells and Packer,
http://dx.doi.org/10.1016/j.envint.2017.05.018
Received 20 September 2016; Received in revised form 19 May 2017; Accepted 19 May 2017
⁎Corresponding author.
E-mail address:genevieve.vanmaele@uclouvain.be(G. Van Maele-Fabry).
Abbreviations: ASTRO, astroglial brain tumors; CBT, childhood brain tumor; CNS, central nervous system; CYPs, cytochrome P450s; 95% CI, 95% confidence interval; D, 2,4-dichlorophenoxy acetic acid; ICCC, international classification of children cancer; ICD, international classification of diseases; MA, meta-analysis; mOR, summary odd ratio estimate; OC, organochlorine; OP, organophosphorus; OR, odds ratio; PNET, primitive neuroectodermal tumors; SE, standard error; 95% UI, 95% uncertainty interval
0160-4120/ © 2017 Elsevier Ltd. All rights reserved.
2015).
However, despite these medical progresses and decades of epide-miological research, the etiology of CBT remains largely unclear. A multifactorial process involving genetic and environmental factors is the most likely explanation. It has been suggested that associations with parental exposure to toxicants during pregnancy may differ with polymorphisms in genes metabolizing these toxicants. As an example, positive associations were observed between both paternal and ma-ternal smoking during pregnancy and childhood brain tumors such that children with a greater PAH activation genotype were at a higher risk relative to children with wild type genotype (Barrington-Trimis et al., 2013). Dubuc and collaborators recently reviewed major cytogenetic and genomic aberrations associated with the most common pediatric brain tumors (medulloblastoma, ependymoma, supratentorial primitive neuroectodermal tumors, and pilocytic astrocytoma) and described advances in the understanding of the epigenetics of brain tumors (Dubuc et al., 2010, 2012). Established CBT risk factors are limited to ionizing radiation exposure and to some cancer syndromes including neurofibromatosis types 1 and 2, tuberous sclerosis, nevoid basal cell carcinoma, Turcot, Cowden, hereditary retinoblastoma and Rubinstein-Taybi syndromes. Many potential risk factors have been studied with inconclusive results, including anthropometric factors (birth weight, birth length, head circumference, maternal age), developmental and birth characteristics (birth defects, premature birth, parity, single or multiple birth, as examples), parental exposures during pregnancy (smoking, alcohol, vitamin intake, folic acid intake, medication, dietary N-nitroso compounds), parental occupational exposures (electro-magneticfields, pesticides), head injuries, allergic conditions (atopy), infectious exposures (Johnson et al., 2014; Vienneau et al., 2016).
For years, pesticides have been specifically scrutinized in this re-spect. Several literature reviews on pesticide exposure and childhood cancer have been published the last ten years (Infante-Rivard and Weichenthal, 2007; Infante-Rivard, 2008; Nasterlack, 2006, 2007; Turner et al., 2010; Van Maele-Fabry et al., 2010, 2011, 2013; Wigle et al., 2009, as examples). Environmental exposure to pesticides is of particular concern for children as they are particularly vulnerable due to physiological and behavioral characteristics (greater food or fluids intake per body weight,“hand-to-mouth” activity, as examples) that can increase the dose and toxicity as compared to adults (Karr et al., 2007; Moya et al., 2004; Roberts et al., 2012). Children can be exposed to pesticides indirectly from parental pesticide exposure via occupa-tional and para-occupaoccupa-tional (“take-home”) exposure. Two meta-ana-lyses (MA) suggest some support for a positive association between paternal and parental occupational exposure to pesticides and child-hood brain tumors, respectively (Van Maele-Fabry et al., 2013; Vinson et al., 2011). Children can also be directly exposed to pesticides from residential/household/domestic uses. The main sources of such pesti-cide exposures include professional pest control services, indoor uses (in homes, schools, and other buildings), outdoor uses (in garden, public areas, agricultural application drift), handling treated or con-taminated pets or others (use of insecticidal shampoos for lice infesta-tion, as examples) (Zahm and Ward, 1998). Indoor broadcast applica-tions can leave lingering residues in the air, carpet, toys and house dust (Deziel et al., 2015). The present work analyzes the possible association between residential/household/domestic exposure to pesticides and childhood brain tumors.
While most epidemiological studies on the relationship between childhood pesticide exposure and brain cancer were considering par-ental occupational exposures, there were fewer studies assessing re-sidential exposures. Several were of small size and the results were inconsistent. Recently, three MA combined results on childhood brain tumors following residential exposure to pesticides (Chen et al., 2015; Kunkle et al., 2014; Vinson et al., 2011). Two of which examined the association with several childhood cancers, including brain cancer (Chen et al., 2015; Vinson et al., 2011) and one focused on childhood brain cancer with regard to parental farm-related pesticide exposure
during pregnancy (Kunkle et al., 2014). Very few results fromVinson et al. (2011)related CBT to residential exposures, most of them fo-cusing on occupational exposures and occupational or residential ex-posures combined. The MA ofChen et al. (2015)concerned exclusively postnatal exposure (children as exposure group); and in the MA of Kunkle et al. (2014), only scarce data for non-agricultural exposure are reported.
The purpose of our study is to systematically review and to meta-analyze the available epidemiological data on the relationship between residential pesticide exposure and childhood brain tumors. We aim to enhance our understanding of the potential involvement of residential exposure in the etiology of CBT by exploring several variables as po-tential sources of heterogeneity in results: the quality of the studies, the sources of pesticide exposure and exposure location, critical exposure periods, specific pesticide category, application methods, type of pest treated, specific exposures, type of CBT, child age at diagnosis and geographic location.
2. Materials and methods
The systematic review and MA was conducted according to the protocol described in details in previous publications by our group (Van Maele-Fabry et al., 2010, 2011, 2013) and followed the available guidelines, including PRISMA (Liberati et al., 2009) and PRISMA-P (Moher et al., 2015) statements for reporting systematic review and MA. It has to be stressed that these guidelines do not cover all the complexities associated with reporting systematic reviews in the pe-diatric population. A study protocol for the development of guidelines for conducting and reporting of systematic reviews and MA in newborn and child health research (PRISMA-Children [C] and PRISMA-Protocol for Children [P-C]) is being developed and the final statements are expected to be published in 2017 (Kapadia et al., 2016).
2.1. Study identification and selection 2.1.1. Study identification
The search strategy was designed to identify all English-language observational studies on childhood brain tumors and residential pesti-cide exposure published in the open literature in peer-reviewed jour-nals. An electronic search on MEDLINE (National Library of Medicine, Bethesda, MD) was conducted for the period 1966 to 28 February 2017 using“(pesticides OR herbicides OR insecticides OR fungicides) AND ((children OR childhood) AND brain tumors) AND (residential OR do-mestic OR household)”. This was supplemented by single or multiple combinations of the words pesticide(s), herbicides, insecticides, fungi-cides, child, children, childhood, infant, newborn, preschool child, adolescent, youth, teenage, tumors, cancer, neoplasm, astroglial, as-trocytomas, glial, primitive neuroectodermal, embryonal, intracranial, residential, household, domestic, indoor, outdoor with no restriction of publication type or publication date. The reference lists of the relevant publications and review papers were also checked for additional stu-dies.
2.1.2. Study selection
Studies using a cohort and a case-control design, that referred to children exposed to pesticides from residential use (indoor or outdoor), with (subtypes of) brain tumors as the outcome were considered eli-gible. Studies not published in English, published in the grey literature, that did not report original results (reviews, MA, case-reports, com-ments, letters, editorials, and abstracts), experimental and ecological studies, focusing only on genetic data, that clearly examined a specific cancer type other than brain cancer as well as those dealing with no residential exposure, e.g. exposure resulting from agricultural drift or those reporting data for farm-related exposures were excluded.
The screening step was performed by evaluating the titles and ab-stracts of the studies identified by the electronic search. The full text of
potentially relevant studies was then examined. We excluded redundant studies (with subjects already included in another more complete or more recent study examining a greater number of subjects or with longer follow-up duration) to preserve the assumption of independence. Studies combining adults and children with no separate reporting of children data as well as studies providing insufficient data to determine an estimator of relative risk and its confidence intervals for childhood brain tumors were also excluded from the MA.
2.2. Data extraction
A structured abstract was derived from each eligible study identi-fied. Abstracted information were: the first author's last name, pub-lication year, geographic location, study name, period of diagnosis, child age at diagnosis, exposure category and source of exposure data, exposed person, period of exposure, tumor type and source of tumor definition, number of exposed cases and controls, risk estimates and the corresponding 95% confidence intervals as well as variables adjusted for in the analysis. Two authors (GVM-F and LG-P) read the report and independently extracted and tabulated the most relevant risk estimators with their 95% CIs. The results of this exercise were compared between the authors and consensus was obtained before the MA.
An overall MA including data from all case-control studies was performed and is illustrated by a forest plot. In subgroup analyses, summary estimates were calculated for stratifications defined by study quality (high quality, low quality), exposure windows (prenatal, childhood), exposure location (indoor, outdoor), specific exposure (professional pest exterminator, pet treatments), biocide category (in-secticides, herbicides, fungicides), application methods (spray/bomb, strip, collar, shampoo), type of pest treated (termite, lice,flea/tick), brain tumor type (gliomas, embryonal tumors), geographic location (USA/Canada, Europe, others), age at diagnosis (0–10 years, 0–15 years, 0 up to > 15 years).
2.3. Quality assessment
Study quality was assessed for all included studies by two authors (GVM-F and LG-P) by using a modified version of theDowns and Black (1998)checklist (Supplemental Material Table 1). Because this tool was developed mainly for randomized clinical trials, the checklist was modified byWigle et al. (2009)by adding new assessment factors fo-cusing on the quality of exposure assessment (robustness of exposure measurement, variability of exposure intensity or duration, and speci-ficity) and the ability to identify exposure windows (preconception, pregnancy, childhood). Before conducting the quality assessment, both reviewers discussed the individual items of the checklist to clarify their interpretation and differences in quality assessment were resolved by consensus.
2.4. Statistical analysis
Odds ratios of individual case-control studies were combined. Summary risk estimates were calculated according to a fixed-effect model (the Mantel-Haenszel method), which assumes that results across studies differ only by sampling error, and to the random effect model described by DerSimonian and Laird (1986), which incorporates the additional variability due to between-study variance.
The between-study heterogeneity was assessed using chi-square-based Q-test and the I2statistic. A low P value from the chi-squared test
indicates statistically significant heterogeneity, and, the I2
statistic lying between 0% and 100%, a value of 0% indicates no observed hetero-geneity and larger values show increasing heterohetero-geneity (Deeks et al., 2011; Higgins et al., 2003). Potential sources of heterogeneity were evaluated by subset analyses.
The potential for publication bias was explored by the funnel plot graphical method and the linear regression asymmetry test suggested
by Egger and collaborators (Egger et al., 1997). An asymmetric plot suggests a possible publication bias, and a P value for Egger's test of < 0.05 was considered to be representative of statistically significant publication bias. The statistical analyses were performed using Excel software and the forest plot using“R”.
To determine the robustness of thefindings as well as to determine whether some of the selections made had a major effect on the results, sensitivity analyses were conducted by:
- performing the MA of all studies using bothfixed and random effect methods;
- removing studies with partial redundancy (Pogoda and Preston-Martin, 1997andSearles Nielsen et al., 2010, alternately) - omitting the studies reporting extreme risk estimator values (the
highest [Gold et al., 1979] and the lowest [Searles Nielsen et al., 2005]);
- re-estimating the mOR after including data from different sources of comparison (friends or cancer controls inDavis et al., 1993 and normal or cancer controls inGold et al., 1979)
- re-estimating the mOR while dropping one study out at a time and examining whether any study disproportionately influenced the results.
3. Results
3.1. Study selection and characteristics
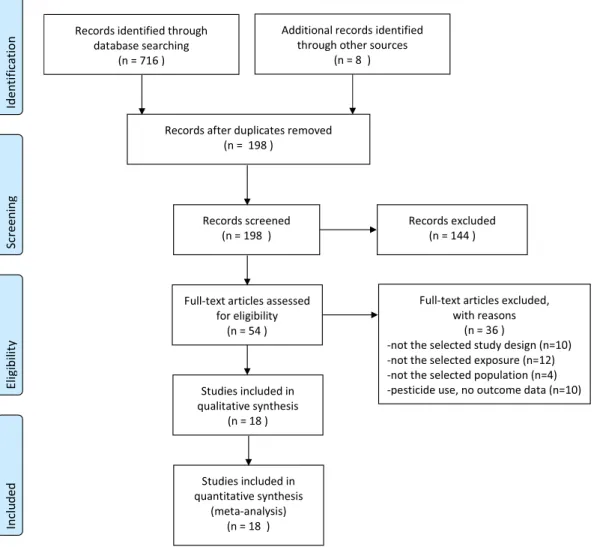
A total of 18 studies were identified for inclusion in the MA after the selection process as reported in theflow-diagram ofFig. 1. After ad-justing for duplicates, 198 studies were retained for further evaluation. Of these, 144 were excluded after preliminary screening as they did not fulfil the inclusion criteria with regards to the language (not in English; n = 12), the study design (not cohort nor case-control studies; n = 47), the exposure (not residential, combining occupational and residential exposures, not pesticides; n = 21), the population (not children, com-bining data for children and adults; n = 3), outcome (no brain tumors data, n = 39). Experimental/mechanistic/genetic studies were also excluded (n = 4) as well as exposure studies (n = 11). Seven additional studies were off topic. After this screening process based essentially on titles and abstracts, 40 studies were retained for further evaluation. Of these, 36 were excluded for the reasons reported inFig. 1.
No cohort study fulfilling the inclusion criteria was retrieved. The 18 studiesfinally selected for the review were all case-control studies (Bunin et al., 1994; Chen et al., 2016; Cordier et al., 1994; Davis et al., 1993; Gold et al., 1979; Greenop et al., 2013; Howe et al., 1989; Kuijten et al., 1990; Leiss and Savitz, 1995; McCredie et al., 1994; Pogoda and Preston-Martin, 1997; Preston-Martin et al., 1982; Rosso et al., 2008; Schüz et al., 2001; Searles Nielsen et al., 2005; Searles Nielsen et al., 2010; Shim et al., 2009; Spix et al., 2009).Table 1provides the main characteristics of the studies included in the analysis. These studies were published between 1979 and 2016, twelve were from USA, 3 from Europe, 2 from Australia and 1 from China. Children and young adults included in these studies were diagnosed with brain tumors between 0 and 10 years (6 studies), 0 to 15 years (7 studies) and 0 to > 15 years of age (5 studies). Exposure data varied greatly among studies. Exposure occurred prenatally (n = 13) and postnatally (n = 12), pesticides were used indoor (n = 14) and outdoor (n = 6). The great majority of stu-dies reported data for insecticide use (n = 10) while use of herbicides and fungicides was less addressed (n = 3 and n = 2, respectively). Most studies presented data for brain tumors in general and only 6 specified the type of brain tumors. The number of variables that were adjusted/ matched for were also very different from one study to another (Table 1).
3.2. Quality assessment
Quality scores are presented in Supplemental Material Table 2. Total scores ranged from 6.5 to 15.5 with a median value of 10.5 (maximum score of 20). No tendency to higher quality scores was ob-served in more recent studies. Compared with lower total quality score studies, those with higher total scores tended to have higher scores for factors related to exposure measurement and, to a lesser degree, to bias control (Supplemental Material Table 2).
3.3. Synthesis of results
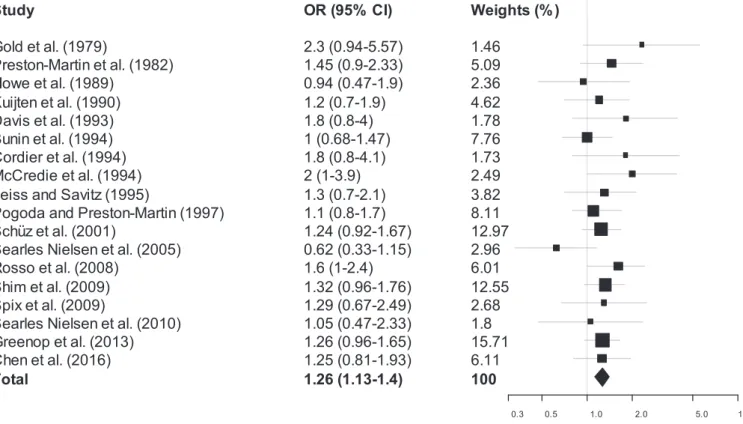
The results of the MA are reported inFig. 2and inTable 2. A sta-tistically significant association between residential exposure to pesti-cides and childhood/young adults brain tumors was observed, without evidence of inconsistency between studies, when the main data of all studies (n = 18) were combined (mOR: 1.26, 95% CI: 1.13–1.40; I2:
0%). A forest plot of these studies is shown inFig. 2. Estimated effects of all studies except three (Howe et al., 1989; Bunin et al., 1994; Searles Nielsen et al., 2005) were on the same side of the unit line and the confidence intervals overlap to a large extent. This plot shows a low level of heterogeneity.
Subgroup analyses were also performed within strata hypothesized a priori to influence the overall result as well as the indicators of be-tween study results heterogeneity and inconsistency. These data are reported inTable 2. With the exception of the combined data for the fungicides category and for the lice as pest treated, all summary risks (mOR) were higher than 1 and for the majority of stratifications, no
indication of between study inconsistency (I2: 0%) was observed.
Sta-tistical significance was reached for several groupings. Significant in-creased risks were observed for high quality studies, both exposure time windows (prenatal, childhood). Indoor exposure, and more particularly during the prenatal period, showed a significantly increased risk. All stratifications involving insecticides showed statistically significant in-creased risks, except outdoor insecticides (insecticides [all studies, prenatal, childhood]; indoor insecticides). The highest mORs were ob-served for the specific exposure “pet treatments” and for the type of pest treated“Flea/tick”. Significant increased risks were also observed when combining studies reporting data on gliomas (gliomas all studies and prenatal), for the stratification by geographic location when grouping studies from USA/Canada and studies from Europe (borderline) as well as for data from studies including children of up to 10 years at diagnosis and of up to 15 years.
3.4. Publication bias
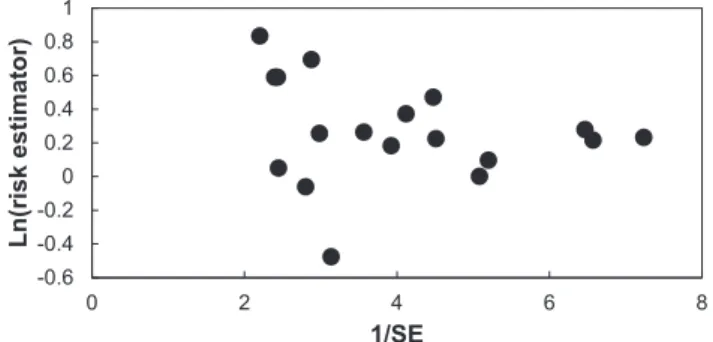
A funnel plot of ln(OR) versus 1/SE for the MA including all studies for residential exposure to pesticides and childhood brain tumors was constructed (Fig. 3). Assessment of publication bias using the funnel plot did not demonstrate any obvious publication bias: the visual in-spection of thisfigure does not clearly detect asymmetry arising from a lack of small studies with low risk estimators. The statistical analysis provided by the linear regression method ofEgger et al. (1997)did not yield evidence of asymmetry (intercept: 1.023; 95% CI: −0.6129 to 2.659) (p > 0.20).
Table 1 Summary from relevant case-control studies dealing with residential exposure to pesticides and childhood brain tumor. References/geographic location/ study design/period of diagnosis Child's age Exposure category (source of exposure data) Exposed person Period of exposure Tumor type° (source of tumor de fi nition) Number of exposed cases/controls Odd ratio°° (95% CI) Adjustment/matching Bunin et al., 1994 USA/Canada Population-based case-control study “Children's Cancer Group ” 1986 –1989 < 6 years Household exposures: -Use of insect sprays or pesticides Mother Pregnancy ASTRO 34/26 1.5 (0.8 –2.7) Matching by race, birth year, telephone area code and pre fi x. ASTRO: adjusted for income level; PNET: unadjusted -At least weekly 8/4 2.2 (0.6 –7.4) -Home pest extermination 24/31 0.7 (0.4 –1.4) Household exposures: -Use of insect sprays or pesticides Mother Pregnancy PNET 31/39 0.7 (0.4 –1.4) -At least weekly 5/5 1.0 (0.2 –4.9) -Home pest extermination 34/33 1.0 (0.6 –1.9) Household exposures: -Use of insect sprays or pesticides Mother Pregnancy CBT 65/65 ⁎ 1.0 (0.68 –1.47) ⁎ -At least weekly 13/9 ⁎ 1.46 (0.62 –3.47) ⁎ -Home pest extermination 58/64 ⁎ 0.89 (0.60 –1.31) ⁎ (Questionnaire: parental telephone interviews) (Biopsy [not for all cases]; pathologist) Chen et al., 2016 Shanghai (East China) Hospital-based case-control study 2012 –2015 0– 14 years Household exposures: Types of pesticides -Mosquitocide Family use After conception CBT 63/47 1.68 (1.06 –2.6) Matching by sex, age, province of residence. Adjusted for age, sex, household income, maternal education level, and province of residence -Cockroach killer 58/40 1.83 (1.13 –2.95) -Rodenticide 23/26 0.92 (0.50 –1.70) -Mothproof agent 75/70 1.25 (0.81 –1.93) -Flea/tick killer (questionnaire: mother interview at the hospital) (Pediatric neurosurgery of 2 children's medical centers in Shanghai) 19/16 1.29 (0.64 –2.60) Urinary pyrethroid-total metabolites quartiles (cis -DCCA + trans -DCCA + 3-PBA): Q1 (< 0.82 μ g/g creatinine) 20/42 Referent Q2 (0.82 to < 1.65 μ g/g creatinine) 23/43 1.12 (0.54 –2.34) Q3 (1.65 to < 4.25 μ g/g creatinine) 46/43 2.25 (1.14 –4.42) Q4 (> 4.25 μ g/g creatinine) Remark: also data for the three individual metabolites quartiles 72/42 3.60 (1.87 –6.93) [p -trend: 0.009] Cordier et al., 1994 France (Paris, Ile de France) Part of a multicentric population-based case-control 0– 15 years House treated with pesticides Mother Pregnancy (1 month before pregnancy to birth) CBT 18/21 1.8 (0.8 –4.1) Frequency-matched for year of birth. Adjusted for child's age and sex and for maternal age (continued on next page)
Table 1 (continued) References/geographic location/ study design/period of diagnosis Child's age Exposure category (source of exposure data) Exposed person Period of exposure Tumor type° (source of tumor de fi nition) Number of exposed cases/controls Odd ratio°° (95% CI) Adjustment/matching study (SEARCH) coordinated by IARC 1985 –1987 Child Childhood (at least 1 month total before the age limit) 31/36 2.0 (1.0 –4.1) Rem: homes treated for pests by professional exterminators: OR = 0.9 (questionnaire: mothers, face to face interviews, completed with fathers acting as interpreter if mothers could not understand French) (Hospital records; CAT-scan for all cases but not biopsy for all [73%]) Davis et al., 1993 Missouri (USA) Population-based case-control study 1985 –1989 0– 10 years Pesticides used for nuisance pests Family use Pregnancy CBT 30/nr 1.8 (0.8 –4.0) Adjusted for child's age at diagnosis, child's exposure to environmental tobacco smoke, family income, father's and mother's education, family member in the construction industry, time between diagnosis and interview 0– 6 months (birth to 6 months) 28/nr 1.9 (0.8 –4.3) 7-diagnosis 38/nr 3.4 (1.1 –10.6) Pesticides used on pets Pregnancy 11/nr 0.9 (0.4 –2.0) 0– 6 months 10/nr 1.0 (0.4 –2.5) 7-diagnosis 21/nr 1.1 (0.5 –2.6) Insecticides used in the garden or orchard Pregnancy 11/nr 1.5 (0.6 –3.9) 0– 6 months 7/nr 2.3 (0.7 –8.3) 7-diagnosis 22/nr 1.6 (0.7 –3.6) Herbicides used on the yard Pregnancy 12/nr 1.1 (0.5 –2.5) 0– 6 months 15/nr 1.7 (0.7 –3.9) 7-diagnosis 30/nr 2.4 (1.0 –5.7) Application methods: -Spray (bomb) Pregnancy 5/nr 2.1 (0.5 –8.3) -Strip Pregnancy 8/nr 5.2 (1.2 –22.2) -Collar (fl ea collar used on pets) Pregnancy 16/nr 1.0 (0.4 –2.1) -Shampoo: Kwell ® [lindane] used on lice 7-diagnosis 7/nr 4.6 (1.0 –21.3) -Shampoo used on pets Pregnancy 10/nr 0.8 (0.3 –1.9) Type of pest treated: -Termites 7-diagnosis 12/nr 1.4 (0.5 –3.9) -Lice 7-diagnosis 8/nr 1.3 (0.4 –4.1) -Flea/tick (collar used on pets) Pregnancy 16/nr 1.0 (0.4 –2.1) (Questionnaire: mother telephone interview + mailed packet containing a handout to improve recall) (population-based Missouri Cancer Registry [MCR]; 89% histologically con fi rmed) (2 control groups: friends and cancer co. data reported for friends co) Gold et al., 1979 Baltimore, [Maryland] (USA) Exploratory case-control study 1965 –1975 < 20 years Extermination for insects in the household (insecticides) Child Prior to diagnosis CBT Discordant pairs (case-control) 16 (+ − )/7 (− +) 2.3 (0.94 –5.57) ⁎ Matched on sex, date of birth, race. (Questionnaire: parental interview on exposure to several possible (Hospital diagnostic listings, death certi fi cates, hospital (2 control groups: normal [non-(continued on next page)
Table 1 (continued) References/geographic location/ study design/period of diagnosis Child's age Exposure category (source of exposure data) Exposed person Period of exposure Tumor type° (source of tumor de fi nition) Number of exposed cases/controls Odd ratio°° (95% CI) Adjustment/matching etiologic agents) tumor registries, and pathology, radiotherapy and clinical oncology records) diseased] children and cancer children, data reported for normal co) Greenop et al., 2013 Australia (all 10 pediatric oncology centers), Nationwide case-control study “Aus-CBT, The Australian Study of Childhood Brain Tumors ” 2005 –2010 0– 14 years Professional pest control treatment in the home or garden: any treatment Mother Before (the year before pregnancy) CBT 72/187 1.54 (1.07 –2.22) Matched on age, sex, State of residence. Adjusted for matching variables, year of birth, maternal age, child's ethnicity, parental education, maternal pre-pregnancy folate supplementation Pregnancy (during) 46/116 1.52 (0.99 –2.34) 0– 3 months nr 0.76 (0.27 –2.15) 4– 6 months nr 1.30 (0.68 –2.50) 7– 9 months nr 2.13 (0.99 –4.60) Prenatal (before + during pregnancy) 118/303 1.26 (0.96 –1.65) ⁎ Child After birth 93/303 1.04 (0.75 –1.43) Treatment in this period only Mother Before 23/46 1.90 (1.08 –3.36) Pregnancy 5/18 1.02 (0.35 –3.00) Child After birth 44/165 0.84 (0.56 –1.26) Person home during treatment Father Before 12/29 1.79 (0.85 –3.80) Mother Before 23/81 1.13 (0.66 –1.96) Pregnancy 19/49 1.53 (0.83 –2.82) Prenatal nr 1.23 (0.75 –2.01) Child After birth 38/9 1.63 (1.02 –2.60) Any treatment Mother Before Gliomas: low-grade 33/187 1.58 (0.97 –2.57) Pregnancy 22/116 1.54 (0.87 –2.71) Child After birth 44/303 0.99 (0.64 –1.53) Mother Before Gliomas: high-grade 7/187 2.99 (0.99 –9.02) Pregnancy 6/116 4.58 (1.39 –15.14) Child After birth 7/303 1.25 (0.45 –3.43) Mother Before EP (ependymomas 6/187 2.34 (0.74 –7.42) (continued on next page)
Table 1 (continued) References/geographic location/ study design/period of diagnosis Child's age Exposure category (source of exposure data) Exposed person Period of exposure Tumor type° (source of tumor de fi nition) Number of exposed cases/controls Odd ratio°° (95% CI) Adjustment/matching Pregnancy 3/116 1.90 (0.45 –7.97) Prenatal 9/303 1.48 (0.61 –3.61) ⁎ Child After birth 6/303 1.32 (0.44 –3.99) Mother Before All gliomas (low-grade + high-grade + EP) 46/187 1.27 (0.87 –1.87) ⁎ Pregnancy 31/116 1.38 (0.88 –2.16) ⁎ Prenatal 77/303 1.31 (0.95 –1.82) ⁎ Child After birth 57/303 0.97 (0.69 –1.38) ⁎ Mother Before Embryonal tumors 18/187 1.13 (0.58 –2.20) Pregnancy 14/116 1.58 (0.76 –3.27) Prenatal 32/303 1.45 (0.89 –2.35) ⁎ Child After birth 28/303 1.17 (0.66 –2.05) Mother Before Germ cell tumors 4/187 0.91 (0.22 –3.67) Pregnancy 0/116 nd Child After birth 3/303 0.31 (0.07 –1.39) Type of pest treated: -Any termite treatment Mother Pregnancy CBT 4/18 1.06 (0.33 –3.41) -Any general treatment for spider/insects Mother Pregnancy CBT 31/86 1.50 (0.90 –2.48) (Questionnaires: written and telephone interviews) (pediatric oncology centers) Howe et al., 1989 Toronto and municipality of York: southern Ontario (Canada) Exploratory case-control study 1977 –1983 < 20 years Contact with herbicide, insecticide, etc. Child Prior to diagnosis CBT 19/38 0.94 (0.466 –1.90) Adjusted for age at diagnosis (Questionnaires: in person interviews with the mothers and whenever possible when the father was present) (hospital diagnostics, histologically veri fi ed) Kuijten et al., 1990 Pennsylvania, New Jersey and Delaware (USA) Population-based case-control study 1980 –1986 < 15 years Exposure to household insecticides Mother Prenatal (1 month before pregnancy until child's birth) ASTRO Discordant pairs (case-control) 38 (+ − )/33 (− +) 1.2 (0.7 –1.9) Matched for age, race, telephone area code and exchange (Questionnaire: mothers and fathers interviews; if father unavailable, proxy interview with the mother) (tumor registries of 8 hospitals) Leiss and Savitz, 1995 Denver area [Colorado] (USA), Population-based case-control study 1976 –1983 < 15 years Use of home pest extermination [residence ever exterminated for insects or pests so that family had to leave the house for a few hours] Mother Exposure period 1 [3 months prior to birth] CBT 8/27 1.3 (0.7 –2.1) Matched by age, sex, geographic location (telephone exchange area). Adjusted for age at diagnosis, father's education, per capita income, residential stability, mother's age, maternal race, (continued on next page)
Table 1 (continued) References/geographic location/ study design/period of diagnosis Child's age Exposure category (source of exposure data) Exposed person Period of exposure Tumor type° (source of tumor de fi nition) Number of exposed cases/controls Odd ratio°° (95% CI) Adjustment/matching maternal smoking, wire code and/ or year of diagnosis when these factors proved to be confounders Child Exposure period 2 [birth through 2 yrs. prior to diagnosis] 12/45 1.4 (0.6 –2.7) Child Exposure period 3 [2 yrs. prior
diagnosis through diagnosis]
5/22 1.1 (0.4 –3.0) Yard treatment [ever treated with insecticides or herbicides] Mother Exp. per. 1 12/79 0.6 (0.3 –1.1) Child Exp. per. 2 17/118 0.5 (0.2 –0.9) Child Exp. per. 3 16/98 0.5 (0.4 –0.8) Pest strips [ever used “hanging pest strips in the home ”] Mother Exp. per. 1 10/26 1.5 (0.9 –2.4) Child Exp. per. 2 13/47 1.4 (0.7 –2.9) Child Exp. per. 3 9/37 1.8 (1.2 –2.9) (Questionnaire: parental interviews) (Colorado Central Cancer Registry and area hospital records) McCredie et al., 1994 New South Wales: Sydney, Wollongong, Newcastle (Australia) Part of a multicentric population-based case-control study (SEARCH) coordinated by IARC 1985 –1989 < 15 years House treated for pests Family In month before and during pregnancy CBT (primary malignant brain tumors or cranial nerves) 20/24 2.0 (1.0 –3.9) Matched by sex and age. Adjusted for father's schooling Professional pest exterminators Family In month before and during pregnancy 15/24 1.31 (0.64 –2.65) ⁎ (Questionnaire: mother face-to-face interview + some fathers) (NSW Central Cancer Registry + histological con fi rmation of the diagnosis) Pogoda and Preston-Martin, 1997 Los Angeles County [California], (USA) Population-based case-control study: Los Angeles County component of the “US West Coast childhood brain tumor study ” 1984 –1991 < 19 years Nuisance pest Mother Prenatal CBT (primary tumor of the brain, cranial nerves, or cranial meninges) 106/97 1.1 (0.8 –1.7) Adjusted for the matching variables: gender, age, birth year Type of lawn and garden pesticide: -Insecticides 26/20 1.3 (0.7 –2.4) -Herbicides 2/3 0.9 (0.1 –6.1) -Fungicides 0/2 nd Type of pest treated: -Termite 5/2 2.7 (0.5 –14.2) -Lice 2/0 nd -Snail killer 21/18 1.1 (0.6 –2.1) -Flea/tick 76/53 1.7 (1.1 –2.6) Application methods: -Spray/fogger 17/6 10.8 (1.3 –89.1) -Shampoo/dip 47/33 1.2 (0.6 –2.5) -Collar 54/39 1.1 (0.5 –2.1) Nuisance pest Child Childhood 150/146 1.0 (0.6 –1.5) Type of lawn and garden pesticide: -Insecticides 57/47 1.2 (0.8 –2.0) (continued on next page)
Table 1 (continued) References/geographic location/ study design/period of diagnosis Child's age Exposure category (source of exposure data) Exposed person Period of exposure Tumor type° (source of tumor de fi nition) Number of exposed cases/controls Odd ratio°° (95% CI) Adjustment/matching -Herbicides 4/4 1.2 (0.3 –4.9) -Fungicides 1/8 0.12 (0.02 –0.95) ⁎ Type of pest treated: -Termite 23/32 0.7 (0.4 –1.3) -Lice 38/50 0.6 (0.4 –1.0) -Snail killer 41/38 1.0 (0.6 –1.8) -Flea/tick 106/102 1.0 (0.7 –1.4) (Questionnaire: in-person interview of the mothers and follow-up of the population-based case-control study by phone interview between 1994 and 1995) (From cancer registry in each area) Preston-Martin et al., 1982 Los Angeles County [California], (USA) Population-based case-control study 1972 –1977 < 25 years Pesticides used often or occasionally Mother Index pregnancy CBT (tumor of the brain or cranial meninges) Discordant pairs (case-control): 42(+ − )/29 (− +) 1.45 (0.90 –2.33) ⁎ Matched on sex, race and birth year Home treated by exterminators 10 (+ − )/10 (− +) 1.0 (0.42 –2.40) ⁎ Had contact with pesticides often or occasionally Child Childhood 26 (+ − )/24 (− +) 1.08 (0.62 –1.89) ⁎ Home treated by exterminators 36 (+ − )/42 (− +) 0.86 (0.55 –1.34) ⁎ (Questionnaire: telephone interview of the mother) (from The Los Angeles County Cancer Surveillance Program; microscopically con fi rmed) Rosso et al., 2008 USA/Canada Comprehensive case-control study: “Children's Cancer Group protocol E21 ” 1991 –1997 < 6 years Fathers' hobbies: gardening or lawn care using insecticides (whether or not) Family (?) Prenatal (one month before and during pregnancy) MB (medullo-blastoma) or PNET 105/67 1.6 (1.0 –2.4) Matched on area code, race, date of birth. Adjusted for father's race, geographic location, date of interview, child's age at interview, proxy interview conducted, child's gender, father's smoking status, child's birth season < 1/month 82/49 1.7 (1.0 –2.7) > 1/month 23/18 1.3 (0.6 –2.7) Lawn care Child After birth (from birth until reference age) 111/70 1.7 (1.1 –2.6) < 1/month 79/52 1.6 (1.0 –2.7) > 1/month 31/18 1.8 (0.9 –3.6) (questionnaire: telephone interview of the mother and as many fathers as possible (registered with the Children's Cancer Group) Schüz et al., 2001 (Lower Saxony in the northwestern part of Germany [LS study] as well as in West Germany [WG study]) Pooling of 2 population-based case-control studies 1988 –1993; 1992 –1994 < 15 years Use of household insecticides: -1/year Child Before diagnosis CBT (all CNS tumors) 22/96 1.38 (0.84 –2.25) Matched on gender, age-group, year of birth. Adjusted for degree of urbanization and socioeconomic status -> 1/year 38/164 1.19 (0.81 –1.77) -All (1/year and > 1/year) 60/260 1.24 (0.92 –1.67) ⁎ Use of household insecticides: ASTRO 8/96 2.45 (1.09 –5.47) (continued on next page)
Table 1 (continued) References/geographic location/ study design/period of diagnosis Child's age Exposure category (source of exposure data) Exposed person Period of exposure Tumor type° (source of tumor de fi nition) Number of exposed cases/controls Odd ratio°° (95% CI) Adjustment/matching -1/year -> 1/year 6/164 0.58 (0.23 –1.49) -All 14/260 1.15 (0.65 –2.04) ⁎ Use of household insecticides: -1/year EP 2/96 1.51 (0.34 –6.79) -> 1/year 5/164 1.69 (0.63 –4.54) -All 7/260 1.37 (0.61 –3.08) ⁎ Use of household insecticides: -All Gliomas (ASTRO + EP) 21/260 1.21 (0.75 –1.96) ⁎ Use of household insecticides: -1/year MB 5/96 1.14 (0.44 –2.95 -> 1/year 8/164 1.06 (0.49 –2.28) -All 13/260 1.07 (0.59 –1.93) ⁎ Use of pesticides in garden CBT 60/290 0.94 (0.68 –1.29) ASTRO 16/290 0.91 (0.48 –1.71) EP 5/290 0.71 (0.27 –1.89) Gliomas 21/290 1.05 (0.65 –1.67) ⁎ MB 13/290 0.81 (0.43 –1.53) (Questionnaire: mailed and subsequent telephone interview of both parents when possible) (German Childhood Cancer Registry) Searles Nielsen et al., 2005 Seattle-Puget Sound region of Washington State (USA) Population-based case-control study 1984 –1991 < 20 years Home pesticide treatment Mother or children Pregnancy or childhood before diagnosis CBT (primary tumors of the brain, cranial nerves or meninges) 20/57 0.62 (0.33 –1.15) ⁎ Matched by sex and age (Questionnaire: interview of the mother) (Cancer incidence registry affi liated with the NCISEERP) Searles Nielsen et al., 2010 Seattle-Puget Sound region of Washington State, San Francisco-Oakland area and Los Angeles county of California (USA) Population-based case-control study “U.S. West Coast CBT Study ” 1984 –1991 ≤ 10 years Chemical treatment of home for insect pests Family Pregnancy (1 month before conception until birth) CBT (primary tumors of the brain, cranial nerves or meninges) 55/60 1.41 (0.93 –2.15) ⁎ Matched by age and sex Childhood (birth until diagnosis) 46/94 0.60 (0.40 –0.92) ⁎ Insecticides for home, yard, garden, pets or lice Pregnancy 61/48 1.05 (0.47 –2.33) ⁎ Childhood 60/46 1.45 (0.69 –3.05) ⁎ Fleas or ticks Pregnancy 33/19 1.77 (0.89 –3.54) ⁎ Childhood 33/22 1.47 (continued on next page)
Table 1 (continued) References/geographic location/ study design/period of diagnosis Child's age Exposure category (source of exposure data) Exposed person Period of exposure Tumor type° (source of tumor de fi nition) Number of exposed cases/controls Odd ratio°° (95% CI) Adjustment/matching (0.75 –2.88) ⁎ Nuisance pests Pregnancy 43/39 0.90 (0.46 –1.76) ⁎ Childhood 41/40 0.74 (0.38 –1.41) ⁎ (Questionnaire: maternal in-person interview of the mother) (SEER registries) Shim et al., 2009 Florida, New Jersey, New York excluding NY city, Pennsylvania “U.S. Atlantic Coast Childhood Brain Cancer Study ” 1993 –1997 < 10 years Ever used pesticides for gardens and lawns (application by anyone including professionals): -Insecticides Parental + others 2-yr period before child's birth First primary brain cancer: ASTRO Discordant pairs (case-control): 52(+ − )/39( − +) 1.3 (0.9 –2.0) Matched by race, birth year, state of residence at the time of case diagnosis. Adjusted for maternal education PNET 25(+ − )/23( − +) 1.1 (0.6 –1.9) Other types 26(+ − )/23( − +) 1.2 (0.7 –2.0) CBT (Astro + PNET + others) 103(+ − )/85( − +) ⁎ 1.21 (0.91 –1.62) ⁎ -Herbicides ASTRO 53(+ − )/27( − +) 1.9 (1.2 –3.0) PNET 26(+ − )/24( − +) 1.0 (0.6 –1.8) Other types 25(+ − )/28( − +) 1.0 (0.6 –1.8) CBT 104(+ − )/79( − +) ⁎ 1.32 (0.96 –1.76) ⁎ -Fungicides ASTRO 13(+ − )/7( − +) 1.8 (0.7 –4.6) PNET 8(+ − )/6( − +) 1.3 (0.5 –3.8) Other types 11(+ − )/5( − +) 2.6 (0.9 –7.6) CBT 32(+ − )/18( − +) ⁎ 1.78 (1.00 –3.17) ⁎ Father applied pesticides for garden and lawns: -Insecticides Father ASTRO 28(+ − )/26( − +) 1.0 (0.6 –1.8) PNET 20(+ − )/19( − +) 1.0 (0.5 –1.9) Other types 20(+ − )/10( − +) 2.3 (1.0 –5.0) CBT 68(+ − )/55( − +) ⁎ 1.24 (0.87 –1.76) ⁎ -Herbicides ASTRO 40(+ − )/20( − +) 2.0 (1.2 –3.4) PNET 21(+ − )/18( − +) 1.1 (0.5 –2.0) Other types 15(+ − )/18( − +) 1.0 (0.5 –2.0) CBT 76(+ − )/56( − +) ⁎ 1.36 (0.96 –1.92) ⁎ -Fungicides ASTRO 3(+ − )/1( − +) 3.1 (0.3 –30.0) PNET 4(+ − )/1( − +) 3.6 (0.4 –32.6) Other types 8(+ − )/3( − +) 3.3 (0.9 –13.0) CBT 15(+ − )/5( − +) ⁎ 3.00 (1.09 –8.25) ⁎ Mother applied pesticides for garden and lawns: -Insecticides Mother ASTRO 18(+ − )/18( − +) 1.0 (0.5 –1.9) PNET 6(+ − )/8( − +) 0.7 (0.3 –2.2) Other types 10(+ − )/12( − +) 0.9 (0.4 –2.2) CBT 34(+ − )/38( − +) ⁎ 0.90 (0.56 –1.42) ⁎ -Herbicides ASTRO 13(+ − )/7( − +) 1.9 (0.7 –4.8) PNET 6(+ − )/7( − +) 0.8 (0.3 –2.5) (continued on next page)
Table 1 (continued) References/geographic location/ study design/period of diagnosis Child's age Exposure category (source of exposure data) Exposed person Period of exposure Tumor type° (source of tumor de fi nition) Number of exposed cases/controls Odd ratio°° (95% CI) Adjustment/matching Other types 5(+ − )/13( − +) 0.4 (0.1 –1.1) CBT 24(+ − )/27( − +) ⁎ 0.89 (0.51 –1.54) ⁎ -Fungicides ASTRO 10(+ − )/6( − +) 1.7 (0.6 –4.8) PNET 5(+ − )/3( − +) 1.6 (0.4 –6.9) Other types 9(+ − )/3( − +) 3.4 (0.9 –12.6) CBT 24(+ − )/12( − +) ⁎ 2.00 (1.00 –4.00) ⁎ (Questionnaire: telephone interview of the mother) (cancer registries) Spix et al., 2009 41 administrative districts in the vicinity of 16 nuclear power plants (West-Germany) Case-control study 1993 –2003 < 5 years Exposure to herbicides or pesticides in residence, garden or agriculture Birth weight < 2500 g Since conception CBT (central nervous system tumor) 14/65 0.39 (0.18 –0.83) Matching criteria: nuclear power plant region, sex, age, year of diagnosis All weights 88/204 ⁎ 1.29 (0.67 –2.49) ⁎ (Questionnaire: telephone interview of the mother) (German Childhood Cancer Registry) Abbreviations: yr(s), year(s); nr, information not reported; nd, not de fi ned (could not be calculated); co: controls; Study: Aus-CBT, The Australian Study of Childhood Brain Tumors; CAT-scan, computer-assisted tomograp hy-scan; cis -DCCA, cis -3-(2,2-dichlorovinyl)-2,2-dimethylcyclopropane carboxylic acid; trans -DCCA, trans -3-(2,2-dichlorovinyl)-2,2-dimethylcyclopropane carboxylic acid; 3-PBA, 3-phenoxybenzoic acid; NCISEERP, National Cancer Institute's Surv eillance, Epidemiology and End Results Program; NSW, New South Wales; SEER, Surveillance, Epidemiology and End Results: ASTRO, astroglial tumors, astrocytomas; CBT, cran ial/childhood brain tumor; CNS, central nervous system tumors; EP, ependymomas; MB, medulloblastoma; PNET, primitive neuroectodermal tumors; ICCC, the International Classi fi cation of Childhood Cancer; ICD, the International Classi fi cation of Diseases; ICD-O, the International Classi fi cation of Diseases for oncology. Notes °:Tumor types included in the studies: Bunin et al., 1994 : ICD-O site code 191. Astrocytoma (astrocytic glioma, glioblastoma multiforme, mixed glioma with astrocytic elements or glioma not otherwise spec ifi ed); PNET (medulloblastoma, CNS neuroblastoma, ependymoblastoma, pineoblastoma); CBT (astrocytoma + PNET). Chen et al., 2016 : childhood brain tumors (glioma, medulloblastoma, choroid plexus papilloma, craniopharyngioma, ependymoma, teratoma, pineoblastoma, primiti ve neuroectodermal tumor). Cordier et al., 1994 : intracranial tumor (astrocytoma, medulloblastoma, ependymoma, other gliomas, neuroblastoma, other types and unspeci fi ed). Davis et al., 1993 : ICD-O site code 191. Astrocytomas, medulloblastomas and a mix of other cancer types. Gold et al., 1979 : astrocytoma, medulloblastoma, ependymoma, pontine glioma, glioblastoma multiforme, optic gliomas, other cell types and unspeci fi ed cell types. Greenop et al., 2013 : low grade gliomas, high grade gliomas, embryonal tumors (including medulloblastomas, primitive neuroectodermal tumors [including pineal], aty pical teratoid rhabdoid tumors. Howe et al., 1989 : malignant tumors (ICD-O; 1976) except melanotic neuroectodermal tumors (benign) and neoplasms uncertain. Glyoma, ependymoma, astrocytoma, spo ngioblastoma glioblastoma oligodendroglioma, medulloblastoma, neuroblastoma, meningioma (! = toutes les tumeurs observes dans l'étude, pas seulement suite à exposition aux pesticides! Kuijten et al., 1990 : Astrocytomas [astrocytoma, glioblastoma multiforme, mixed glioma with astrocytic elements or brainstem glioma]. Leiss and Savitz, 1995 : Brain tumors. McCredie et al., 1994 : Primary malignant brain tumors (ICD-9 191) or cranial nerves (ICD-9 192.0). Pogoda and Preston-Martin, 1997 : astroglial tumor, PNET, other glial tumor (ICD-O; 1976). Preston-Martin et al., 1982 : astrocytomas, medulloblastomas, glioblastomas, ependymomas, gliomas of other or unspeci fi ed types, meningiomas, neuromas, gangliogliomas, tumors of other or unspeci fi ed types. Rosso et al., 2008 : medulloblastoma and primitive neuroectodermal tumor. Schüz et al., 2001 : astrocytomas, medulloblastomas, ependymomas, other types of glioma, other or unspeci fi ed types of CNS tumors (according to the classi fi cation by Birch and Marsden, 1987 ). Searles Nielsen et al., 2005, 2010 : ICD-O; WHO 1976, codes 191.0-192.1. Shim et al., 2009 : ICD-O, topography codes C71.0-C71.9, including all morphologic codes with a behaviour code of 3, excluding lymphoma. Spix et al., 2009 : ICCC, 1996. °°: all ORs were reported for exposed vs non exposed individuals. Gold et al. (1979) and Preston-Martin et al. (1982) reported ratios of discordant pairs and OR and/or 95% CI were calculated for inclusion in the MA. ⁎: Number of cases and/or crude OR and/or 95% CI calculated on the basis of the data in paper.
3.5. Sensitivity analyses
The results of the sensitivity analyses are reported inTable 3. None of the sensitivity analyses performed calls into question the robustness of the results. Very similar values were obtained whatever the statistical pooling model used (random,fixed). Rerunning the MA after removing the study with partial redundancy, those reporting extreme risk esti-mators as well as including data from other control groups did not substantially modify the results of the MA. The assessment of the in-fluence of individual studies by dropping the respective study off before pooling risk estimators indicated that the summary risk ratio is not dominated by a single study.
4. Discussion
4.1. Summary of evidence
In this MA, we studied the relationship between residential pesticide exposure and childhood brain tumors investigated in several case-control studies, often with inconclusive individual results. Overall, the summary risk of developing a brain tumor among children after re-sidential exposure to pesticides is statistically significantly increased, with no indication of between study heterogeneity or inconsistency (Fig. 2). The consistency of the results may be somewhat surprising due to the differences in study population, in exposure and timing of ex-posure, and in methods to ascertain the disease. The homogeneity of observed associations should, therefore, be interpreted with caution. The consistency infindings across studies could be due to a shared bias or unmeasured confounding, but a uniform bias or confounding moving risk estimators in the same direction in almost all studies appears un-likely.
We also examined the impact of several variables including the study quality, the sources of pesticide exposure, the critical exposure periods, the exposure location, the specific pesticide category, the ap-plication method, the type of pest treated, specific exposures, the type of CBT, the child age at diagnosis and the geographic location on the results to enhance our understanding of the potential involvement of residential pesticide exposure in the etiology of CBT (Table 2 and Supplemental Material Table 2). Statistically significant positive asso-ciations were observed for studies with the higher quality, for both exposure time windows (prenatal, childhood), for indoor use of pesti-cides and particularly prenatally, for studies from USA/Canada as well as from Europe (borderline). We observed the strongest associations for pet treatments and for treatment againstflea/tick but these associations were based on small numbers of studies. Significant increased risks were observed for all stratifications involving insecticides (except out-door insecticides), whatever the exposure windows and in particular following indoor use. The risk of gliomas, more specifically following prenatal exposure, was also significantly increased. Children diagnosed with a CBT before 10 or before 15 years showed a significant increased risk while no significant increase was observed for children/young adults diagnosed up to later than 15 years. In all the statistically sig-nificant associations, there is little evidence of heterogeneity. 4.2. Comparison with others MA
Our results reinforce and greatly extend the relevant but scarce data reported in the existing MA (Chen et al., 2015; Kunkle et al., 2014; Vinson et al., 2011) with regard to residential pesticide exposure and childhood brain tumors. As most of the study results byVinson et al. (2011)combined occupational and domestic pesticide exposure data, the only relevant results for domestic exposure are those reported for “parents' use of pesticides in the home or garden”. Unfortunately, these meta-analytic data could not be compared with ours because of the inclusion by these authors of several risk estimators issued from the same study and because data for non-significant associations were not
provided. In spite of these differences, our observations are in agree-ment with the following stateagree-ments of these authors: exposure to household and garden pesticides appears to be a risk factor for the development of brain cancer in children and the risk was increased with paternal exposure during the prenatal period. The MA ofKunkle et al. (2014)focused on parental farm-related pesticide exposure but the few data reported for non-agricultural exposure are in fair agreement with the results of the present MA. Statistically significant increased risks were observed for maternal exposure during pregnancy as well as for childhood exposure.Chen et al. (2015)restricted their analysis to ex-posure during childhood and summary odds ratios concerning CBT were reported for indoor and for outdoor pesticide exposures with a stratification for outdoor herbicide and yard insecticides exposures. Despite some methodological differences in the inclusion and exclusion criteria, our results for the corresponding stratifications (A.8, A.11, A.22, A.23) are in concordance with those of Chen et al. (2015), showing no statistically significant increased risks of CBT for these stratifications.
4.3. Strengths of the study
Of particular interest is the coherence between the present results for brain tumors following domestic/residential exposure and that of the MA on childhood brain tumors following parental occupational exposure to pesticides (Van Maele-Fabry et al., 2013). In both cases, significantly positive associations between pesticide exposure and childhood brain tumors were reported when combining all studies and significant increased risks were observed for prenatal exposure, what-ever the exposed parent and particularly for childhood gliomas. No indication of between study results heterogeneity and inconsistency were reported for all these associations, suggesting that combining the data was appropriate. These results support the hypothesis that pesti-cide exposure could be an etiologic factor for childhood brain tumors. An additional strength of the present MA is the lack of evidence of publication bias upon visual inspection of funnel plot and statistical analysis. Selection bias due to the non-inclusion of non-English lan-guage studies can be excluded as its relates to only 12 studies out of the 198 records screened in the study selection process and none of them would have been eligible according to inclusion criteria other than language. The possible impact of non-inclusion of unpublished small studies or of non-English language studies has already been analyzed in MA on pesticide exposure and childhood cancers.Turner et al. (2010) included such studies in their MA and observed that when restricting to studies published in English in the peer-reviewed literature only, the magnitude of the association observed between residential pesticide exposure and childhood leukemia tended to strengthen and hetero-geneity to reduce.Van Maele-Fabry et al. (2010)showed that rerunning the MA on occupational parental exposure to pesticides and childhood leukemia including unpublished studies did not substantially modify the results. Although a publication bias cannot be totally ruled out, after applying conventional tests, the association observed in the pre-sent MA does not appear to have been significantly influenced by publication bias.
The association among the 9 studies with higher total quality scores [ > median] showed a statistically significant increased risk of CBT; while no significantly increased risk was observed after combining re-sults from the 9 studies with lower total quality scores [≤ median].
All performed sensitivity analyses confirmed the robustness of the results and no single study dominated the association between re-sidential pesticide exposure and childhood brain tumors.
4.4. Limitations of the study 4.4.1. Recall bias
All studies included in the MA are of case-control design with self-reported retrospective exposure assessment raising the question of
recall bias (also called reporting bias or differential recall). Recall bias due to differences in the accuracy of parental recall or report between case and control groups, can distort the measure of association between exposure and disease and lead to an over- or underestimation of the risk. An overestimation of the risk may be due to over reporting ex-posure by case parents considering residential pesticide exex-posure a re-levant risk factor or to some control parents less carefully or thoroughly answering the questionnaire. An underestimation may occur if case parents do not want to be considered responsible for causing the disease of their children. In both cases, this differential exposure mis-classification might produce biased risk estimates. Potential for differ-ential exposure misclassification has been evaluated byVienneau et al. (2016)in a case-control study on childhood brain tumors for maternal exposures during pregnancy (e.g. smoking and working) by using two independent sources of exposure data (interview and birth registry data) and by analysing agreement between the two data sources. Their comparison indicated some potential for differential exposure mis-classification and thus potentially biased risk estimates when relying on interview data alone (Vienneau et al., 2016). In a case-control study of childhood leukemia, Slusky et al. (2012) assessed the reliability of maternal reports regarding the use of household pesticides. The relia-bility for all pesticides, based on two repeated in-person interviews and assessed by three reliability measures did not differ significantly for cases and controls. The authors concluded that their results indicate that the reliability of maternal-reported household pesticide use was similar among cases and controls, suggesting that differential recall of maternal reported household use of pesticides may not be substantial (Slusky et al., 2012). Although there may be some differential exposure misclassification, authors of a validation study on risk factors for leu-kemia in children suggested that non-differential misclassification of exposure may be of greater concern (Infante-Rivard and Jacques, 2000). However, it is noteworthy that in this study, parental recall bias was not assessed for pesticide exposure but for the following variables: reported distance from home to power lines compared with measured
distance and reported prenatal radiographic examinations compared with hospital medical record data
Our results showing that the magnitude of the associations with pesticide use varies by histological type of childhood brain tumors (statistically significant increased risk observed for gliomas but not for embryonal tumors), provide some evidence that differential recall bias is not likely to explain observed pesticide associations. If more accurate reporting by case parents caused a significant positive association, the risk estimates would be expected to be elevated for all histological types.
4.4.2. Pesticide exposure assessment
Pesticide exposure assessment remains a key element in epidemio-logical studies and especially for residential exposure of children. Assessment of residential exposure is challenging because it is self-re-ported by the parents and information is provided only on broad pest categories (insecticides, herbicides). In addition, it can be difficult to disentangle the potential effects of individual pest categories as often people use multiple types. While the use of insecticides can be common, the use of herbicides and fungicides are often rarer and few users of these do not also use insecticides. Type of pests treated are remembered more easily by the parents than specific compounds and the general population is typically less able to report histories of use of individual pesticides than occupational groups. Various methods have been em-ployed to improve recall of residential pesticide use such as queries about specific pests treated (in general and also home by home), life-time use of pest treatments along a life-timeline to establish temporal as-sociations with pesticide exposure (reviewed byGuha et al., 2013). Combined techniques were also analyzed: self-reported data com-plemented by pesticide concentrations in carpet dust (Deziel et al., 2015), web surveys versus telephone interviews (Wu et al., 2013), self-report and household inventory to collect information on the presence of specific active ingredients of stored pesticide products (Guha et al., 2013). Others authors have developed a“pesticide-exposure matrix” to
Study
Gold et al. (1979)
Preston-Martin et al. (1982)
Howe et al. (1989)
Kuijten et al. (1990)
Davis et al. (1993)
Bunin et al. (1994)
Cordier et al. (1994)
McCredie et al. (1994)
Leiss and Savitz (1995)
Pogoda and Preston-Martin (1997)
Schüz et al. (2001)
Searles Nielsen et al. (2005)
Rosso et al. (2008)
Shim et al. (2009)
Spix et al. (2009)
Searles Nielsen et al. (2010)
Greenop et al. (2013)
Chen et al. (2016)
Total
OR (95% CI)
2.3 (0.94-5.57)
1.45 (0.9-2.33)
0.94 (0.47-1.9)
1.2 (0.7-1.9)
1.8 (0.8-4)
1 (0.68-1.47)
1.8 (0.8-4.1)
2 (1-3.9)
1.3 (0.7-2.1)
1.1 (0.8-1.7)
1.24 (0.92-1.67)
0.62 (0.33-1.15)
1.6 (1-2.4)
1.32 (0.96-1.76)
1.29 (0.67-2.49)
1.05 (0.47-2.33)
1.26 (0.96-1.65)
1.25 (0.81-1.93)
1.26 (1.13-1.4)
Weights (% )
1.46
5.09
2.36
4.62
1.78
7.76
1.73
2.49
3.82
8.11
12.97
2.96
6.01
12.55
2.68
1.8
15.71
6.11
100
0.3 0.5 1.0 2.0 5.0 10.0Fig. 2. Forest plot of case-control studies on childhood brain tumors following residential exposure to pesticides.
Note. Odds ratio (OR) and 95% confidence intervals (CIs) of case-control studies included in the meta-analysis “all studies” are presented. Each estimator was assigned a weight (wi) equal
Table 2
Meta-analyses after stratification of the case-control studies data.
Stratification N. Summary Homogeneity
Studies Odds Ratios 95% CI Cochran's Q (χ2Woolf) P-value I2 95% UI
Residential exposure
All studies (A.1)(a) 18 1.26 1.13–1.40 14.362 0.641 0 0–41
Study quality
(A.2) high quality (> median) 9 1.27 1.11–1.44 1.896 0.984 0 0–0 (A.3) low quality (< median) 9 1.26 0.98–1.61 12.416 0.134 36 0–70 Exposure time windows
(A.4) Prenatal 13 1.29 1.14–1.46 6.803 0.870 0 0–23
(A.5) childhood(b) 12 1.26 1.10–1.45 9.716 0.556 0 0–53
Exposure location Indoor exposure
(A.6) All studies 14 1.23 1.09–1.40 14.342 0.350 9 0–47
(A.7) Prenatal 10 1.26 1.08–1.46 7.734 0.561 0 0–56
(A.8) Childhood 9 1.09 0.88–1.35 15.186 0.0556 47 0–76
Outdoor exposure
(A.9) All studies 6 1.13 0.89–1.44 8.110 0.150 38 0–76
(A.10) Prenatal 5 1.20 0.90–1.61 6.289 0.179 36 0–76
(A.11) Childhood 5 1.16 0.78–1.73 11.939 0.0178 67 13–87
Specific exposure (A.12) Professional pest
extermination
5 1.15 0.95–1.40 2.512 0.643 0 0–67
(A.13) Pet treatments 2 1.43 1.02–2.01 0.193 0.661 0 ND
Pesticide biocide category Insecticides
(A.14) All studies 10 1.23 1.06–1.42 7.540 0.581 0 0–55
(A.15) Prenatal 6 1.26 1.04–1.54 0.940 0.967 0 0–0
(A.16) Childhood 7 1.32 1.09–1.59 2.754 0.839 0 0–36
Herbicides
(A.17) All studies 3 1.28 0.97–1.70 0.289 0.865 0 0–28
(A.18) Prenatal 3 1.28 0.97–1.70 0.289 0.865 0 0–28
(A.19) Childhood 2 1.55 0.74–3.21 0.173 0.677 0 ND
Fungicides
(A.20) All studies 2 0.54 0.04–7.05 6.883 0.0087 86 41–96
Exposure location and biocide category
(A.21) Indoor insecticides 6 1.31 1.09–1.56 1.949 0.856 0 0–35 (A.22) Outdoor insecticides 3 1.24 0.97–1.60 0.209 0.901 0 0–1
(A.23) Outdoor herbicides 3 1.28 0.97–1.70 0.289 0.866 0 0–28
Application methods
(A.24) Spray/bomb 3 1.99 0.61–6.46 5.515 0.0634 64 0–90
(A.25) Strips 2 2.29 0.72–7.28 2.506 0.113 60 0–91
(A.26) Collar 2 1.06 0.61–1.82 0.029 0.865 0 ND
(A.27) Shampoo 2 1.03 0.59–1.81 0.464 0.496 0 ND
Type of pest treated
(A.28) Termite 3 1.42 0.71–2.86 0.808 0.668 0 0–74
(A.29) Lice 2 0.73 0.38–1.41 1.468 0.226 32 ND
(A.30) Flea/tick 3 1.46 1.05–2.05 1.401 0.496 0 0–85
Brain tumor type Gliomas
(A.31) All studies 5 1.30 1.09–1.55 0.409 0.982 0 0–0
(A.32) Prenatal 4 1.31 1.08–1.59 0.310 0.958 0 0–0
(A.33) Childhood 2 1.05 0.79–1.39 0.535 0.535 0 ND
Embryonal tumors
(A.34) All studies 4 1.07 0.81–1.41 3.327 0.344 10 0–86
(A.35) Prenatal 3 1.04 0.69–1.57 3.327 0.190 40 0–82 (A.36) Childhood 2 1.12 0.74–1.69 0.046 0.831 0 ND Geographic location (A.37) USA/Canada 12 1.22 1.06–1.40 11.645 0.391 6 0–61 (A.38) Europe 3 1.29 1.00–1.68 0.705 0.703 0 0–71 (A.39) Australia 2 1.42 0.95–2.12 1.529 0.216 35 ND Age at diagnosis (A.40) 0–10 years 6 1.28 1.06–1.55 3.538 0.618 0 0–64 (A.41) 0–15 years 7 1.30 1.11–1.52 2.426 0.877 0 0–28