O
pen
A
rchive
T
OULOUSE
A
rchive
O
uverte (
OATAO
)
OATAO is an open access repository that collects the work of Toulouse researchers and
makes it freely available over the web where possible.
This is an author-deposited version published in :
http://oatao.univ-toulouse.fr/
Eprints ID : 16676
To link to this article : DOI:10.1088/2053-1591/3/8/085027
URL :
http://dx.doi.org/10.1088/2053-1591/3/8/085027
To cite this version : Ramachandran, Laavanya and Lonjon, Antoine
and Demont, Philippe and Dantras, Eric and Lacabanne, Colette
Conduction mechanisms in P(VDF-TrFE)/gold nanowire composites:
tunnelling and thermally-activated hopping process near the
percolation threshold. (2016) Materials Research Express, vol. 3 (n°
8). pp. 085027. ISSN 2053-1591
Any correspondence concerning this service should be sent to the repository
administrator:
[email protected]
doi:10.1088/2053-1591/3/8/085027
Conduction mechanisms in P(VDF-TrFE)/gold nanowire composites:
tunnelling and thermally-activated hopping process near the
percolation threshold
Laavanya Ramachandran, Antoine Lonjon, Philippe Demont, Eric Dantras and Colette Lacabanne
Physique des Polymères, CIRIMAT/Institut Carnot, Université Paul Sabatier, 118 route de Narbonne, F-31062 Toulouse Cedex 9, France E-mail:[email protected]
Keywords: gold nanowires, conducting polymer composite, conduction mechanism
Abstract
High-aspect ratio gold nanowires were dispersed in a P(VDF-TrFE) matrix to form conducting
polymer composites. The composites were found to follow a percolation law, with a low percolation
threshold of 2.2%vol and attaining a conductivity value of 100 S m
−1. The temperature and frequency
dependence of the composites were studied using broadband dielectric spectroscopy. Tunnelling was
found to be the main charge transport mechanism at temperatures below
−100 °C and a
thermally-activated hopping mechanism was determined to be responsible for conduction at temperatures
above
−100 °C. The correlated barrier hopping model was found to be the best fit to explain the
conduction mechanisms in the composites.
Introduction
Conducting polymer systems have garnered much interest over the past few decades. Conductivefillers are dispersed in an insulating matrix to create systems that have the mechanical advantages of the polymer, but electrical properties of thefiller. These systems have found useful applications in many domains to replace their metal counterparts; including but not limited to electromagnetic and radio interference shielding,
microelectrodes, conductive adhesives and dissipative materials[1–3].
Polymer materials have physical and mechanical properties that make them easy to process, either for small-scale laboratory projects or large industrial applications. They are also lightweight compared to their metal counterparts. The main drawback is that most polymers are insulators(with typical conductivity values located in the range of 10−14–10−7S m−1) [4–6].
To improve their electrical properties,fillers are therefore added to these polymer materials to form conducting polymer composites. Different types offillers are used, the most common being graphite, carbon black, carbonfibres and carbon nanotubes [7–10]. Metal fillers have also been widely studied, due to their
excellent electrical properties[11–13].
The physical properties of the nanocomposite depend mainly on the choice of the polymer matrix andfiller type and content. Highfiller content may give good electrical properties for a certain application, but the advantages of the polymer material are lost[14]. Low-filled polymer composites are developed as to preserve the
qualities of the polymer matrix[15]. Closely related to this is the dispersion of the filler in the polymer matrix
that has to be controlled in order to better understand the conductivity in the composites.
Filler type and content are essential in determining the electrical properties of the composites, though other factors also play an important role; thefiller size, shape and surface properties also have an influence. It has been shown thatfillers with an aspect ratio greater than 1 (the reference being spherical particles) can achieve higher levels of electrical conductivity for lowerfiller contents [6,16].
Studying direct and alternative conductivity in a nanocomposite can allow for better understanding of the conduction mechanisms involved. This in turn enables better control of physical properties for future works involving polymer–metal nanocomposites (especially in the case of different assemblies of polymer–metal couples).
In this work, gold nanowires(Au NW) with high aspect ratio were synthesised. Gold has the advantage of being chemically inert in most compositions and not forming oxide layers[17]. It has also been found that gold
nanowires have a high value of intrinsic electrical conductivity[18]. The gold nanowires were then dispersed in a
poly[(vinylidenefluoride-co-trifluoroethylene] [P(VDF-TrFE)] matrix to form low-filled conducting polymer composites(<8%vol fraction of Au NW). The electrical conductivity was studied to better understand the mechanisms responsible for conduction in these kinds of low-filled polymer composites.
Experimental
Materials
P(VDF-TrFE) (70/30 mol%) was obtained from Piezotech S.A. The density of the polymer was 1800 kg m−3and the melting temperature was determined by DSC measurements to be 150°C [18]. Gold nanowires were
prepared using an electrodeposition method, described in the following section.
Au nanowires elaboration and composites processing
Au nanowires were grown by electrochemical deposition inside the pores of an anodic aluminium oxide membrane, provided by Whattman. The pore sizes were 200 nm and membrane thickness was 50μm. One side of the membrane was coated with a silver layer to serve as the cathode. A gold electrode was used as the anode. A 2420 Keithley current source was used to control the direct current intensity.
The nanowires are obtained by dissolving the membrane in a solution of sodium hydroxide and are then washed and dispersed in acetone.
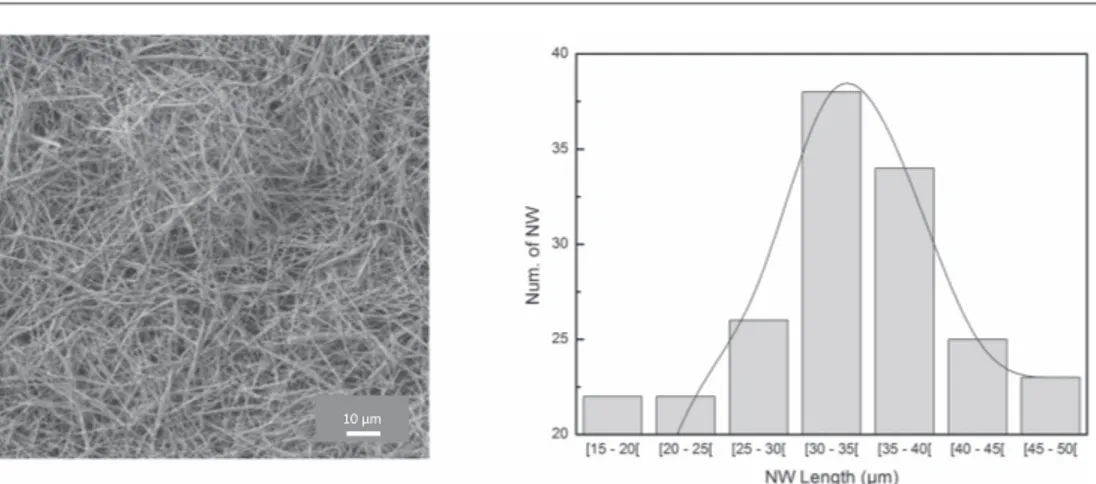
Typical yield for one electrodeposition process is about 100 mg. A drop of the Au NW dispersed in acetone was deposited on a scanning electron microscopy(SEM) sample pin. After evaporation of the solvent, the wires were observed using a JEOL JSM 6700F instrument equipped with afield emission gun (SEM-FEG), as shown in figure1(left).
The image shows that the nanowires are individually dispersed and do not form aggregates. The wires were also observed at very low concentrations. A small amount of the dispersion is diluted in a large volume of acetone; a drop of this suspension is observed to determine the length of annowires using image analysis software. It is thus possible to determine the distribution of the length of nanowires, which is presented in figure1(right).
The Gaussian distribution represented by the solid curve infigure1(right), shows that the lengths of the
nanowires are centred at 38μm. This gives an aspect ratio of 190.
The composites were prepared using a solvent casting method; P(VDF-TrFE) is dissolved in acetone, the nanowires are then poured into the polymer solution and the mixture is sonicated for 5 s(about 25 W) to disperse the wires within the polymer. The solvent is evaporated using a magnetic stirrer at 80°C for 1 h, leaving a residue of pellets(of nanowires dispersed in the polymer). These pellets are then hot-pressed at 200 °C (to allow for sufficient melting of the polymer) under a pressure of 0.3 MPa to form thin films of about 200 μm thickness. The volume fractions of the Au NW/P(VDF-TrFE) composites vary from 0% to 8%vol.
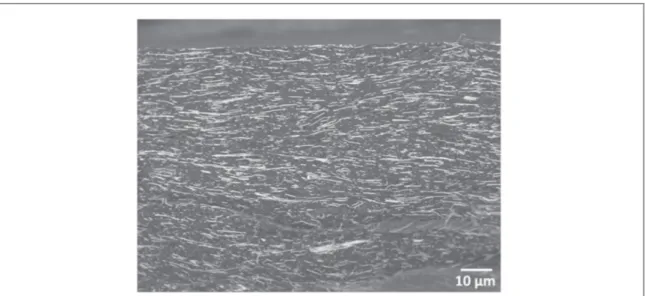
Certain samples were fractured using liquid nitrogen as to observe the lateral surface of the interior of the nanocomposites. The samples were mounted onto a SEM pin and observed using the same JEOL JSM 6700F instrument. Figure2shows a composite containing 7.7%vol of Au NWs.
The image shows that the wires are distributed throughout the matrix with a particular orientation visible, which is most probably due to the hot-pressing technique(the orientation is perpendicular to the direction of compression).
Electrical analysis
For conducting samples(defined as having a bulk impedance Z<100 Ω), impedance measurements were conducted with a Keithley 2400 multimeter using a 4-probe technique. The room-temperature conductivity is then calculated.
For low-conducting composites(defined as having a bulk impedance Z>100 Ω), dynamic dielectric analysis was performed using a Novocontrol BDS 4000 broadband dielectric spectrometer(BDS) with a Solartron SI1260 impedance analyser. Samples were placed between two electrodes and a sinusoidal electrical field was applied. Measurements were performed at different isotherms from −150 °C to 150 °C, with a frequency sweep from 10−2to 106Hz. The complex conductivityσ*(ω) is determined; in this study the real part σ′ is considered. σ′ follows a universal law (called the universal dielectric response) [19]:
s w¢( )= s +Aws, dc
whereω is the angular frequency, σdcthe direct current conductivity and s an exponent that is related to the
conducting mechanism.
At very low frequencies, the phase lag between the measured impedance and ac voltage is negligible. The second term(which depends on the frequency) may thus be disregarded as it tends towards zero. The conductivity no longer depends on the frequency and it may be assumed that atσ′(ω)≈σdcHenceforth,σdc
values presented(for low conducting samples) are the values of ac conductivity taken at 10−2Hz.
In addition to frequency sweeps, the measurements were performed at different isotherms to study the temperature behaviour of the composites.
This paper will attempt to study the conduction mechanisms by combining the study of temperature and frequency dependence.
Results and discussion
Percolation threshold
The dc conductivity of these composites follow the percolation law[20,21]. In classic percolation theory, the
fillers form an infinite network in the polymer matrix. At very low filler contents, the filler particles are separated by insulating matrix and charge carrier transport is impossible; the conductivity values are comparable to that of the polymer matrix. As thefiller content increases the particles occupy more space and the composite’s overall conductivity increases. Conducting particles start to form paths where charge carriers can pass through. Some of the factors that have an influence on the formation of this path are physical barriers, inter-filler distance (which depends greatly on the dispersion in the polymer) and potential barriers (due to the large difference in
conductivity between thefiller and the polymer matrix). At a critical value of filler content the conductivity undergoes a drastic increase(generally by several orders of magnitude) for a very small modifications of filler content; this is the insulating-conductor transition. Thefiller particles form a conductive network and charge transport is possible throughout the composite. The general form of the law is:
s= s (p-p)t,
0 c
where p is the concentration, pcthe criticalfiller content, σ0the conductivity of composite with 100% nanowire
and t a parameter that is related to the dimensionality of the conductive path. The values of t differ according to the dimensionality of the system; 1 for 1D, 1.3 for 2D and 1.9 for 3D[20].
Dc conductivity for all the composites is shown infigure3as a function offiller content. The inset graph shows the datafitted with the percolation law. The percolation threshold pcis determined as the cut-off
volume fraction where the conductivity undergoes a drastic increase.
After the percolation threshold pc, the dc conductivity reaches a constant value of about 100 S m−1. Similar
values have been found for polyimide–silver nanowire and P(VDF-TrFE)–cobalt nanowire systems [12,22]. The
value of t is smaller than the expected value of 1.9 for randomly orientedfillers in three-dimensional percolation systems. This might be due to a slight orientation effect of the hot-pressing technique, as shown by the SEM image of a nanocomposite. The value ofσ0here is much lower than the bulk conductivity of gold
(4.5×10⁷
S m−1) but is in good agreement with the conductivity of pressed gold nanowires (1.64×10⁴S m−1) [18]. In other metal fillers oxidation is usually the cause of a lower measured value of conductivity; this is not the
case for gold nanowires. Contact resistance in the pressed nanowires may be responsible for the low value measured.
Conduction mechanisms
Above the percolation threshold
In literature, conduction mechanisms in nanocomposites and heterogeneous systems are generally attributed to the tunnel effect, which depends on thefiller content and the dispersion in the matrix [23,24]. It has been shown
that if tunnelling is the main transport mechanism in a randomly dispersed 3D system, conductivity values are proportional to the gap distance betweenfiller particles, which is in directly related to the mass fraction x [25,26]
where:
/
s µ x -ln dc 1 3.
For the samples considered, a linear dependence is not observed. We can infer from this that tunnelling is not the dominant transport mechanism for our composites.
Many other models have been proposed in literature to explain the behaviour conductivity in composite systems. Most of them focus on a certain aspect of the composite system: statistical, geometrical,
structure-Figure 2. Nanowire distribution inside a nanocomposite(lateral surface of a cryo-fractured sample).
Figure 3. Dc conductivity of composites as a function of volume fraction of Au NW and percolationfit in solid line (inset: log–log plot to determine critical exponent t) parameters obtained: pc=2.2%vol, t=1.22 , σ0=6.316×10³S m−1.
oriented or thermodynamic[21]. In this work we have focused on the thermodynamic part, as many models that
identify conducting mechanisms have distinct behaviours with temperature[27–29].
Certain semi-conductors present an Arrhenius-like dependence, where the electrons have to overcome an energy gap before being able to contribute to conduction. In this case the general conductivity is inversely proportional to the temperature:
s µ ⎛ -⎝ ⎜ ⎞ ⎠ ⎟ E k T exp a , B where Eais the activation energy and kBthe Boltzmann constant.
In other cases of disordered materials, charge carriers that are physically separated by a material barrier have overlapping wave functions that allow them to move through the material[30]. The term ‘hopping’ describes
this type of transport, where charge carriers jump from one position to another. The charge carriers may pass through a contact barrier or tunnel though from one particle to another[31,32]. In amorphous solids and
disordered materials, the conductivity is generally thermally-activated. The variable-range-hopping model was first proposed by Mott to explain the conductivity behaviour [33]:
s µ -g ⎡ ⎣ ⎢ ⎛ ⎝ ⎜ ⎞⎠⎟ ⎤ ⎦ ⎥ T T exp . 0
The value of the exponentγ being related to dimensionality d of the system by the equation g = + d
1
1 .
One of the hypotheses was that the charge carriers did not interact with each other(or if they did, it was insignificant compared to the thermal energy).
Efros and Shklovskii[34] proposed the same temperature dependence by taking into account the interaction
between charge carriers, whereγ=½ in all dimensions. Their model is well-adapted to heterogeneous systems wherefillers with a high density of charge carriers are dispersed in an insulating matrix.
Sheng and Abeles[25] proposed a tunnelling conduction mode (charge energy limited tunnelling), where
the conductivity is related to the temperature with the equation: / s µ ⎛ -⎝ ⎜ D ⎞⎠⎟ k T exp , B 1 2 where D is a constant.
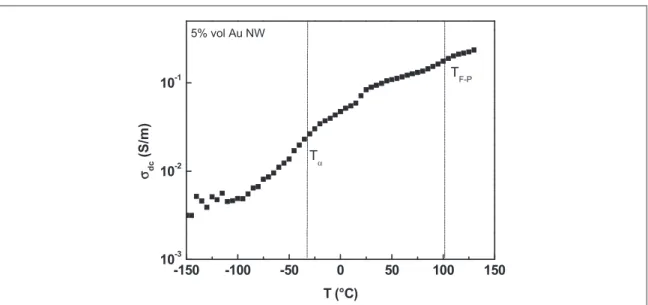
The temperature dependence of dc conductivity for composites with 5%vol of Au NW is shown infigure4. Conductivity values increase with temperature, a shift is observed in the 50°C–100 °C region, which corresponds to the ferro–paraelectric transition, TF–P, of the polymer matrix. The dielectric manifestation of the
glass transition, Tα, is visible at−30 °C [22].
The ferro–paraelectric transition of neat P(VDF-TrFE) is visible in dielectric spectra as an isothermal event at 100°C. The temperature of this transition with an increasing temperature ramp is not affected by the presence of fillers [22].
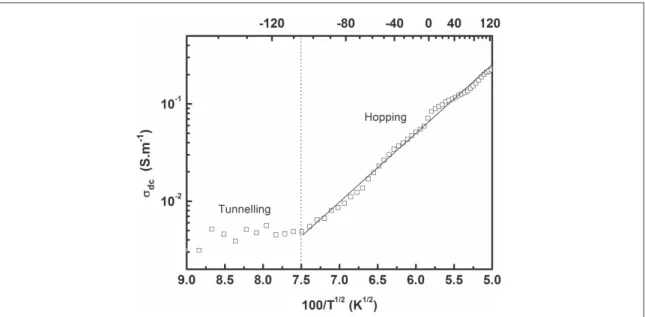
As presented previously, different models have been proposed to explain the temperature behaviour of heterogeneous composites. To study the relevance of each model, experimental conductivity values are plotted against T− γ.
In this work, the bestfit was obtained for γ=½, as shown in figure5.
At temperatures below−100 °C, the conductivity is temperature-independent, which is characteristic of tunnelling-governed transport. Above−100 °C, the conductivity seems to undergo a thermal activation process and is governed not by tunnelling but by a hopping mechanism. The Efros–Shklovskii (ES) model is particularly adapted to cases where metalfillers (with a high density of charge carriers) are homogenously dispersed in an insulating polymer matrix to form a heterogeneous conducting system.
For an electron to‘hop’ to another position, the energy gain created by the movement has to be greater than the Coulombian energy between an electron and the hole it leaves behind. For very small distances, this
condition is not fulfilled; hence hops do not occur between particles around the Fermi level. Hops occur between localised states when the energy gain is favourable. The ES model predicts a linear relation with T−1/2in this case and the general equation becomes:
/ s =s ⎡-⎜ ⎟ ⎣ ⎢ ⎛⎝T ⎞⎠ ⎤⎦⎥ T exp . dc 0 0 1 2
T0is related to the apparent permittivity of the composite by the following equation:
xe e = T e k 2.8 , 0 2 B 0
where e is the elementary charge,ε0the free space permittivity,ε relative dielectric permittivity of the material,
andξ the localisation length.
From the ES equation several parameters can be obtained. From the linearfit in the figure, T0=4950 K and
σ0=792 S m−1. Takingε to be 8 [22], the localisation length ξ that charge carriers pass through to form a
conducting path is 15 nm. This value is comparable to the inter-particle distance found in other works on composites with nanoparticles dispersed in a polymer matrix, which is around 10 nm[35].
Below the percolation threshold
The percolation threshold marks a sharp change in behaviour in the composites; this is illustrated by
conductivity values previously. This goes to show that the composites have different behaviours below and after pc. It is thus interesting to study a composite that is both below pc(i.e. in the isolating region) but that can be
distinguished from the neat polymer(i.e. with Au NW content).
Shown infigure6is the temperature dependence for a composite with 1.5%vol of Au NWs(pcbeing equal to
2.2%vol, as determined previously).
The dielectric manifestation of the glass temperature, Tα, of the polymer matrix is visible at−30 °C and the ferro–para electric transition, TF–P, is located at 107°. Henceforth only conductivity values below the glass
transition are considered, as a dipolar relaxation process can influence the behaviour of electrical conductivity[22].
In order to understand the charge transport in composites, it is interesting to study dynamic conductivity. More often than not, this is hindered by the high conductivity values of composites after pc(these values are
almost always independent of frequency). However, by analysing a sample that is both isolating and close to pc, it
is possible to observe and study the dynamic conductivity.
The conductivity values are no longer independent of the frequency and may be analysed using the second term of the universal law of transport:
s w¢( )=Aws.
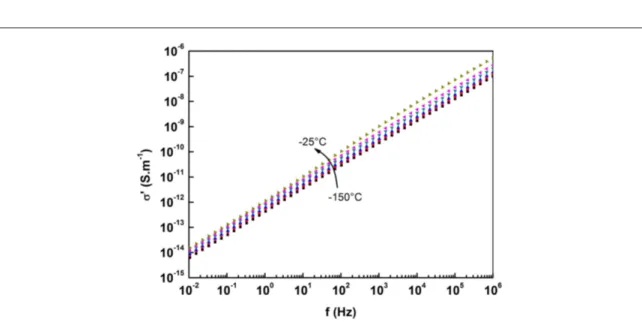
Figure7shows the values of conductivity as a function of frequency for a sample with 1.5% volume of Au nanowires, for a range of temperatures between−150 °C and −25 °C (below the glass transition temperature).
By plotting the log values of the frequency and conductivity, the exponent s is the slope of each isotherm in the linear region between 104and 106Hz. The calculated values are presented infigure8.
For temperatures below−100 °C, the value of s close to 0.9, which is the agreed value associated with tunnelling transport[36]. Above −100 °C however, the values of s begin to decrease. This confirms the findings
in the previous part, where some sort of hopping process was found to be responsible for charge transport. For classical tunnelling, s is temperature-independent; as seen above this is the case for temperatures below −100 °C. Some other models also use the exponent s as a determining factor: the small-polaron tunnelling theory predicts an increase in s with temperature in heterogeneous semi-conductive materials, whereas the
Figure 6. Dc conductivity as a function of temperature for a 1.5%vol Au NW composite.
large-polaron tunnelling theory predicts a minimum s and then an increase similar to small-polaron theory[30].
This is clearly not the case for the data shown in thefigure.
The correlated barrier hopping model put forth by Elliot[37] describes the behaviour of a
temperature-dependant frequency exponent where s decreases from unity with temperature. According to the model, charge carriers hop over(instead of through) the potential barrier separating different sites. The barrier height is correlated with the distance that separates the different sites[24]. In this case the exponent s follows the relation:
wt = -+ ( ) s k T W k T 1 6 ln , B m B 0
where Wmis the energy difference between the two sites(the ground state and the ionised state) and τ0the
relaxation time.
Byfitting the values of s within the region of 160–280 K (figure9) and taking ω to be 104s(frequency of the region where s was calculated) we obtain Wm=0.078 eV and τ0=6.712 × 10⁻⁵s.
Using these values, the hopping length Rωcan be calculated:
p wt = -w ⎡ ⎣ ⎢ ⎛ ⎝ ⎜ ⎞⎠⎟⎤ ⎦ ⎥ R e W k T ln 1 . 2 0 m B 0
Figure 8. Exponent‘s’ as a function of temperature.
Between 173 and 273 K, the hopping length is calculated to be in the range of 0.91–0.93 nm. These values are reasonable as they are of the same order of magnitude as the polymer lattice parameters and inter-chain distance[38].
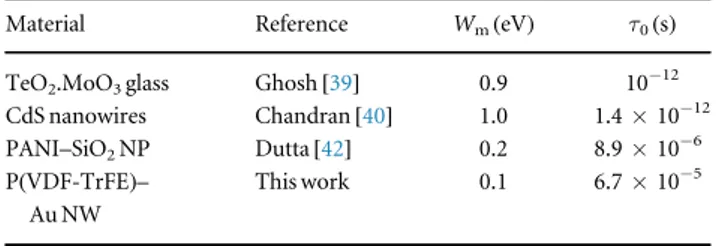
Shown in table1are values of barrier height and characteristic relaxation time reported by Ghosh[39] (for
semi-conducting tellurium molybdate glass) and Chandran [40] (for cadmium sulphide (CdS) nanowires) as
well as Dutta[41] (for polyaniline(PANI)–silica nanoparticle composites).
Thefirst two works in the table focus on pure semi-conductors, where the samples are pressed to form pellets orfilms. The third focuses on a dispersed system, but with a conducting polymer phase dispersed within a network of insulating particles. Most of the other works on the CBH model also focus on this type of composite, where a conducting polymer and insulating particles are used[42–44].
Compared to the pure semi-conductors, the characteristic relaxation time is slower in the case of dispersed systems, as the insulating phase is an added obstacle to the passage of charge carriers. The barrier height in dispersed systems is lower than the ones found for pure semi-conductors. The value found in our work though is comparable to that of Dutta and other dispersed systems[42–44].
In our work, for a composite above pc, the conduction is ensured by localised states of conducting phases
within the composite. These states are connected through the formation of a 3D percolation network, enabling charge carriers to move freely throughout the composite. For a composite just below pc, these localised states
exist, but are not yet connected by a conducting path. Thermal energy increases the mobility of the charge carriers by allowing them to hop over energy barriers and contribute to conduction. This seems to be more efficient in the case of a composite above pcwith a higher content of Au NW(confirmed by the higher values of
conductivity measured). The hopping/tunnelling length may also be dependent on the Au NW content. The localisation length for a composite below pcwas found to be 15 nm whereas the hopping length calculated for a
composite above pcis around 1 nm. It is interesting to note that despite the large difference in conductivity
before and after pc(and hence the idea that the two systems are fundamentally different), the hopping/
tunnelling length is of the same order of magnitude and is furthermore reasonable. Ambrosetti et al reported values ofξ within the range of 0.1–100 nm for several dispersed systems [45]. This suggests that a similar
mechanism is responsible for conduction below and above pc, thereby corroborating the choice of ES and CBH
model to describe the conduction mechanisms in the composites.
Conclusions
Gold nanowires with high-aspect ratio were successfully synthesised and dispersed in a P(VDF-TrFE) matrix to form conducting composites. SEM images show a narrow distribution of length around 38μm (thus an aspect ratio of about 190) and an oriented but homogeneous dispersion in the polymer matrix without aggregates.
The composites present an electric percolation threshold, which wasfitted with the percolation law to determine the criticalfiller content (pc=2.2%vol) and the critical exponent t (1.22). The conductivity increases
by many decades after the criticalfiller content, reaching a value of about 100 S m−1.
The conductivity of the lowfilled conductive composites was studied as a function of frequency and temperature, both below and above the percolation threshold. It was found that the composites exhibit two different types of behaviours. Below−100 °C the charge transport is governed by a classic tunnelling
mechanism, and above a hopping mechanism was assumed to be responsible. The ES model was determined to be the bestfit for dc conductivity, with a localisation length ξ of 15 nm, which can be compared to the inter-particle distance.
The dynamic conductivity for a composite below(and near) the percolation threshold was studied. By analysing the behaviour of the exponent‘s’, it was found that above −100 °C, the CBH model was the best fit to explain the charge transport in the composites, confirming a thermally-activated hopping process. The charge carriers basically contribute to conductivity by hopping over a potential barrier, leading to a change in behaviour with frequency. This hopping process is dependent both on inter-particle distance and the energy barrier
Table 1. Comparison of barrier height and characteristic relaxation time. Material Reference Wm(eV) τ0(s) TeO2.MoO3glass Ghosh[39] 0.9 10−12 CdS nanowires Chandran[40] 1.0 1.4×10⁻¹² PANI–SiO2NP Dutta[42] 0.2 8.9×10⁻⁶ P(VDF-TrFE)–
Au NW
between the conducting particles. Byfitting the conductivity values, the hopping length was determined to be of the order of∼1 nm.
The temperature and frequency behaviour of the conductive composites were studied below and above the percolation threshold. A value of inter-nanowire distance was determined for each case. This value is due to the hopping length and seems to be dependent on the content of nanowires. A conductive inter-particle distance for the electrical percolation threshold was estimated to be between 1 and 20 nm. The results obtained for these kinds of composites show that the electrical conductivity below and above pcis governed by a preponderant
hopping mechanism.
Understanding the conduction mechanisms in nanocomposites is a further step towards the elaboration of nanocomposites with tuneable electrical properties.
References
[1] Al-Saleh M H and Sundararaj U 2009 Electromagnetic interference shielding mechanisms of CNT/polymer composites Carbon47 1738–46
[2] Alvarez M P, Poblete V H, Pilleux M E and Fuenzalida V M 2006 Submicron copper-low-density polyethylene conducting composites: structural, electrical, and percolation threshold J. Appl. Polym. Sci.99 3005–8
[3] McNaughton T G and Horch K W 1996 Metallized polymer fibers as leadwires and intrafascicular microelectrodes J. Neurosci. Methods 70 103–10
[4] Strümpler R, Maidorn G and Rhyner J 1997 Fast current limitation by conducting polymer composites J. Appl. Phys.81 6786 [5] Nambiar S and Yeow J T W 2011 Conductive polymer-based sensors for biomedical applications Biosens. Bioelectron.26 1825–32 [6] Clingerman M L, King J A, Schulz K H and Meyers J D 2002 Evaluation of electrical conductivity models for conductive polymer
composites J. Appl. Polym. Sci.83 1341–56
[7] Li Y C, Tjong S C and Li R K Y 2010 Electrical conductivity and dielectric response of poly(vinylidene fluoride)–graphite nanoplatelet composites Synth. Met.160 1912–9
[8] Lisunova M O, Mamunya Y P, Lebovka N I and Melezhyk A V 2007 Percolation behaviour of ultrahigh molecular weight polyethylene/ multi-walled carbon nanotubes composites Eur. Polym. J.43 949–58
[9] Barrau S, Demont P, Perez E, Peigney A, Laurent C and Lacabanne C 2003 Effect of palmitic acid on the electrical conductivity of carbon nanotubes-epoxy resin composites Macromolecules36 9678–80
[10] Choi M, Jeon B and Chung I 2000 The effect of coupling agent on electrical and mechanical properties of carbon fiber/phenolic resin composites Polymer41 3243–52
[11] Mamunya Y P, Davydenko V V, Pissis P and Lebedev E V 2002 Electrical and thermal conductivity of polymers filled with metal powders Eur. Polym. J.38 1887–97
[12] Lonjon A, Laffont L, Demont P, Dantras E and Lacabanne C 2009 New highly conductive nickel nanowire-filled P(VDF-TrFE) copolymer nanocomposites: elaboration and structural study J. Phys. Chem. C113 12002–6
[13] Milliere L, Makasheva K, Laurent C, Despax B, Boudou L and Teyssedre G 2016 Silver nanoparticles as a key feature of a plasma polymer composite layer in mitigation of charge injection into polyethylene under dc stress J. Phys. D: Appl. Phys.49 015304 [14] Rusu M, Sofian N and Rusu D 2001 Mechanical and thermal properties of zinc powder filled high density polyethylene composites
Polym. Test.20 409–17
[15] He F, Lau S, Chan H L and Fan J 2009 High dielectric permittivity and low percolation threshold in nanocomposites based on poly (vinylidene fluoride) and exfoliated graphite nanoplates Adv. Mater.21 710–5
[16] Taherian R, Hadianfard M J and Golikand A N 2013 A new equation for predicting electrical conductivity of carbon-filled polymer composites used for bipolar plates of fuel cells J. Appl. Polym. Sci. 128 1497–509
[17] Green T A 2007 Gold electrodeposition for microelectronic, optoelectronic and microsystem applications Gold Bull.40 105–14 [18] Lonjon A, Laffont L, Demont P, Dantras E and Lacabanne C 2010 Structural and electrical properties of gold nanowires/P(VDF-TrFE)
nanocomposites J. Phys. D: Appl. Phys.43 345401
[19] Jonscher A K 1977 The ‘universal’ dielectric response Nature267 673–9
[20] Stauffer D and Ammon A 1994 Introduction to Percolation Theory (Boca Raton, FL: CRC press)
[21] Lux F 1993 Models proposed to explain the electrical conductivity of mixtures made of conductive and insulating materials J. Mater. Sci.28 285–301
[22] Nguyen L 2015 Elaboration De Composites Polymere Ferroelectrique/Fils Submicroniques Ferromagnetiques : Analyse Des Proprietes Magnetoelectriques PhD Thesis Université Paul Sabatier
[23] Ezquerra T A, Kulescza M, Cruz C S and Balta-Calleja F J 1990 Charge transport in polyethylene–graphite composite materials Adv. Mater.2 597–600
[24] Psarras G C, Manolakaki E and Tsangaris G M 2003 Dielectric dispersion and ac conductivity in—iron particles loaded—polymer composites Composites A34 1187–98
[25] Sheng P and Abeles B 1972 Voltage-induced tunneling conduction in granular metals at low temperatures Phys. Rev. Lett.28 34–7 [26] Sheng P, Sichel E K and Gittleman J I 1978 Fluctuation-induced tunneling conduction in carbon–polyvinylchloride composites Phys.
Rev. Lett.40 1197–200
[27] Rosenbaum R 1991 Crossover from Mott to Efros–Shklovskii variable-range-hopping conductivity in InxOy films Phys. Rev. B44 3599–603
[28] Epstein A J, Lee W-P and Prigodin V N 2001 Low-dimensional variable range hopping in conducting polymers Synth. Met.117 9–13 [29] Prigodin V N and Epstein A J 2003 Quantum hopping in metallic polymers Physica B338 310–7
[30] Long A R 1982 Frequency-dependent loss in amorphous semiconductors Adv. Phys.31 553–637 [31] Griffiths D J 1995 Introduction to Quantum Mechanics (Englewood Cliffs, NJ: Prentice Hall) [32] Long A 1991 Hopping Transport in Solids (Amsterdam: Elsevier)
[33] Mott F N and Davis E 1971 Electronic Processes in Non-Crystalline Materials (Oxford: Clarendon)
[34] Efros A L and Shklovskii B I 2001 Coulomb gap and low temperature conductivity of disordered systems J. Phys. C: Solid State Phys.8 L49–51
[35] Li J and Kim J-K 2007 Percolation threshold of conducting polymer composites containing 3D randomly distributed graphite nanoplatelets Compos. Sci. Technol.67 2114–20
[36] Elliott SR 1987 Ac conduction in amorphous chalcogenide and pnictide semiconductors Adv. Phys.36 135–217 [37] Elliott SR 1977 A theory of ac conduction in chalcogenide glasses Phil. Mag.36 1291–304
[38] Bellet-Amalric E and Legrand J F 1998 Crystalline structures and phase transition of the ferroelectric P(VDF-TrFE) copolymers, a neutron diffraction study Eur. Phys. J. B3 225–36
[39] Ghosh A 1992 Correlated-barrier hopping in semiconducting tellurium molybdate glass Phys. Rev. B45 11318–20
[40] Chandran A, Samuel M S, Koshy J and George K C 2011 Correlated barrier hopping in CdS nanoparticles and nanowires J. Appl. Phys. 109 084314
[41] Dutta K and De S K 2007 Optical and electrical characterization of polyaniline–silicon dioxide nanocomposite Phys. Lett. A361 141–5 [42] Dutta K, De S and De S K 2007 Optical and electrical characterizations of self-assembled CdS nanorods–polyaniline composites J. Appl.
Phys.101 093711
[43] Gupta K, Jana P C and Meikap A K 2011 Synthesis, electrical transport and optical properties of polyaniline–zirconium nanocomposite J. Appl. Phys.109 123713
[44] Dey A, De S, De A and De S K 2004 Characterization and dielectric properties of polyaniline–TiO2nanocomposites Nanotechnology15 1277–83
[45] Ambrosetti G, Grimaldi C, Balberg I, Maeder T, Danani A and Ryser P 2010 Solution of the tunneling-percolation problem in the nanocomposite regime Phys. Rev. B81 1–12