HAL Id: halshs-02482643
https://halshs.archives-ouvertes.fr/halshs-02482643
Preprint submitted on 18 Feb 2020
HAL is a multi-disciplinary open access archive for the deposit and dissemination of sci-entific research documents, whether they are pub-lished or not. The documents may come from teaching and research institutions in France or abroad, or from public or private research centers.
L’archive ouverte pluridisciplinaire HAL, est destinée au dépôt et à la diffusion de documents scientifiques de niveau recherche, publiés ou non, émanant des établissements d’enseignement et de recherche français ou étrangers, des laboratoires publics ou privés.
Education supply and economic growth in
nineteenth-century France
Adrien Montalbo
To cite this version:
Adrien Montalbo. Education supply and economic growth in nineteenth-century France. 2020. �halshs-02482643�
WORKING PAPER N° 2020 – 06
Education supply and economic growth
in nineteenth-century France
Adrien Montalbo
JEL Codes: I25, N13, N33
Keywords: primary instruction, economic development, nineteenth-century France
Education supply and economic growth in
nineteenth-century France
Adrien Montalbo
∗†February 14, 2020
Abstract
The role played by education in the transition from stagnation to growth has been highly debated. Two questions related to this debate remain open: did education impact the economic take-off of countries and their move towards a sustained economic growth ? What level of education was the most relevant during this transition process ? In this article, I investigate these two questions by studying the effect of primary schooling on the economic development of French municipalities during the 19th century and up to World War I. To do so, I rely on a quasi-natural experiment, the Guizot law of 1833. This piece of legislation made mandatory for each municipality over 500 inhabitants to open and fund a primary school for boys. This law constitutes the first coercive measure on schooling supply undertaken by the French state. By implementing a regression disconti-nuity around the 500-inhabitant threshold defined by the law, I identify a positive impact of primary instruction on the subsequent growth of municipalities. Therefore, primary schooling, and the acquisition of elementary skills, played a major role in the development of French municipalities during the century of industrialisation and modernisation. This more generally reveals a positive impact of basic education during the transition from stagnation to growth.
JEL codes : I25, N13, N33
Keywords : primary instruction, economic development, nineteenth-century France
∗Paris School of Economics, montalboadrien@gmail.com, 0782860449. Montalbo Adrien, Lieu dit
Monter-mont, 73460 Notre Dame des Millières. Declarations of interest: none.
†I am grateful to Jerôme Bourdieu, Lionel Kesztenbaum, Eric Maurin, David Mitch, Charlotte Le Chapelain
and Gabriele Cappelli for helpful comments. I am also grateful to participants at the 2019 EHES Conference in Paris and at the 2020 ADRES Conference in Lyon. I would like to thank Anne-Marie Chartier and André Oliva for helping me access the archives and sharing data on the Guizot Survey.
1
Introduction
The contribution of education to contemporaneous economic growth has been vastly investi-gated. Schooling appears to be a strong predictor of economic growth and per capita income,
either at the national of regional level1. However, the role played by education and human
capital during the Industrial Revolution and the transition from stagnation to growth is much more debated. In the British case, literacy was for example useless to perform the vast majority
of occupational tasks in the mid-nineteenth century [Mitch, 1993]2. Its level was low compared
to Scandinavian countries as Sweden, which nonetheless lagged behind in terms of economic
development [Sandberg, 1979]. Generally speaking, literacy has been deemed irrelevant to
ex-plain growth at the country level [Allen, 2003]. More recent studies however found a positive
association between upper-tail knowledge, proxied by book production, and pre-industrial
eco-nomic growth at the country level [Baten and van Zanden,2008], [de Pleijt and Zanden,2016]3.
[Squicciarini and Voigtländer, 2015] also identified a similar association in the late eighteenth and early nineteenth-century France, using data on subscriptions to the Encyclopédie at the level of French cities and departments. If upper-tail knowledge favoured growth and industri-alisation up to the mid-nineteenth century, "basic" or "average" education was related to the
industrial development of Prussia during the nineteenth century [Becker et al.,2011], [Cinnirella
and Streb, 2017]. In the French case, intermediate human capital expansion was favoured by
industrialisation at around the same time [Diebolt et al., 2019]. Therefore, if the contribution
of human capital to the transition from stagnation to growth still needs more pieces of evidence, the level of education which potentially influenced economic development also remains debated. In this paper, I evaluate the contribution of primary, and therefore basic, education to economic development in nineteenth-century France and until Word War I. To evaluate the contribution of this schooling level during the transition from stagnation to growth, I rely on a quasi-natural experiment, the Guizot law of 1833. This law made mandatory for each municipality more than 500 inhabitants to open and fund a primary school for boys. It constitutes one of the first
national legislation on education in France4 and is the first coercive law aiming at increasing
1Education has been analysed as a potential driver of long-term sustained growth in the endogenous growth
literature [Lucas,1988], [Romer,1990], [Galor and Weil,2000] or as a mere factor of production in neo-classical models [Mankiw et al., 1992]. See [Romer, 1990], [Benhabib and Spiegel, 1994] or [Gemmell, 1996] for early empirical evidence and [Krueger and Lindahl, 2001], [de la Fuente and Doménech, 2006], [Cohen and Soto, 2007], [Ciccone and Papaioannou, 2009] for more recent confirmations relying on the Barro-Lee data [Barro and Lee,1993]. Recent studies also exhibited a positive link between education years and regional development [Gennaioli et al., 2013]. See [Klenow and Bils,2000] or [Pritchett,2001] for a discussion about the potentially over-estimated effect of education. See [Card,1999] or [Ashenfelter et al.,1999] for a literature review on returns to schooling.
2The 1841 census for England indicates that only 4.9% of men and 2.2% of women had an occupation where
literacy was absolutely necessary. The respective percentages for jobs with no need of literacy were of 49.7% and 24.7% [Mitch, 1993]. See also [Galor and Moav,2006] on this point.
3See also [van Lottum and van Zanden, 2014] on the importance of skills in the maritime sector before the
industrialisation.
4The 1816 law, which made mandatory to obtain a certificate in order to teach within primary schools, is
schooling supply5. In practical terms, this supply meant hiring a teacher. Indeed, the majority
of small municipalities had not enough economic resources to build or rent a schoolhouse6. In
this case, teaching was most often delivered at the teacher’s house or within the town hall [Mayeur, 2004]. To investigate the impact of the Guizot law, I rely on a newly constituted database at the level of municipalities collected just before the passing of the law, in 1833. These data cover 22 departments and more than 8 000 municipalities. I select municipalities without primary schools in 1833 close to the population cut-off of the Guizot law to implement a regression discontinuity and investigate the impact of education on economic resources. The outcome variable used to approximate the level of municipal economic resources is the amount of taxes per capita collected by municipalities in 1881 and 1911. This follows what has
been used in [Becker and Woessmann,2009] or [Cinnirella and Streb,2017] for example. I
pro-vide indications that taxes were closely correlated to production and disposable income at the department level, and that they constitute a good proxy for the level of economic resources. For municipalities above the 500-inhabitant threshold, I find a positive effect of schooling supply on the subsequent level of economic resources in 1881 and 1911, with a magnitude close to 2 francs per capita. This corresponds to around two-thirds of a standard deviation in municipal re-sources for municipalities close to the threshold. Therefore, the discontinuity design associated to the Guizot law and exploited in this paper suggests a positive impact of primary schooling supply on the economic growth of municipalities during the second part of the nineteenth-century. Since attendance to primary schools was not made mandatory until the Ferry Laws of 1881-1882, this implies that a high percentage of families reacted to the positive supply shock on education by schooling their children. This is confirmed by several monographic evidence [Thabault, 1993], [Blanc and Wacziarg, 2018].
In this paper, I also mention the potential transmission channels between education and eco-nomic development during the nineteenth century. More jobs were requiring to master at least literacy during its second part, which can explain part of this association. Also, the diffusion of technological progress may have been faster in municipalities where education was more developed, especially in the agricultural sector. Lastly, primary schooling may have attracted people with a higher preference for education. These migrations might therefore have in turn reinforced the positive effect of instruction on workers’ productivity by increasing the share of educated people within a given municipality.
This article contributes to the literature on human capital by investigating its association with economic development in the age of industrialisation and modernisation. Indeed, the nineteenth century, and especially its second part, was characterised by a surge in industrial activities in France. Moreover, the agricultural sector saw its apogee at that time before entering a phase
of crisis from the 1880s to the World War I [Duby and Wallon, 1976]. This paper therefore
5Some attempts to increase the supply of primary schools did exist before the Guizot law. Indeed a decree,
approved on the 17th of November 1794 under the initiative of Lakanal, made the presence of one school per one thousand inhabitants mandatory. This measure was however contradicted by another decree one year later which suppressed the compulsory character of the schooling presence.
documents the contribution of education in the transition from stagnation to growth. It is directly linked to studies which found a positive association between education and growth in
the pre-industrial era [Cipolla, 1969], [de Pleijt, 2018]. High educational achievements have
notably been associated to the Little Divergence between England, the Low Countries and the
rest of Europe over the 1300-1800 time period [Baten and van Zanden, 2008], [de Pleijt and
Zanden,2016]. The association is however not valid for all European countries [Sandberg,1979].
Literacy seems also to have been irrelevant for the industrial development of Britain [Mitch,
1993],[Allen, 2003], [Clark, 2005] while basic human capital was closely linked to
industrialisa-tion in nineteenth-century Prussia [Becker et al.,2011], [Cinnirella and Streb,2017]. In the case
of France, [Squicciarini and Voigtländer, 2015] show a positive effect of upper-tail knowledge
on city growth and industrial performance during the onset of industrialisation, while [Diebolt
et al., 2019] exhibit that steam engines were related to the expansion of intermediate educa-tion7.
Compared to these existing studies, this paper makes several contributions. It provides an evaluation of the causal impact of education on growth during the industrialisation period. Thanks to the quasi-natural experiment of the Guizot law, this impact can be estimated with-out mixing the influence of education with the one of institutions, geography, culture, the level of past economic resources, ... This reveals the importance of basic education for growth dur-ing the nineteenth century. Also, it indicates that changes in schooldur-ing levels, induced by the increase in schools’ supply, were important drivers of economic growth at that time. Moreover, measuring education and economic resources at the municipality level implies a substantial gain in precision compared to studies at the level of towns or counties. Indeed, most of the studies focusing on towns rely on population growth as a proxy for economic development, while department-level analyses are likely to at least partially confound the effect of education with other factors. Taxes per capita, used in a quasi-experimental design at the municipality level, are therefore a more reliable proxy for economic resources and induce a better estimation of the schooling impact. Finally, since around 90% of the municipalities were less than 2 000 inhabitants in nineteenth-century France and that the urban population overcame the rural
one only in 19318, this study helps explaining the economic trajectory of the vast majority of
local places in France.
The next section presents some historical facts about the Guizot law, primary schooling and economic development in nineteenth-century France. Section 3 is a description of the data I use while Section 4 presents the results from the regression discontinuity design approach. Section 5 concludes.
7This paper is also close to development economics analyses linking schooling supply and economic outcomes
as in [Duflo, 2001].
8Urban population represented around 25% of total population in the mid-nineteenth century in France, and
2
Primary Education and Economic Development Over
the Nineteenth Century
2.1
Primary Schooling and the Guizot Law
The Guizot Law was passed on the 28th of June 1833, making compulsory for any municipality over 500 inhabitants to open and maintain a primary school for boys. Teachers were to be paid on a regular basis, not less than 200 francs a year. This law was the first major step towards universal schooling undertaken in France. To this date, the decision to open a primary school (along with paying the teacher on a fixed basis or not, how much, buying books, blackboards and other pieces of furniture, providing the teacher with an accommodation or a classroom,...)
was mainly made at the level of municipalities9. Local authorities thus played an important
role, along with parents who were in most cases (except when they were listed as indigents by the municipality or when the school was totally free, which was extremely rare at that time) paying fees so that their children could attend school. Before the passing of the law, primary schools were divided into two types. Those only financed by the monthly tuition fees paid by families to the teachers were said to be private. When municipalities were investing in schools, by paying teachers or providing them with a classroom or an accommodation for example, the schools were said to be public. From 1816, a certificate delivered by local authorities and the parish priest was necessary to teach within primary schools. Anyone who obtained one of the three different certificate degrees, the first one being the hardest to get, could freely teach children.
In this context, primary schooling developed differentially across regions [Kennedy and Netter,
1981]. From the early work of the Dupin baron, an opposition has been drawn between a
well-educated France above the Saint-Malo/Geneva line and a less-well-educated one below [Dupin,1826],
[Fleury and Valmary,1957], [Houdaille,1977]. For example, in the 1820s, the enrolment per 100 children six to thirteen years of age was higher north of the line, with a mean of 94, compared
to south of it, with an average level of 53. This was also true for the schooling of girls [Grew
and Harrigan, 1991]. Figure 1depicts this distinction between French departments. Therefore, before the Guizot Law, primary schools and high enrolment rates were mostly concentrated in the north-east part of France, even if some other regions as the Rhône Valley and the Gironde were also characterised by rather good schooling levels. This pattern remained stable at least until the 1860s in France, even if a convergence in educational attainment was already at
work before the Ferry Laws of 1881-1882 [Diebolt et al.,2005], which made primary schooling
compulsory. The number of children schooled per 10 000 inhabitants, for example, still followed
9A precise description of the daily life of schools and teachers in the eighteenth and early nineteenth centuries
can be found in [Duveau,1957]. Analyses or testimonies on the state of primary schooling by teachers from the early nineteenth century are available in [Lorain,1837] and [Meunier,1981]. In order to have an analysis of local schooling development in the eighteenth century, see for example [Vovelle, 1975] or [Laget, 1971]. See [Gildea, 1983] for a local study from 1800 onwards for the departments of Ille-et-Vilaine, Gard and Nord. In order to have a full political analysis and a description of the laws, projects, and debates about primary instruction during this period of time, one can refer to [Gontard,1959], [Mayeur, 2004] and the second and third chapters in [Furet and Ozouf, 1977].
closely the geographical distribution described in the mid-1850s and mid-1860s. The same is true for percentage of women or men signing their marriage license in 1871-1875.
St-Malo Genève (758,1263] (381,758] (281,381] [108,281] No data
Figure 1: Number of pupils attending primary schools - winter 1833 (over 10 000 inhabitants)
Source: [Motte et al.,2003], Guizot survey - Report to the King.
Note: Departments in blue are the ones for which education data are available at the level of
municipalities.
The schooling of girls followed a different path as, until late into the 19th century, numerous religious congregations were in charge the schooling of girls. For example, the Ursulines in the south-east, the Filles de Notre-Dame, the Sœurs de la Charité de l’instruction chrétienne or
the Filles de la Visitation within the Parisian region [Mayeur, 2004]. But for the majority of
them, no education was provided outside of the family sphere. They were not supposed to be taught along with boys within primary schools. However, it was common to gather both sexes
when economic resources were too scarce to create two distinct schools10. It is only with the
Falloux Law of 1850 that the opening of a primary school for girls in municipalities more than 800 inhabitants was made compulsory. The Duruy Law of 1867 lowered the threshold to 500 inhabitants. The Ferry Laws then applied to girls too.
2.2
Economics Growth in Nineteenth-Century France
The nineteenth century was, for most Western countries and for France, a period of economic modernisation and growth. Industrial production began to grow substantially from 1815
on-wards in France, with an annual rate of 3% for the best years [Lévy-Leboyer, 1968] compared
to around 0.5% between 1781-1790 and 1803-1812 [Crouzet, 1996]. The highest rates were
attained at the end of the July Monarchy and under the Second Empire. They subsequently
dropped below their average value over the century after 1882 [Crouzet, 1970]. This growth
10At the time of the passing of the Guizot Law, separated primary schools for girls were still rare. Victor
remained however quite gradual all over the century, which led some authors to deny the idea
of a real industrial take-off in France [Mendels, 1972]11. According to the Industrial survey of
1861-1865, textile and food industries were clearly the leading sectors even in the second part of the century. They represented respectively 31.4% and 20.8% of the industrial value-added,
against around 6% for extractive industries and 5% for the metallurgy [Verley, 1997]12.
The geography of industrial activities also evolved during this century. Data from the 1839-1847 Industrial survey show that manufactures were mostly concentrated in the north-west and western departments close to the Atlantic Ocean in the first part of the century. This concentration was associated to the volume of commercial activities in Atlantic ports like Le
Havre, La Rochelle or Nantes [Asselain, 1984]. Big manufactures and steam engines were on
the contrary more concentrated in the north and north-eastern parts of France, along with the Rhône Valley. This was associated to the progressive surge of mining and metallurgic sectors in France at that time, in particular to the exploitation of coal and iron. Deposits were indeed highly concentrated in the Nord-Pas-de-Calais, Lorraine, Auvergne, Loire, Dauphiné, Provence and Cévennes areas in France. In some regions as Normandie or the Dauphiné, the concomi-tant presence of rivers, forests and deposits explains the ancient presence of metallurgic sectors [Léon, 1948], [Richard, 1962], [Kellenbenz, 1963]. Textile activities also followed closely this
geographical pattern [Dunham, 1953].
Industrial activities were negatively affected by a general downturn towards the end of the century as the 1880s were particularly bad for French economy. Rural industry was severely altered by this crisis. Indeed, it had first to face the competition of cheaper British products after the free-trade treaty of 1860. Second, the growing unification of the national French mar-ket enhanced by the development of rail-roads increased the competition between large and small factories. This contributed to the progressive de-industrialisation of southern France, unable to compete with the triumphant metallurgic manufacturers of the northern and eastern regions. The concomitant agricultural crisis also reduced the purchasing power of rural inhabi-tants and therefore the outlets for industrial production. All of this favoured the migration and concentration of industrial workers in towns, which participated in the creation of the French
industrial working class [Noiriel,2002].
11This idea, along with the level of industrial performance of the French economy, have been greatly debated.
They have been deemed low and stagnating compared to Great-Britain in the 1940s and 1950s, before a revision-ist literature insrevision-isted on the relatively good economic performance of France during the 19th century and on the distinctive path of growth this country followed [Crouzet,1966], [O’Brien and Keyder,1978]. This point of view has subsequently been qualified by authors amending the figures on French productivity growth and insisting anew on the difficulties known by the agricultural and industrial sectors compared to the British ones [Crafts, 1977], [Crafts,1984]. See [Lévy-Leboyer,1978] for an analysis of French industrial investment and [Lévy-Leboyer and Bourguignon,1985] for a macro-economic analysis of French economy along the century. See [Crouzet,2003] for a historiography of French economic growth during the 19th century, from the "retardation-stagnation" thesis to the "moderate revisionism". To have an economic analysis and description of the industrialisation period in France and other European countries over the century, see [Braudel and Labrousse, 1976], [Verley, 1999] and [Verley, 1997]. For an analysis of the French case under the Ancien Régime, see for example [Sée, 1925] or [Woronoff,1998].
12The same was true when taking into account the percentage of the industrial labour-force in each sector.
50% of it was working in the textile sector at that time, 13% in the building one and 14% in the metallurgy [Noiriel,2002].
Agriculture still remained the sector gathering the highest share of the labour-force in nineteenth-century France. The 1851 census indicates for example that 53.2% of the total population was
belonging to a farming family [Demonet, 1990]. In 1881, 47.5% of the labour-force was
concen-trated in the agriculture, against 26.7% in the industry and 24.9% in services. The farms were most of the times small in France at that time. Their average surface area was of 12 hectares in the mid-19th century, but in half of the departments, half of the farms were less than 5 hectares.
Agricultural production increased by 75% in France between 1815 and 1852. The highest growth rates were concentrated under the July Monarchy and were mainly due to the dynamism of livestock farming. The production increased by 80% between 1852 and 1882 before being struck by a severe downturn as for the industry. This phenomenon characterised most of all root crops as sugar beets and potatoes whose cultivated surface area increased respectively by 116% and 61%. This was partly due to a growing individual consumption. Over the period, for example, the average annual consumption of wheat per capita increased by 34%, that of potato by 40% at least, the consumption of sugar by 118% and of meat by 40%. Livestock farming and wine production also peaked in the mid-1870s. Vineyards represented for example 2.5 millions of
hectares in 1874. Cereal production was on the contrary stagnating at that time. [Duby and
Wallon,1976].
The evolution was however far from being homogeneous as some regions were already charac-terised from the 1830s onwards by the rural exodus of their population. This was especially the case for the Massif Central, Lorraine, Alsace, the alpine department and the wooded country-side of Normandie, Maine and Jura. The growth of agricultural production characterised most of all the regions located south of the line going from St-Malo to Geneva. Moreover, the trade balance remained in deficit for many agricultural products. Productivity growth stagnated and a large part of the increase in production appears to have been due to rising prices.
The end of the century downturn is due to several factors. First, a number of specific crises, as the phylloxera in wine and a series of diseases in silk farming. Second, the globalisation of trade and an increased competition affected negatively agricultural prices. Third, rural exodus accentuated strongly in the second part of the century, especially in peripheral areas. 55 de-partments knew a negative evolution of their population between 1881 and 1911, 62 of them between 1901 and 1911. Rural population went from 74.5% to 64.1% and 55.8% of the total
population in 1851, 1866 and 1911 [Beltran and Griset, 1994]13. In this context, agricultural
production declined for all products, except for potato and fodder crops. The political reaction to this crisis was a return to more protectionism, notably embodied by the Meline Law in 1892 which increased customs duties on agricultural products.
3
Data
3.1
Data on Education
In 1833, when the Guizot Law was passed, a survey at the national level was conducted in order to evaluate the state of primary schooling in France, under the supervision of the French
Min-ister of Education, François Guizot14. 490 inspectors were sent throughout France in autumn
1833. All primary schools, both public and private, were to be examined. However, primary schools to which only girls were attending were excluded from the scope of the survey as the Guizot law did not apply to them. All departments were inspected, except Corsica.
Data coming from the Guizot Survey of 1833 was published for all French districts in a Report to
the King [Guizot, 1834]. These districts (arrondissements départementaux or sous-préfectures) correspond to an administrative subdivision of departments (counties). Two to six of them ex-isted in each department. Only some of the questions asked in the initial survey, those deemed of major interest, were aggregated in this report. From the initial individual (at the level of each
primary school) forms, the data were collected for 22 departments and 8 129 municipalities15.
This study will however be made on 21 departments. Indeed, the Bas-Rhin department was not belonging to France any-more after the 1870 Franco-Prussian War. Data on its economic resources are therefore not available at the end of the century. At least one primary school was present in 4 836 of the municipalities (59.5%). This project has been initiated by the Service
d’Histoire de l’Education of the I.N.R.P, which collected data for the academies of Nantes,
Bourges and Nîmes. Other departments were then added to this initial database. In Figure 1,
one can see that these departments (in blue) belong to areas with very different levels of en-rolment. The Britanny region and the centre part of France with very low levels of enrolment are well represented in the sample. So are the highly educated north-east and the southern part of the country where education was more unevenly distributed, with five departments for each area. To sum up, around 20% of the departments above the St Malo-Geneva line are
represented in the sample, against 25% of those below the line16. This should ensure a high
variation in terms of education and a good representativeness of the data used. Their collection was indeed conducted with the aim of catching all the determinants that underpinned primary schools spreading. This, added to the focus at the municipal level, should help avoiding some of the criticisms that were pronounced against the reliance of aggregated historical data on
primary schools17.
The departments selected are quite representative of France for what regards primary education and economic characteristics in the first part of the nineteenth century. Taking average values
14A lot of information on this survey is available here : http://www.inrp.fr/she/guizot/.
15These departments are: Ardèche, Ardennes, Cher, Corrèze, Côtes-du-Nord (Côtes D’Armor), Finistère,
Gard, Gers, Indre, Indre-et-Loire, Loire-Inférieure (Loire Atlantique), Loiret, Lozère, Marne, Morbihan, Nièvre, Oise, Bas-Rhin, Saone-et-Loire, Seine-et-Marne, Deux-Sèvres and Vaucluse. At that time, there were 86 de-partments. Current denominations of departments are specified in brackets when a change occurred.
16Excluding the three departments located on this very line.
17See for example on this point the criticisms made in [Luc, 1986] and [Luc and Gavoille, 1987]. See [Grew
at the level of districts in order to compare this "municipal level sample" to the entire country
thanks to the Report to the King18 shows that the number of (public) primary schools doesn’t
differ significantly between the sample and the entire country. However, enrolment rates and the percentage of municipalities with schools (60.8% against 71.5% for France) are lower in the sample, which means that the departments at stake were less well-endowed in primary schools than at the national level.
Taking data on the height of 20-years old military conscripts to proxy economic resources19
shows that the departments in the sample were close to the average national level. When considering industrial factors, the sample differs significantly only in the percentage of munici-palities with factories (21.6% against 17.2% for France). The number of workers, their average wages, the amount of industrial production or the presence of large factories (more than 20 workers, the top one-third in terms of size) did not differ significantly between France and the municipality sample. Finally, using the Agricultural survey of 1852 shows no strong difference between France and the municipality sample. Either in terms of agricultural area, production organisation or wages, the sample is quite comparable to national averages.
3.2
Data on Economic Resources
In this article, the economic variable of interest is the amount of taxes per capita collected by municipalities. These data are coming from publications by the Ministry of the Interior entitled
La Situation Financière des Communes de France et de l’Algérie20, issued each year from 1878 to 1929. I digitalised the 1881 and 1911 years in order to have a measure of the economic resources of municipalities at the end of the growth phase in nineteenth-century France and
just before World War I21. I selected two years for several reasons. First, it enables me to
check if the results obtained are not linked to a particular year. Second, I am able to study the persistence of the effect of education on resources. Lastly, knowing the timing when education potentially influenced development is useful in specifying the transmission channels between the two phenomena. Data from the industrial survey of 1839-1847 are the other economic data
used in order to control for industrial production in the estimations22.
The nineteenth century was a time of index-based taxation for the state and the municipalities. This system, implemented during the revolutionary period, remained remarkably stable all
18See inTable A1the Appendix.
19Data on the height, collected at the level of districts for the 1818-1830 time period on 489 160 twenty years
old conscripts (that is to say on men born between 1798 and 1810) is presented and analysed in [Aron et al., 1972]. In 1804, Napoléon instituted a random draw to select the conscripts. Therefore, there is no selection bias with these data as each young men had the same probability to serve. The average height was clearly mirroring the economic development of France. This is in line with other studies exhibiting strong correlations between height, living and health conditions, work at young ages, nutritional intake, ... during the 17th and 18th centuries [Komlos et al., 2003], the 19th century [Villermé, 1829], at the end of this former and during the following [Chamla, 1964], [Meerten, 1990], [Brinkman et al., 1988]. See [Steckel, 1995] for a review of the literature on this point.
20The financial situation of municipalities of France and Algeria.
21I selected these years and not 1878 and 1913 for example because they were also census years. I thought
that the quality of the data could be improved by this.
along the century and no major modifications were implemented to it before the creation of the income tax in 1914. The Assemblée Constituante implemented in 1791 a land tax, a personal property tax on incomes coming from other sources than land and commercial activities and a patente tax on these commercial resources. An additional tax on the number of doors and windows of habitations was later implemented in 1798. These four taxes, known as the Quatre vieilles, constituted the direct "contributions", as they were called, entering the state and municipalities budgets.
The land tax was based on net incomes coming from the use of lands23, which were evaluated
on the 15 preceding years24. The personal property tax was composed of two distinct elements:
the taxpayer had first to pay an amount equal to the average value of three workdays. This amount was fixed in each department. The second part of the tax was based on the rental value of personal residential buildings. The basis of the patente tax was incomes coming from trade and industry. However, it is only by means of rental value that these resources were taxed. The patente amounted to a percentage between 10 and 15% of the rental value of buildings. In industry, additional component depended directly on the number of workers and engines used
in the production process [Chanut et al.,2000]. Bakers had the privilege to pay half the tariff
while beverage merchants had to pay the double. Since any trading activity was taxed by the
patente, it reflects perfectly the commercial and industrial activity of the municipalities. The
tax on doors and windows was positively related to their number and size. After 1832, the amount was higher in more populous municipalities. Also, the patente was the only flat tax of the four, the other other three were "impôt de répartition", which means that the amount expected to be drawn from them was decided first by the state, and then divided between
municipalities according to their estimated economic resources [Neurrisse,1996].
Municipalities could also decide to increase what they were perceiving from these taxes by collecting "additional cents" on them. This was done by increasing the rate of the taxes. For example, collecting 3 additional cents was equivalent to ask taxpayers to pay 3 cents more for each franc of tax, which amounted to an increase of 3% in the rate. This was usually implemented to built or maintain byroads or in case of deficit. Additional taxes as the one on dogs implemented in 1855, on private pool tables (1871) or velocipede (1893) were also entering the municipalities’ budget but they were marginal compared to the four direct taxes described. Municipalities could also make use of resources coming from the octrois, which corresponded
to indirect taxes on products imported and sold within the delimitations of the municipality25.
However, only the biggest municipalities were concerned by these indirect taxes. 1 538 of them
were raising octrois in 1881, 1 523 in 191126.
23It is only in 1881 that a distinction between built-up and non-built-up property was introduced. Built-up
property was from then on taxed according to its rental value.
24The two best and worst years were excluded from the computation. See for example [Kang,1993] on this
tax.
25These octrois had been suppressed in 1791 and progressively reintroduced from 1798 onwards. Taxes on
beverages were for example re-established in 1804, in 1806 for those on salt.
26They could constitute a crucial source of income for big municipalities. For example, in 1913, half of the
resources of Paris were coming from these indirect taxes. The budget of the state was also critically depending on indirect taxes. Registration duties, customs duties and taxes on sales of beverages and transports were
The crucial point here is to know if the amount of taxes per capita adequately reflects the economic resources of local places. One could argue for example that taxes per capita mirror state capacity rather than a higher income. However, it is clear that taxes were closely related to other proxies for economic dynamism at the end of the 19th and beginning of the 20th
century in France. Taking average daily wages at the level of departments from [Bassino and
Dormois, 2006] returns a correlation of 0.69 with the amount of taxes per capita in 1911. The geographical distribution of both measures was extremely close at the beginning of the 20th
century in France27. Taxes were therefore higher within departments with a higher productivity.
A direct assessment of the relation between taxes and production can be done at the department
level, thanks to the data on disposable income per capita reported in [Delefortrie and Morice,
1959]. Over all French departments, the correlation between disposable income per capita in
1864 and the taxes per capita in 1911 was of 0.64. Even if the two measures may seem distant one from the other, this shows that taxes and production were closely related at this time in France, which reinforces the reliability of taking the amount of taxes as a proxy for economic
resources 28.
3.3
Demographical Data on Municipalities
Data on the population of municipalities from the censuses is taken from [Motte et al., 2003].
Population dispersion is taken from the Postal Survey of 1847 along with the surface area of
municipalities which have disappeared or merged since 183329. Since this survey is posterior
to the Guizot one, I have to assume that population remained stable over the fourteen years separating them, which seems to be a quite reasonable assumption. The Institut national de
l’information géographique et forestière, a public institute in charge of the diffusion of geographic
information in France, provides surface data for the other municipalities. The altitude of
municipalities is also taken from this institute.
3.4
Descriptive Statistics
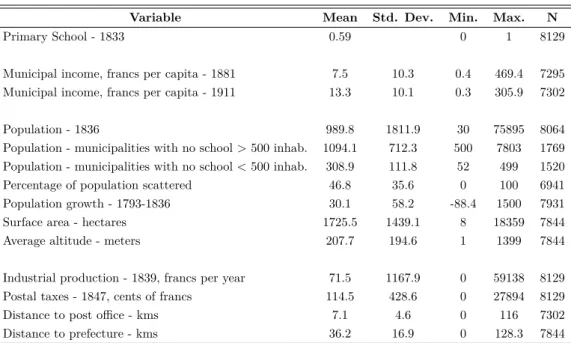
Descriptive statistics are displayed in Table 1. Primary schools were located in 59% of the
municipalities in the data. The average taxes per capita nearly doubled between 1881 and
1911, from 7.5 to 13.3 francs30. This increase may partly reflect economic growth. It is also due
to the fact that, after 1905 and the passing of the law separating churches and state, resources saved from the suppression of worship budget were split between municipalities according to their contribution to land tax on non-built property.
The average population of the municipalities was around 990 inhabitants in 1836, but 50% of them were less than 631 inhabitants and 90% less than 2 000. Population dispersion could be
constituting half of its budget in the 1830s, 53% in 1913. Direct taxes followed the opposite trend, from 30% to 10% of the budget between the same dates.
27SeeFigure B1in the Appendix. 28SeeFigure B2in the Appendix.
29More information on this survey is available in [Marin and Marraud,2011].
high within municipalities as the average scattering was around 47%, with a median value close to 50%.
Table 1: Summary Statistics
Variable Mean Std. Dev. Min. Max. N
Primary School - 1833 0.59 0 1 8129 Municipal income, francs per capita - 1881 7.5 10.3 0.4 469.4 7295 Municipal income, francs per capita - 1911 13.3 10.1 0.3 305.9 7302 Population - 1836 989.8 1811.9 30 75895 8064 Population - municipalities with no school > 500 inhab. 1094.1 712.3 500 7803 1769 Population - municipalities with no school < 500 inhab. 308.9 111.8 52 499 1520 Percentage of population scattered 46.8 35.6 0 100 6941 Population growth - 1793-1836 30.1 58.2 -88.4 1500 7931 Surface area - hectares 1725.5 1439.1 8 18359 7844 Average altitude - meters 207.7 194.6 1 1399 7844 Industrial production - 1839, francs per year 71.5 1167.9 0 59138 8129 Postal taxes - 1847, cents of francs 114.5 428.6 0 27894 8129 Distance to post office - kms 7.1 4.6 0 116 7302 Distance to prefecture - kms 36.2 16.9 0 128.3 7844
Source: Guizot, industrial and postal surveys. IGN data, [Motte et al.,2003] and La Situation Financière
des Communes.
Notes: All variables are defined at the municipal level. The postal taxes correspond to the amount of taxes
collected on postal activity within the two-week period when the postal survey was conducted.
4
A Regression Discontinuity Design Based on the Guizot
Law
4.1
A Discontinuity in Economic Resources
Since the measure of economic resources I consider is posterior to the one of schooling, there is no reverse causality issue here. However, one might fear that wealthy municipalities would invest more in education at the beginning of the century, these very municipalities being also characterised by high amount of resources later on. In this case, the effect of schooling would be badly estimated with simple OLS. Therefore, I take advantage of the fact that the Guizot law made mandatory for municipalities more than 500 inhabitants to open and finance a primary school after 1833. To this date, municipalities had no legal obligation to do so. Thanks to the Guizot survey, I can know which municipalities had no school at that time. I can therefore select them and apply a regression discontinuity around the threshold of 500 inhabitants to
evaluate the impact of the schooling supply shock implied by the law31.
Censuses were conducted every five years in nineteenth-century France. Population is taken
from the 1836 Census, three years after the passing of the Guizot law. This census has been deemed of better quality by the historians and its population figures should therefore be more reliable. Also, it makes more sense taking population from this census. Indeed, a municipality with more than 500 inhabitants in 1831 could very well have lost some of them between this date and the Guizot law, falling below the population threshold. 50 municipalities with no schools in the database did follow this evolution. Taking them as being affected by the Guizot law would therefore be a mistake. The discontinuity remains however greatly unchanged taking population from the 1831 Census.
As displayed in Table 1, there are 3 289 municipalities in my database with no primary school
in 1833. Among them, 53,8% are above the threshold of 500 inhabitants (1 769 over 3 289). The average population of municipalities with no school and above the threshold of the Guizot law was of 1 094 against 309 for those below the threshold. All municipalities over 7 803 inhabitants had at least a primary school in 1833. 60% of the municipalities above the threshold were less
then 1 000 inhabitants and 91% less than 2 000 inhabitants32.
Using the Guizot law in a regression discontinuity design bears some drawbacks as I cannot know if municipalities below the threshold opened or not a school just after 1833. However, as they were very small and had not done so before, there is only a very little probability that a high number of municipalities just below the threshold would do so right after the law while they had no legal obligation to open a school. Therefore, these municipalities were certainly characterised by a long-lasting absence of primary school during the nineteenth-century. If some of them did open a school anyway, the following estimations would return a lower bound for the impact of primary schooling on economic development.
Finally, I can’t measure the effect of human capital accumulation using this strategy. I will therefore only be able to evaluate the impact of an increase in schooling supply on growth. However, monographic studies report that the positive supply shock on education caused by the Guizot law contributed to increase significantly enrolment rates. Families often reacted strongly to the presence of a teacher as enrolment rates and literacy increased rapidly after
the passing of the law [Thabault, 1993], [Blanc and Wacziarg, 2018]. Therefore, the shock in
schooling supply was very likely to be associated with a higher human capital accumulation in the municipalities at stake.
In Figure 2, I plot the data-driven regression discontinuity in municipal resources in 1881 and 1911 according to the spread between municipal population in 1836 and the 500-inhabitant threshold. The resources per capita were decreasing in population between 100 and 500 in-habitants. Very small municipalities had therefore on average higher economic resources per capita than municipalities around the 500-inhabitant threshold. There is a jump in resources around this threshold, which indicates a discontinuity related to the presence of a primary
school33. Indeed, total municipal resources were higher just above the population threshold,
which explain the jump in resources per capita. These graphs indicate that the positive shock
32See the histograms of the population above and below the threshold inFigure B4 in the Appendix. 33Figure B5the Appendix reports the same figure using the 1831 population. This modification doesn’t affect
on schooling supply and human capital induced by the Guizot law affected positively the level of municipal resources during the nineteenth century and up to World War I.
0
5
10
15
-400 -200 0 200 400 Sample average within bin Polynomial fit of order 1
Resources per capita, 1881
5 10 15 20 25 -400 -200 0 200 400 Sample average within bin Polynomial fit of order 1
Resources per capita, 1911
1000 2000 3000 4000 5000 6000 -400 -200 0 200 400 Sample average within bin Polynomial fit of order 1
Total resources, 1881 2000 4000 6000 8000 10000 -400 -200 0 200 400 Sample average within bin Polynomial fit of order 1
Total resources, 1911
Figure 2: Data-driven regression discontinuity in municipal resources and municipal resources per capita
Source: Guizot survey and La Situation Financière des Communes.
Notes: On the x-axis, the distance in terms of population to the 500-inhabitant threshold is displayed.
The polynomial fit used is of order one. The number of bins has been selected through the mimicking variance evenly-spaced method using spacings estimators. For the resources per capita and the 1881 year, 38 bins are selected left to the threshold, with an average length of 9 inhabitants (the same for the total resources). 36 bins are selected right to the threshold, with an average length of 9.7 inhabitants. The respective figures for 1911 are of 43 and 35 bins, with average lengths of 8 and 10 inhabitants. For 1911 and the total resources, the figures are of 61 and 39 bins, with average length of 6 and 9 inhabitants.
4.2
Main Estimation Outcomes
As recommended in [Imbens and Lemieux,2008] or [Lee and Lemieux,2010], one should check
several conditions in order to account for the reliability of the regression discontinuity approach. The first one is the continuity of the running variable density (here population) around the
threshold. If this variable can be completely manipulated by the units in order to obtain or avoid a given treatment, then the regression discontinuity will be biased. If the manipulation is only
partial, the estimations will remain valid [McCrary,2008]. In this case, a complete manipulation
would arise if, knowing the 500-inhabitant threshold of the Guizot law and anticipating its passing, municipalities around this threshold tried to artificially lower their population level in order to avoid having to open and fund a primary school. This seems to be unlikely. This idea is reinforced by a graphical analysis exhibiting no discontinuity of population density around
the threshold34. A manipulation test, implemented following [Cattaneo et al., 2018], returns
a p-value of 0.6591, confirming the fact that municipalities did not manipulate the forcing variable around the threshold.
Finally, two important things remain to check when working with regression discontinuities. First, one needs to investigate the continuity of covariates around the threshold. Second, it is necessary to run falsification tests in order to show that there is no other discontinuities having an impact on the variable of interest. Indeed, a discontinuity in covariates would cast doubt on the comparability between municipalities above and below the threshold. Also, the existence of unexplained discontinuities around different population cut-offs would weaken the reliability
of the estimation. Outcomes of Table A2, Table A3 and Table A4 in the Appendix reject
these two issues. No covariate used differs significantly around the 500-inhabitant threshold35.
There is also no discontinuity in municipal resources per capita around other thresholds until
2 000 inhabitants, either for resources in 1881 or 1911. Above this number, checking for
discontinuity would lead to unreliable results as the number of municipalities without school falls dramatically. There is for example only 49 municipalities in the data between 1 900 and 2 100 inhabitants without school. These tests reinforce the strength and the reliability of the regression discontinuity design used in this paper.
Therefore, I turn to the estimations following the non-parametric model :
Y = α + τ D + β1(X − c) + β2D(X − c) + ε (1)
where Y if my variable of interest, namely taxes per capita in 1881 and 191136, and X the
population level. Let c be the treatment cut-off and D a binary variable equal to one if X ≥ c. Let h being the bandwidth of data used, then it follows that c − h ≤ X ≤ c + h. In this
model, different slopes and intercepts fit data on either side of the cut-off. In Table 2, I report
the estimation outcomes using a flexible linear and quadratic specification and using different population bandwidth, from 50 to 150 inhabitants. I report also a bandwidth of 105.9 for the year 1881 and 90.3 for 1911, selected as optimal bandwidths using the rdbwselect command in
Stata [Calonico et al.,2017]. The discontinuity, limited to this optimal bandwidth, is displayed in Figure B7in the Appendix.
34SeeFigure B6in the Appendix.
35The covariates are population dispersion, surface area, altitude, population growth between 1793-1836,
postal taxes, the distance to the post office and to the prefecture, the latitude.
36I selected taxes per capita and not total taxes so that the outcomes would be more meaningful and easier
Results show a positive impact of education on the economic development of municipalities, with a magnitude between 1.5 and 3 francs per capita depending on the bandwidth selected. As expected, the magnitude is higher closer to the threshold where the estimation is the more reliable and where the jump in economic resources per capita is the strongest. But the effect is robust to the choice of different population bandwidth. The magnitude of the impact appears to be high regarding the level of municipal resources around the threshold. Taking for example municipalities with an absolute deviation of at most 100 inhabitants from the cut-off, the average level of resources is of 5.5 francs per capita, with a standard deviation of 4.6. An increase of 3 francs per capita represents 2/3 of a standard deviation in resources around the threshold. Therefore, primary education contributed to increase significantly the economic resources of municipalities during the nineteenth century and until World War I.
Table 2: Non-parametric regression discontinuity estimates - Municipal resources per capita, 1881 and 1911
Flexible linear Flexible quadratic
(1) (2) (3) (4) (5) (6) (7) (8) (9) (10) RD Estimate - 1881 3.002*** 2.295*** 1.302* 1.159* 1.320** 3.180** 3.237*** 2.989*** 2.470** 1.739* (3.034) (2.745) (1.751) (1.745) (2.243) (2.126) (2.641) (2.693) (2.536) (1.932) Observations 347 500 694 804 957 347 500 694 804 957 Population bandwidth 50 75 105.9 125 150 50 75 105.9 125 150 RD Estimate - 1911 4.039*** 2.927*** 2.495** 1.744** 1.549** 4.711** 4.943*** 4.179*** 3.804*** 3.044** (3.190) (2.740) (2.473) (2.020) (2.013) (2.448) (3.187) (2.857) (2.959) (2.528) Observations 350 503 599 806 961 350 503 599 806 961 Population bandwidth 50 75 90.3 125 150 50 75 90.3 125 150 Covariates No No No No No No No No No No t statistics in parentheses ∗p < 0.05,∗∗p < 0.01,∗∗∗p < 0.001
Source: Guizot, industrial and postal surveys. IGN data, [Motte et al.,2003] and La Situation Financière des Communes.
Notes: I report the estimation outcomes using a flexible linear and quadratic specification and using different population bandwidth,
from 50 to 150 inhabitants. I report also a bandwidth of 105.9 for the year 1881 and 90.3 for 1911, selected as optimal bandwidths using the rdbwselect command in Stata [Calonico et al.,2017].
InTable 3, I run the same kind of model using a kernel estimation with the rdrobust command [Calonico et al., 2017] and the optimal bandwidth selection associated to it37. I stick to a local
polynomial or order 1, following [Gelman and Imbens,2019]38. The difference between columns
(1), (5) and (2), (6) is that I include covariates in the last two. These covariates are: population
dispersion39, surface area, altitude, population growth between 1793-1836, postal taxes, the
37See for example [Imbens and Kalyanaraman,2012] on the optimal bandwidth selection.
38The use of other polynomial degrees doesn’t modify the outcomes. SeeTable A5in the Appendix.
39taken as the share of the total population that did not match the contiguity criterion. See [Roncayolo,1987]
distance to the post office and to the prefecture, latitude, and a dummy variable indicating if the municipality at stake is in a department with a printing press in 1500. This last variable is included to account for the potential long terms effect of printing presses on the economic
development of municipalities via their effect on human capital [Dittmar, 2011]. In columns
(3) and (7), I add covariates which are also incorporated in the computation of the optimal bandwidth, which is not the case in columns (2) and (6). Finally, I cluster standard errors at the district level in columns (4) and (8) to account for spatial correlation in the schooling residual. All the specifications return positive and significant outcomes, with a magnitude of around 2 francs per capita. The impact of primary schools’ presence is therefore also robust to the inclusion of covariates, the choice of a kernel estimation and the use of clustered standard
errors40.
The results remain also consistent with the estimation of several robustness checks. The use of a coverage error rate (CER)-optimal bandwidth instead of a mean square error (MSE)-optimal one doesn’t modify greatly the outcomes. The is also true for the manual selection of various
bandwidths (the same as in Table 2) under the same kernel estimation41.
Table 3: Non-parametric regression discontinuity estimates - Municipal resources per capita
1881 1911 (1) (2) (3) (4) (5) (6) (7) (8) RD Estimate 2.009∗∗∗ 1.856∗∗∗ 2.417∗∗∗ 2.254∗∗∗ 3.166∗∗∗ 2.211∗∗∗ 1.815∗∗ 1.698∗ (2.63) (3.14) (3.45) (3.00) (3.00) (2.62) (2.41) (1.86) Controls 400 333 222 261 339 285 366 388 Treated Units 294 245 182 208 260 212 264 284
Covariates No Yes Yes Yes No Yes Yes Yes
Left Clusters 67 72
Right Clusters 62 66
Kernel Triangular Triangular Triangular Triangular Triangular Triangular Triangular Triangular
Order Loc. Poly. 1 1 1 1 1 1 1 1
Order Bias 2 2 2 2 2 2 2 2
BW Loc. Poly. 105.9 105.9 73.21 84.40 90.31 90.31 116.7 126.1
BW Bias 188.5 188.5 142.4 148.1 170.3 170.3 218.5 219.4
t statistics in parentheses
∗p < 0.05,∗∗p < 0.01,∗∗∗p < 0.001
Source: Guizot, industrial and postal surveys. IGN data, [Motte et al.,2003] and La Situation Financière des Communes.
Notes: In columns (3) and (7), I add covariates which are incorporated in the computation of the optimal bandwidth. This is not the case in columns (2) and (6) where the covariates are added without entering in the computation of the optimal bandwidth. I cluster standard errors at the district level in columns (4) and (8).
40As specified in [Lee and Lemieux,2010], the inclusion of covariates should not lead to a different outcomes in
a regression discontinuity design. Indeed, if the setting is good and therefore close to a randomised experiment, then the assignment to treatment is, by construction, independent of the baseline covariates. However, the adding of covariates reduces the sampling variability in the estimator. A substantive precision was gained as confidence intervals shrank by around 10% with the inclusion of covariates from column (1) to (3). This is in line with the recent work of [Calonico et al.,2019].
A potential issue associated to the use of tax data as a proxy for economic resources is linked to the funding of primary schools by municipalities. Indeed, one may imagine that municipalities impacted by the Guizot law would increase the amount of taxes collected to pay their newly hired teacher. Then, this would mechanically raise the taxes per capita without no link with a higher economic growth. Firstly, one should note that there was no specific tax created to finance education. Municipalities could therefore only try to levy more taxes by collecting additional cents on the four existing contributions aforementioned, which was likely to be rejected by the inhabitants. Secondly, municipalities could ask the departments or the state for financial assistance if their resources were too low to pay for the opening of the school. This was very likely to characterise small municipalities, close to the threshold of 500 inhabitants, that is to say those on which the regression discontinuity is applied. Therefore, as the funds needed to finance the primary school were certainly mostly coming from existing taxes or from the financial assistance of departments, it is unlikely that the Guizot law contributed to significantly increase the amount of taxes per capita at the municipality level and then drive the main part of the effect of education on growth.
Moreover, estimations on the level of resources in 1911 are not subject to this issue. Indeed, from 1886 onwards, all municipalities were legally forced to open and fund a primary school. Also, the Ferry Laws of 1881-1882 made attendance to primary schools mandatory. Therefore, all municipalities faced the same funding constraints in 1911 as they faced the same legal obligations on primary schooling. If the impact of the Guizot law on taxes was only due to the need to levy additional resources to finance the primary school, then this effect would only be observable in 1881 and disappear in 1911. This is why the estimations on the 1911 year constitute a robustness check with respect to this issue. As they remain positive and significant, this indicates that the effect of education on growth is not driven by the need to finance primary schools.
One additional problem which might arise using the Guizot law in a regression discontinuity design is linked to the fact that municipalities could exceed the 500-inhabitants threshold later during the century and therefore be forced to hire a teacher. The law indeed applied until 1886, when all municipalities were then legally forced to fund a primary school. Municipalities exceeding the threshold later are counted as non-treated in the previous estimations. The estimated impact of education is therefore a lower bound of the true effect. Higher the number of municipalities concerned by this late treatment, higher the spread between this bound and the true effect. The spread would also be larger if a high number of municipalities did exceed the threshold only a few years after the Guizot law. Indeed, the previous estimations rely on the fact that municipalities abiding by the new law were characterised by a positive shock on schooling supply and human capital. If municipalities belonging to the control group were treated in 1871 for example, this would not alter greatly the estimations as they would benefit from a shock on education only a few years before the first evaluation of economic resources I consider, in 1881. However, they would decrease the effect of education if they were treated in 1841 for example.
A more minor problem concerns municipalities with more than 500 inhabitants when the Guizot law was passed, by which lost population afterwards and went below this threshold. One might fear that these municipalities would consequently abandon their investment in education. This would also bias downward the estimated outcomes as these municipalities would be considered as treated while they were not any-more. As for the previous issue, this problem is more likely to arise if the population of these municipalities decreased shortly after the passing of the law. However, this threat is certainly less problematic compared to the previous one. Indeed, if a teacher was hired and paid by a municipality, and that education services were therefore
provided at a lower cost for families in comparison to private teaching42, municipal authorities
were very unlikely to take a step back and deprive families from these services. When a school
was present ad funded by a municipality, it extremely rarely disappeared afterwards [Prost,
1968]. Still, these two issues can be tackled thanks to the population data coming from the
censuses, even if this re-introduces some selection between the municipalities.
To control for these two issues, I introduced several population restrictions in Table A8 in the
Appendix. In column (1), I exclude municipalities with less than 500 inhabitants in 1836, but more than 500 in 1841. These municipalities, potentially opening a school only a few years after the first ones treated by the Guizot law, can bias downward the estimated effects of education
on growth43. In column (2), I only compare municipalities with more than 500 inhabitants
both in 1831 and 1836 to those with less than 500 inhabitants at the same dates. This controls for the fact that some municipalities may have abode by the new law in 1833, but lost some inhabitants between this date and 1836 and be included in the non-treated group. This concerns 50 municipalities. In column (3), I restrict treated municipalities as the ones with more than 500 inhabitants between 1831 and 1851. A continuous implementation of the law during 20 years should ensure a stable schooling supply within the municipalities at stake. Finally, in column (4), I adopt a more restrictive specification than in column (1) to drop municipalities which might bias downward the effect. I only consider as non-treated the municipalities with
less than 500 inhabitants between 1831 and 188144.
The outcomes remain highly unchanged under these various specifications. The magnitude of the education impact is always close to 2 francs per capita in the three first specifications. In the last specification, the most restrictive, the effect is however higher than the ones previously
42Families still had to pay monthly schooling fees so that their children would attend primary schools even
when municipal authorities were subsidising the school. However, as shown in [Montalbo, 2019], the fees were lower within public school funded by municipalities compared to private schools. As part of the teachers’ salary was provided by the municipality, these teachers could rely less on schooling fees to obtain a decent remuneration.
43On this point, one could try to run a separate regression for each census year. This would amount to
selecting municipalities without school in 1836, exceeding the Guizot threshold in 1841 or 1856 for example, and comparing their future level of economic resources to the one of municipalities still under the 500-inhabitant threshold. However, this would critically lower the number of observations. Indeed, only 53 municipalities would be considered as treated in 1841 for example, 30 in 1846, 50 in 1851. Moreover, this would introduce more approximations in the estimation as I cannot observe if a municipality opened a school or not after 1833, which they could have done even if they were not forced to legally. Therefore, running these estimations would be problematic. Within the basic estimation framework, I can at leat be sure that a municipality around the population threshold had or not a primary school in 1833.
estimated. This is coherent with the fact that some municipalities exceeding the 500-inhabitant threshold between 1833 and 1881 might have biased downward the effect of the schooling supply shock. The estimated growth impact of the education shock is therefore robust to these four population restrictions.
4.3
Timing and Scope of the Effect
The effect of education on economic resources is significant both in 1881 and 1911. Since municipalities around the 500-inhabitant threshold didn’t differ significantly in 1833, this reveals a positive effect of primary schooling on the growth of municipalities between the Guizot law
on these two dates. In their analysis, Squicciarini and Voigtländer, 2015 point out a positive
effect of basic education (school rate in 1837) on the subsequent level of economic resources (disposable income in 1864 and industrial output in 1861), but not the population growth of big cities in France. This work indicates that basic human capital did influence the growth of smaller municipalities during the second part of the nineteenth century. The difference between the two findings can first come from the timing of the effect and from the size of the units of analysis.
Indeed, since primary schooling was well-developed in big cities, it was unlikely to influence their population growth. On the contrary, huge variations in basic educational achievements existed between the vast majority of French municipalities during the nineteenth century, which in turn contributed to influence their economic growth. Moreover, upper-tail knowledge may have been more important for the adoption and implementation of new technologies and techniques in the first part of the nineteenth century, while the acquisition of elementary skills was increasingly required to operate on these evolving technologies as the century went on.
In their work, Squicciarini and Voigtländer, 2015 also insist on the fact that the level of basic
skills doesn’t affect growth, it only influences the level of economic resources at a given point. They indicate that changes in basic education affect growth, in compliance with other recent
findings [de la Fuente and Doménech,2006], [Cohen and Soto,2007], [Ciccone and Papaioannou,
2009]. In this study, this is also a change in education which is measured, as the Guizot law
prompted an increase in enrolment in the municipalities at stake. Therefore, there seems
to be no major contradiction between this work and the conclusions from Squicciarini and
Voigtländer, 2015.
Even if education did influence growth in the second part of the nineteenth century, I find no effect on the growth of municipal resources between 1881 and 1911. There is no apparent strong discontinuity in the growth rate around the 500-inhabitant threshold. The estimations even return a negative effect of being just above the threshold. However, the estimates are only
slightly significant and not in all specifications45. Therefore, the human capital accumulated
within primary schools impacted the growth of municipalities mostly between 1833 and 1881.
45SeeFigure B9and Table 4in the Appendix. In the estimations, I keep as non-treated municipalities with
less than 500 inhabitants until 1881, that is to say the most restrictive specification. Keeping all municipalities wouldn’t change the outcomes.
Table 4: Nonparametric regression discontinuity estimates -Growth of municipal resources per capita
Growth of municipal resources, 1881-1911
(1) (2) (3) (4)
RD Estimate -35.22 -44.10∗ -43.82∗ -41.51 (-1.30) (-1.67) (-1.66) (-1.57)
Controls 259 220 222 237
Treated units 239 196 196 216 Covariates No Yes Yes Yes
Left Clusters 68
Right Clusters 67
Kernel Triangular Triangular Triangular Triangular
Order Loc. Poly. 1 1 1 1
Order Bias 2 2 2 2
BW Loc. Poly. 115.9 115.9 116.8 123.9 BW Bias 213.2 213.2 212.1 215.4
t statistics in parentheses
∗ p < 0.05,∗∗ p < 0.01, ∗∗∗ p < 0.001
Source: Guizot, industrial and postal surveys. IGN data, [Motte et al., 2003] and La Situation Financière des Communes.
Notes: RD estimates on the growth of municipal resources between 1881
and 1911 are displayed. Only municipalities with less than 500 inhabitants between 1831 and 1881 and no school in 1833 are considered as non-treated in the estimations.
This is coherent with the fact municipalities began to converge in terms of education achieve-ments during the second part of the nineteenth century. The educational advantage granted by the Guizot law slowly faded away during these years. The final blow was dealt by the Ferry Laws of 1881-1882 which made attendance to primary schools between 6 and 13 years old mandatory. Therefore, it appears logical to find that the positive effect of education was concentrated before these years. If municipalities affected by the Guizot law kept a higher average level of economic resources per capita in 1911, it is only thanks to the positive impact of education until the 1880s.
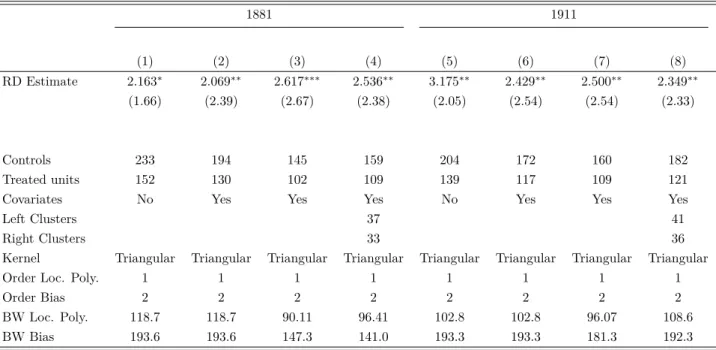
The impact of education also varied between the departments in my database, depending on their previous educational achievements. I separated departments above and below the value of 50% of the municipalities with a primary school in 1833. Around one-fourth of the depart-ments at that time were characterised by a lower presence of schools. These departdepart-ments were therefore performing quite badly on this point. I selected this threshold since around half of the municipalities in my database are located within each side. I can use it to compare the effect of