HAL Id: hal-02142638
https://hal.archives-ouvertes.fr/hal-02142638
Submitted on 28 May 2019
HAL is a multi-disciplinary open access archive for the deposit and dissemination of sci-entific research documents, whether they are pub-lished or not. The documents may come from teaching and research institutions in France or abroad, or from public or private research centers.
L’archive ouverte pluridisciplinaire HAL, est destinée au dépôt et à la diffusion de documents scientifiques de niveau recherche, publiés ou non, émanant des établissements d’enseignement et de recherche français ou étrangers, des laboratoires publics ou privés.
Diffusive gradients in thin films: devices, materials and
applications
Cai Li, Shiming Ding, Liyuan Yang, Yan Wang, Mingyi Ren, Musong Chen,
Xianfang Fan, Eric Lichtfouse
To cite this version:
Cai Li, Shiming Ding, Liyuan Yang, Yan Wang, Mingyi Ren, et al.. Diffusive gradients in thin films: devices, materials and applications. Environmental Chemistry Letters, Springer Verlag, 2019, 17 (2), pp.801-831. �10.1007/s10311-018-00839-9�. �hal-02142638�
Environmental Chemistry Letters (2019) 17:801–831 https://doi.org/10.1007/s10311-018-00839-9
REVIEW
Diffusive gradients in thin films: devices, materials and applications
Cai Li1,2 · Shiming Ding2 · Liyuan Yang1 · Yan Wang2,4 · Mingyi Ren1,2 · Musong Chen2 · Xianfang Fan2 ·Eric Lichtfouse3
Abstract
A large number of ex situ sampling techniques have been used traditionally to investigate the impact and fate of pollutants in soil, sediment and waters. However, the distribution and form of chemical species present are often altered prior analysis, due to the alterations during sampling and transfer to the laboratory. Alternatively, a robust in situ passive sampling tech-nique, diffusive gradients in thin films (DGT), has been developed for the measurement of labile concentrations, species and distribution of various solutes in soil, sediment and waters. Here we review the recent developments in DGT device configurations and components, e.g., binding agents, diffusive phases and filter membranes. We highlight new configurations for effectively reducing the measurement errors and the disturbance of environmental media. We discuss DGT applications for the analysis of soil, sediment and water, such as evaluation of bioavailability and toxicity, measurement of nutrients and organic substances, and assessment of relationships between multiple solutes. We also present the coupling of DGT with other in situ measurement techniques such as dialysis samplers (Peeper), diffusive equilibrium in thin films (DET) and planar optodes (PO).
Keywords Diffusive gradients in thin films (DGT) · Device · Passive sampling technique · Biogeochemical processes
Abbreviations
BPs Bisphenols
BPA Bisphenol A
BPF Bisphenol F
BPB Bisphenol B
DBL Diffusive boundary layer
DGT Diffusive gradients in thin films
DIFS DGT induced fluxes in sediments or soils
DET Diffusive equilibrium in thin films
HR-Peeper High-resolution Peeper
PO Planar optode
CID Computer imaging densitometry
LA-ICP-MS Laser ablation inductively coupled plasma mass spectrometry
ICP-MS Inductively coupled plasma mass
spectrometry
ICP-OES Inductively coupled plasma optical
emis-sion spectrophotometry
GFAAS Graphite flame atomic absorption
spectroscopy
Zr-oxide Zirconium oxide
SPR-IDA Suspended particulate
reagent-iminodiacetate
APA Agarose cross-linked polyacrylamide
MBL Mixed binding layer
SRP Soluble reactive phosphorus
SWI Sediment–water interface
DRP Dissolved reactive phosphorous
ROL Radial oxygen loss
1D, 2D One-dimensional, two-dimensional
EDCs Endocrine disrupting chemicals
HPCPs Household and personal care products
4-CP 4-chlorophenol PSS Poly (4-styrenesulfonate) * Shiming Ding [email protected] * Liyuan Yang [email protected]
1 School of Water Conservancy and Environment, University
of Jinan, Jinan 250022, China
2 State Key Laboratory of Lake Science and Environment,
Nanjing Institute of Geography and Limnology, Chinese Academy of Sciences, Nanjing 210008, China
3 CNRS, IRD, INRA, Coll France, CEREGE, Aix Marseille
University, 13100 Aix-en-Provence, France
4 Nanjing EasySensor Environmental Technology Co., Ltd,
PA Polyacrylate
PEI Poly (ethyleneimine)
Py-PEI Polymer-bound Schiff base
SH-CNP Thiol-modified carbon nanoparticle
Fe3O4NPs Fe3O4 nanoparticle aqueous suspensions
PQAS Polyquaternary ammonium salt
PVDF Polyvinylidene fluoride
CN Cellulose nitrate
PES Polyethersulfone
Introduction
With industrial development and urbanization, increasing levels of discharge of environmental pollutants such as heavy metals, nutrients and organics, not only result in severe envi-ronmental problems, but also pose a great risk to human health (Henner et al. 1999; Dsikowitzky and Schwarzbauer
2014; Heim and Schwarzbauer 2013; Li et al. 2017). A large number of ex situ active sampling techniques have been used to investigate the impacts and fates of compounds in soils, sediments and water, such as direct sampling, centrifuga-tion and filtracentrifuga-tion, and displacement (Henner et al. 1997; Gimbert et al. 2005; Wang et al. 2015). However, the dis-tribution and form of the chemical species present are often altered prior to analysis, due to the processes involved in sampling and transfer to the laboratory. Traditional sampling and extraction techniques give access to the total extractable analyte concentrations, which usually include some biologi-cally unavailable fractions of inert organic species and large colloids (Divis et al. 2005). However, full assessment of the potential risk of a target analyte requires analysis of the labile fraction rather than total analyte concentrations (de Paiva Magalhães et al. 2015; Divis et al. 2005; Fernandez-Gomez et al. 2011). It is crucial to understand the complex interaction of biogeochemical processes responsible for spe-ciation and distribution of analytes, as well as the resupply kinetics from solid phase to solution phase in sediments or soils (Wu and Wang 2017).
In situ passive sampling techniques are considered an ideal alternative method to these conventional sampling techniques, with many advantages including low environ-mental disturbance, having low cost and time requirements, and avoiding the need for active media transport (Chen
2015; Zarrouk et al. 2013). Diffusive gradients in thin films (DGT) is an in situ passive sampling techniques commonly used in environmental chemistry, which has been applied to the detection of elements and compounds in natural environ-ments, including water, sediment and soil. This technique uses a specially designed passive sampler that typically houses a binding layer and diffusive layer. Labile fractions, including free ions, labile complexes which can dissociate and mobile fractions released from solids, diffuse through
diffusive layer and are then rapidly and irreversibly assimi-lated by the binding layer. Therefore, a diffusive gradient is established within the diffusive layer, between the internal medium and the binding layer interface (Fig. 1) (Ernstberger et al. 2002; Sun et al. 2013). Based on Fick’s first law of dif-fusion, the time-weighted average concentration (CDGT) of
labile species during the deployment time (t) can be obtained using DGT, according to Eq. (1) (Davison and Zhang 1994):
where Δg is the diffusion layer thickness; 𝛿 is the diffusive boundary layer thickness, which calculated based on previ-ously reported methods (Davison and Zhang 2012; Galceran and Puy 2015; Scally et al. 2003); A is the exposed surface area of the DGT device; M is the accumulated mass of ana-lyte in the binding gel; D is the anaana-lyte diffusion coefficient in the diffusive layer, determined by diffusion cell or DGT time-series deployment methods (Ding et al. 2016c; Pan et al. 2015; Zhang and Davison 1999).
Furthermore, DGT induced fluxes in sediments or soils (DIFS) modeling was developed to investigate the kinetics resupply of solutes to porewater from soil/sediment sol-ids (Harper et al. 1998, 2000; Sochaczewski et al. 2007). Resupply mechanisms were described and evaluated using the resupply parameter from solid phase to solution phase R (CDGT/CSOL), the distribution coefficient between solid and porewater Kd (CS/CSOL), the solid phase adsorption rate
con-stant k1, the desorption rate constant k−1 and the response
time TC needed for the perturbed system to reach a 63%
equi-librium level. DGT and DIFS therefore pose a significant advantage as compared to traditional measurement methods, as they can reflect the mobility, bioavailability and resupply (1)
CDGT =
M(Δg + 𝛿) DAt
kinetics of solutes in environmental media (Gu et al. 2017; Naylor et al. 2006; Xu et al. 2018).
The DGT technique was developed in 1994 by William Davison and Hao Zhang with use for the determination of trace metals in water most common, during the early stages of development (Davison and Zhang 1994; Zhang and Davi-son 1995). Since then, the DGT technique has been modified and expanded to allow measurement of a significant num-ber of elements and compounds, including multiple met-als (Altier et al. 2016; Gao et al. 2009; Gimpel et al. 2003; Yabuki et al. 2014), nutrients (Cai et al. 2017; Menzies et al.
2005), organic chemicals/compounds (Chen et al. 2012a,
2013; Dong et al. 2014), radioactive elements (Drozdzak et al. 2015; Leermakers et al. 2009), oxyanions (Stockdale et al. 2008, 2010) and rare earth elements (Yuan et al. 2018). The simultaneous measurement of metals and oxyanions via DGT also provides an opportunity for analysis of the com-plex relationships between various elements (Mason et al.
2005; Panther et al. 2013; Wang et al. 2017a). Furthermore, the combination of DGT with other techniques has provided novel insight into different aspects of biogeochemical pro-cesses at high resolution, such as dialysis samplers (Peeper) (Xu et al. 2012a), diffusive equilibrium in thin films (DET) (Gao et al. 2007; Pradit et al. 2013) and planar optodes (PO) (Hoefer et al. 2017; Lehto et al. 2017). Obtaining a two-dimensional (2D) sub-mm high-resolution distribution of analytes in heterogeneous environments, such as sediments and the rhizosphere, is possible using laser ablation induc-tively coupled plasma mass spectrometry (LA-ICP-MS) (Stockdale et al. 2010; Warnken et al. 2004b) or computer imaging densitometry (CID) (Ding et al. 2013; Teasdale et al. 1999).
This study provides a comprehensive review of DGT development in recent years, including: device components, improved device configurations, and their application in soils, sediments and water. Moreover, the advantages and challenges of DGT technique are discussed.
Devices and components of diffusive
gradients in thin films
To date, two types of DGT samplers have been reported, solid binding phase devices and liquid binding phase devices, with both types having different holder configu-rations. Solid binding phase devices consist of four types, including the piston-type and dual-mode devices used for analysis of solutions and dry soils (Luo et al. 2014; Pan et al.
2015), and the traditional and new flat-type probes used for analysis of sediments and flooded soils (Ding et al. 2016b; Wu et al. 2014; Zhang et al. 2002). DGT devices typically contain a binding layer which rapidly and irreversibly accu-mulates the solute species, a diffusive gel layer which allows
solute species to pass through, a protective filter membrane which prevents adherence of particles to gels, and a front plate with a window which clips to the backing plate and holds all the layers firmly together. Recently, the improve-ments in traditional DGT device construction, as well as the developments in liquid binding phase device, have signifi-cantly expanded the potential applications.
DGT configuration
Measurement in solutions and dry soils
The piston-type device incorporates two components: the DGT piston and DGT cap (Fig. 2a). The binding gel, diffu-sive gel and filter membrane were sequentially laid together on the DGT piston and fixed by the DGT cap (exposure area: 3.14 cm2), and the surface of the filter membrane is exposed
to waters or soils during measurements. The typical piston-type device can be deployed into soils by hand pressing after the soil is moistened (Luo et al. 2010; Oporto et al. 2008; Santner et al. 2010; Zhang et al. 2004). The density of the soil, different thicknesses of soil layers, and the diffusive characteristics of target analytes may be potentially altered during pressing, which may result in measurement errors (Ding et al. 2016b).
In order to reduce the potential artificial interference for DGT measurement in soils, Ding et al. (2016b) developed the dual-mode DGT device, which has two different forms (Fig. 2b), with installation of the core on the top of the base for the measurement in water, or with the core inserted into the base to form an open cavity for measurements in soil. The deployment setup of dual-mode device differs signifi-cantly for soil measurements, as compared with piston-type device. Soil samples filled up to the open cavity with a height of 10 mm (i.e., the thickness of the soil layer is uni-fied to 10 mm) after soils have been moistened, with devices then gently shaken by hand, to ensure complete and homoge-neous contact between the DGT exposure surface and soils. The accuracy and variability of dual-mode and piston-type DGT devices were evaluated by determining the amounts of P, As, Cd and Pd with each device. Results indicated that accumulated masses established by both devices were significantly similar with correlation coefficients R2 of 0.99
or 1.00. In addition, total measurement variability decreased from 5.57% in the piston-type DGT, to 3.37% in dual-mode DGT measurements (reduced by 42%).
Measurement in sediment and flooded soils
The flat-type probe is composed of a flat base with raised bottom edge for accommodation of the binding gel, diffusive gel and filter membrane, fixed by windowed frame (expo-sure area: 27 cm2) (Fig. 3a), which is vertically deployed in
sediments or soils. Due to raised bottom edge, the typical flat-type probe can cause larger particles from the top layer of sediments to be transported down the sample profile and deeper layers during the insertion process (Santner et al.
2015). Additionally, the gap formed between the surface of flat-type probe and sediments due to raised bottom edge has been found to induce increased exchange in the overlying water (Ding et al. 2016b).
Furthermore, the flat-type probe for sediment measure-ments have been improved, with the significant differences being the removal of the raised bottom edge, as well as ensuring the window frame is flat at the front and has a beveled back (Fig. 3b). The performances of new and tradi-tional flat-type DGT were compared for S(II) measurement, combining with ZrO–AgI binding gel and CID technique, The similar S(II) distribution trends were observed with both
Fig. 2 Structure of the piston-type diffusive gradients in thin-film (DGT) device (a) and the dual-mode DGT device (b). a 1, the cap; 2, the piston and 3 their assembled form in the traditional holder sys-tem; b 1, the “O-shape” ring; 2, the recessed base of the DGT core in the new holder and 3, the hollow base (open cavity) for
accom-modation of the DGT core; 4 and 6 are the two different assembled forms of the DGT core and the open cavity for measurements in water and soil, respectively; 5 and 7 are the sectional drawing of 4 and 6, respectively (Ding et al. 2016b). Reprinted with permission from Ding et al., Copyright (2016b), The Royal Society of Chemistry
Fig. 3 Structure of the tradi-tional flat-type diffusive gradi-ents in thin-film (DGT) device (a) and the new flat-type DGT device (b): 1, the flat base; 2, the flat base and 3, their assem-bled form for the two types of probes, respectively; 4 is a cutaway view of the bottom of 3 loaded with binding gel, dif-fusive gel and a filter membrane (Ding et al. 2016b). Reprinted with permission from Ding et al., Copyright (2016b), The Royal Society of Chemistry
devices from the 2D distribution of S(II). However, the new flat-type probe without a raised bottom edge, induces much less disturbance of solid particulates and overlying water from sediment surfaces, reducing transfer into the deeper layers during deployment, as compared to the traditional design. The penetration depths of dissolved sulfide and sulfide-enriched sands in sediments have been reduced to 33% and 20% of those measured using the traditional holder. Because the seepage of oxic overlying water into the sedi-ment has been effectively inhibited using new holder, the distribution of sulfide with low concentration appeared at a much shallower depth (2.5 mm vs. 6 mm). The improved dual-mode DGT and new flat-type DGT devices have been successfully used for the measurement of various solutes in soils and sediments (Lin et al. 2017a; Xu et al. 2017; Zhang et al. 2017a).
Liquid binding phase device
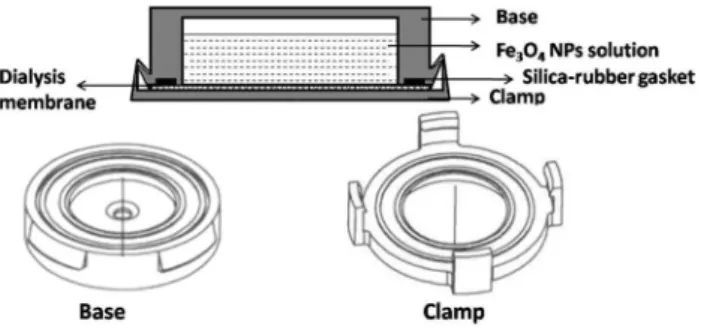
The liquid binding phase device has mainly been applied to the measurement of solutes in water and soils, with a configuration similar to piston-type devices. As shown in Fig. 4, the typical liquid binding phase device is composed of two parts: the base with a reservoir for the placement of the binding phase solution; and the cap with a 29.5-mm open window which can be clipped onto the base (Liu et al. 2016; Wu et al. 2017). In order to avoid leakage of the liquid bind-ing solution, a silica rubber spacer was fitted onto the base before the dialysis membrane was placed on the top of the spacer. As compared with solid binding phase DGT, liquid binding phase DGT provides excellent contact between the polymer solution and diffusive layer, overcoming fragility and swelling problems associated with solid gel. In addi-tion, liquid binding phase DGT require simpler analytical procedures which directly measure analyte concentrations from polymer solution without complex elution steps (Chen
et al. 2011; Fan et al. 2009b). However, the measurement using this type of DGT cannot reflect the spatial change of the analyte in environmental medium, due to that the binding agent is mobile in the binding solution.
In summary, the development of DGT configuration, including new solid and liquid binding phase devices, has expanded the application of this technique and reduced the disturbances on environmental media and induced measure-ment errors.
Binding agents
A large number of studies have suggested that labile spe-cies concentrations measured by different binding phases for same target analyte vary significantly (Ding et al. 2010b; Panther et al. 2011; Zhang et al. 2018a). Moreover, labile species concentrations are dependent on the binding strength and capability of the binding agent, providing possibility of using different DGT devices to determine the speciation and bioavailability of solutes, by choosing various suitable binding agents (Fan et al. 2013; Li et al. 2005a). To date, two different binding phases have been developed, including solid binding phases and liquid binding phases. Tables 1 and
2 summarize various solid binding agents and liquid bind-ing agents, respectively, as well as their target analytes and applied conditions.
Single solid binding agents
Single solid binding phases are prepared by impregnating single binding agents (e.g., resin) into polyacrylamide or agarose gels (Guan et al. 2017; Zhang et al. 2004; Zheng et al. 2015). In addition, some ion exchange membranes are directly used as single solid binding phases for measuring metals with DGT (Li et al. 2002, 2006).
Chelex-100 resin is the most widely used solid binding adsorbent and has been applied for the measurement of trace metals in sediments, soils and waters (Divis et al. 2007; Song et al. 2018a; Zhang et al. 1998b). The most notable advantage of Chelex-100 resin is that it can determine a large number of metals, to date, the Chelex-100 is typically used to measure cationic metals with DGT, including Fe, Mn, Cd, Co, Cu, Ni, Pb, Zn and Al (Garmo et al. 2003; Leer-makers et al. 2016; Song et al. 2018b; Turner et al. 2012; Wu et al. 2011). Other available materials have also been reported for the determination of metals, such as adsorbent suspended particulate reagent-iminodiacetate (SPR-IDA) and activated carbon (Davison et al. 1997; Lucas et al. 2012,
2014). SPR-IDA and activated carbon DGT can measure
fewer analytes than Chelex-100 but activated carbon DGT can be applied for Au and bisphenols (BPs) measurement over a wide range of pH and ionic strength conditions (Guan et al. 2017; Lucas et al. 2012; Warnken et al. 2004a). Both
Fig. 4 The construction of diffusive gradients in thin-film (DGT) devices for liquid binding phase systems, comprised of a base with reservoir, for the placement of the binding phase solution and a cap with a 29.5-mm open window which can be clipped onto the base (Liu et al. 2016). NP nanoparticles. Reprinted with permission from Liu et al., Copyright (2016), Elsevier. N
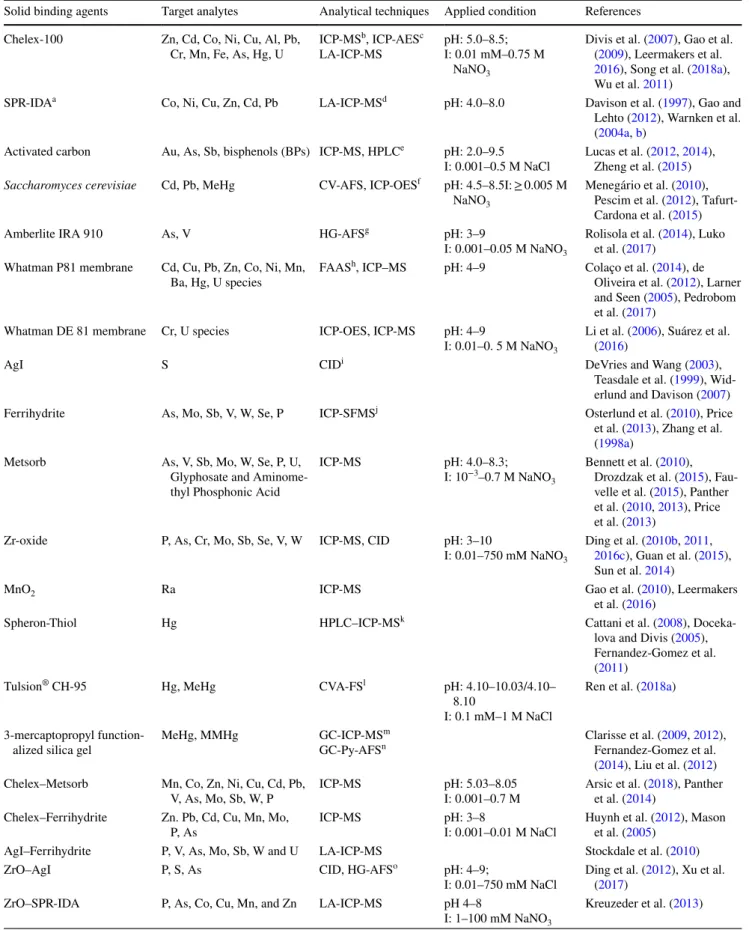
Table 1 Binding agents for preparation of solid binding phases in diffusive gradients in thin films (DGT)
Solid binding agents Target analytes Analytical techniques Applied condition References Chelex-100 Zn, Cd, Co, Ni, Cu, Al, Pb,
Cr, Mn, Fe, As, Hg, U ICP-MS
b, ICP-AESc
LA-ICP-MS pH: 5.0–8.5;I: 0.01 mM–0.75 M NaNO3
Divis et al. (2007), Gao et al. (2009), Leermakers et al.
2016), Song et al. (2018a), Wu et al. 2011)
SPR-IDAa Co, Ni, Cu, Zn, Cd, Pb LA-ICP-MSd pH: 4.0–8.0 Davison et al. (1997), Gao and
Lehto (2012), Warnken et al. (2004a, b)
Activated carbon Au, As, Sb, bisphenols (BPs) ICP-MS, HPLCe pH: 2.0–9.5
I: 0.001–0.5 M NaCl Lucas et al. (Zheng et al. (20122015, 2014) ),
Saccharomyces cerevisiae Cd, Pb, MeHg CV-AFS, ICP-OESf pH: 4.5–8.5I: ≥ 0.005 M
NaNO3
Menegário et al. (2010), Pescim et al. (2012), Tafurt-Cardona et al. (2015)
Amberlite IRA 910 As, V HG-AFSg pH: 3–9
I: 0.001–0.05 M NaNO3
Rolisola et al. (2014), Luko et al. (2017)
Whatman P81 membrane Cd, Cu, Pb, Zn, Co, Ni, Mn, Ba, Hg, U species FAAS
h, ICP–MS pH: 4–9 Colaço et al. (2014), de
Oliveira et al. (2012), Larner and Seen (2005), Pedrobom et al. (2017)
Whatman DE 81 membrane Cr, U species ICP-OES, ICP-MS pH: 4–9
I: 0.01–0. 5 M NaNO3
Li et al. (2006), Suárez et al. (2016)
AgI S CIDi DeVries and Wang (2003),
Teasdale et al. (1999), Wid-erlund and Davison (2007)
Ferrihydrite As, Mo, Sb, V, W, Se, P ICP-SFMSj Osterlund et al. (2010), Price
et al. (2013), Zhang et al. (1998a)
Metsorb As, V, Sb, Mo, W, Se, P, U, Glyphosate and Aminome-thyl Phosphonic Acid
ICP-MS pH: 4.0–8.3;
I: 10−3–0.7 M NaNO 3
Bennett et al. (2010), Drozdzak et al. (2015), Fau-velle et al. (2015), Panther et al. (2010, 2013), Price et al. (2013)
Zr-oxide P, As, Cr, Mo, Sb, Se, V, W ICP-MS, CID pH: 3–10
I: 0.01–750 mM NaNO3
Ding et al. (2010b, 2011,
2016c), Guan et al. (2015), Sun et al. 2014)
MnO2 Ra ICP-MS Gao et al. (2010), Leermakers
et al. (2016)
Spheron-Thiol Hg HPLC–ICP-MSk Cattani et al. (2008),
Doceka-lova and Divis (2005), Fernandez-Gomez et al. (2011)
Tulsion® CH-95 Hg, MeHg CVA-FSl pH: 4.10–10.03/4.10–
8.10
I: 0.1 mM–1 M NaCl
Ren et al. (2018a) 3-mercaptopropyl
function-alized silica gel MeHg, MMHg GC-ICP-MS
m
GC-Py-AFSn Clarisse et al. (Fernandez-Gomez et al. 2009, 2012),
(2014), Liu et al. (2012) Chelex–Metsorb Mn, Co, Zn, Ni, Cu, Cd, Pb,
V, As, Mo, Sb, W, P ICP-MS pH: 5.03–8.05I: 0.001–0.7 M Arsic et al. (et al. (20142018) ), Panther Chelex–Ferrihydrite Zn. Pb, Cd, Cu, Mn, Mo,
P, As ICP-MS pH: 3–8I: 0.001–0.01 M NaCl Huynh et al. (et al. (2005)2012), Mason
AgI–Ferrihydrite P, V, As, Mo, Sb, W and U LA-ICP-MS Stockdale et al. (2010)
ZrO–AgI P, S, As CID, HG-AFSo pH: 4–9;
I: 0.01–750 mM NaCl Ding et al. ((2017) 2012), Xu et al.
ZrO–SPR-IDA P, As, Co, Cu, Mn, and Zn LA-ICP-MS pH 4–8
I: 1–100 mM NaNO3
Table 1 (continued)
Solid binding agents Target analytes Analytical techniques Applied condition References ZrO–Chelex Fe, Mn, Co, Ni, Cu, Zn, Pb,
Cd, P, As, Cr, Mo, Sb, Se, V, W
CID, ICP-MS pH: 5–9
I: 1–750 or 2/3–750 mM NaNO3
Ding et al. (2016a), Wang et al. (2016, 2017a)
Micro-sized zeolite NH4+–N ICP-AES pH: 3–8
I: 0.001–10 mM NaNO3
Feng et al. (2015) Microlite PrCH cation
exchange resin NH4
+–N Automated
colorimet-ric method pH: 3.5–8.5I: ~ 0.012 M NaCl Huang et al. (2016c) Purolite A520E anion
exchange resin NO3–N Automated colorimet-ric method pH: 3.5–8.5I: 0.0001–0.008 M NaCl Huang et al. (2016a) AMI-7001 anion exchange
membrane NO3–N Automated colorimet-ric methods pH: 3.5–8.5I: 0.0001–0.014 M NaCl Huang et al. (2016d) CMI-7000 cation exchange
membranes NH4
+–N Automated
colorimet-ric methods pH: 3.5–8.5I: 0.0003–0.012 M NaCl Huang et al. (2016d)
SIR-100-HP NO3–N Flow injection
analysis pH: 3–8I: 0–0.018 M Na2SO4 Cai et al. (2017) XAD-18 resin
Antibiotics/drugs/perfluoro-alkyl substances (PFASs)/ endocrine disrupting chemicals
HPLC–UVp RRLC–
MS/MSq pH: 6–9/4–9I: 0.001–0.1 M NaCl Chen et al. (2018c), Guan et al. (2012a, 20132018, ),
Guo et al. 2017a) XDA-1 resin Antibiotics/endocrine
dis-rupting chemicals (EDCs) UPLC-MS/MS
r pH: 7–9
I: 0.5/0.4–0.8 M NaCl Xie et al. (2018a, b) Oasis® HLB or Oasis® MAX Anionic pesticides/endocrine
disrupting chemicals/polar organic contaminants
HPLC-TOFs pH: 3–8
I: 0.01–1 M NaNO3
Challis et al. (2016), Chen et al. (2018c), Guibal et al. (2017)
Bondesil® C
8 silica particles Organotin compounds PTV-LVI-GC/MSt pH: 4–9
I: 0.01–1 M, NaCl Cole et al. (2018)
Hydrophilic–lipophilic-balanced Household and personal care products (HPCPs) LC-MS/MS
u pH: 3.5–9.5
I: 0.001–0.1 M NaCl Chen et al. (2017b)
a Suspended particulate reagent-iminodiacetate (SPR-IDA) b Inductively coupled plasma mass spectrometry (ICP-MS)
c Inductively coupled plasma atomic emission spectrometry (ICP-AES) d Laser ablation inductively coupled plasma mass spectrometry (LA-ICP-MS) e High-performance liquid chromatography (HPLC)
f Inductively coupled plasma optical emission spectroscopy (ICP-OES) g Hydride generation-atomic fluorescence spectrometry (HG-AFS) h Flame atomic absorption spectroscopy (FAAS)
I Computer imaging densitometry (CID)
j Inductively coupled plasma sector-field mass spectrometry (ICP-SFMS)
k High-performance liquid chromatography inductively coupled plasma mass spectrometry (HPLC–ICP-MS) l Cold vapor atomic fluorescence spectrometry (CVA-FS)
m Gas chromatography coupled inductively coupled plasma mass spectrometry (GC-ICP-MS)
n Gas chromatography coupled to atomic fluorescence spectrometry via a pyrolytic reactor (GC-Py-AFS) o Hydride generation coupled with AFS (HG-AFS)
p High-performance liquid chromatography ultraviolet (HPLC–UV)
q Rapid resolution liquid chromatography-tandem mass spectrometry (RRLC–MS/MS) r Ultra-performance liquid chromatography-tandem mass spectrometry (UPLC-MS/MS) s High-performance liquid chromatography time-of-flight (HPLC-TOF)
t Pressure temperature vaporization-large volume injection gas chromatography-mass spectrometry (PTV-LVI-GC/MS) u Liquid chromatography-tandem mass spectrometry (LC-MS/MS)
SPR-IDA (bead size 0.2 µm) and ground Chelex-100 resin (bead size ~ 10 µm) allow obtaining high-resolution imag-ing of trace metals in sediments and soils in combination with the analysis of LA-ICP-MS (Zhou et al. 2018). Taking the expensive prices and limited binding capacity of SPR-IDA into consideration, the ground Chelex-100 resin can become a promising binding material for high-resolution 2D imaging analysis. Menegário et al. (2010) fixed baker’s yeast (Saccharomyces cerevisiae) in agarose gel to form a DGT binding phase, and the labile Cd(II) measured by this type of DGT showed excellent agreements with that of Chelex DGT. This type of DGT has been developed for measuring Pb and MeHg in seawaters and freshwaters (Pescim et al.
2012; Tafurt-Cardona et al. 2015). Rolisola et al. (2014) and Luko et al. (2017) immobilized Amberlite IRA 910 into polyacrylamide gel to form a DGT binding phase capable of measuring As(III) and V, and the DGT performance was independent of pH 5–9 and pH 3–9 for the two analytes, respectively.
In addition, several binding materials have been devel-oped for the measurement of Hg species. Spheron-Thiol res-ins were developed to determine Hg(II) and MeHg, show-ing a stronger affinity for mercury species than Chelex-100 (Docekalova and Divis 2005; Fernandez-Gomez et al. 2011). Three-mercaptopropyl functionalized silica (Clarisse et al.
2012; Fernandez-Gomez et al. 2015), the ion exchange
resin Duolite GT73 and Ambersep GT74 as well as the novel functionalized macroporous cross-linked polystyrene (Tulsion® CH-95) can measure several mercury species
(Pel-cova et al. 2014, 2015; Ren et al. 2018a). Further, we found the Tulsion® CH-95 binding agent has higher adsorption
capacity and elution efficiency for Hg(II) and MeHg than other adsorbents (Ren et al. 2018a).
The use of ion exchange membranes as DGT binding phases has advantages of excellent mechanical strength, flexibility, reuse and easy preparation, in comparison with other types of binding phases (Huang et al. 2016d; Li et al.
2002, 2005a). Li et al. (2002) utilized commercially avail-able solid cellulose phosphate membranes (Whatman P81) as DGT binding phase to determine Cu and Cd, and this type of DGT has been extended to measurement of other metals, such as Cd, Cu, Pb, Zn, Co, Ni, Mn, Ba, Hg and U species (Colaço et al. 2014; de Oliveira et al. 2012; Larner and Seen
2005; Mengistu et al. 2012; Pedrobom et al. 2017). In addi-tion, the Whatman DE 81 with amino functional groups has been applied for the measurement of U species and Cr(VI) in waters (Li et al. 2006; Pedrobom et al. 2017; Suárez et al.
2016).
Titanium dioxide-based adsorbent (Metsorb), iron oxyhy-droxide-based adsorbents (Ferrihydrite) and zirconium oxide (Zr-oxide)-based adsorbents have been employed to meas-ure anionic analytes. Metsorb DGT, Ferrihydrite DGT and
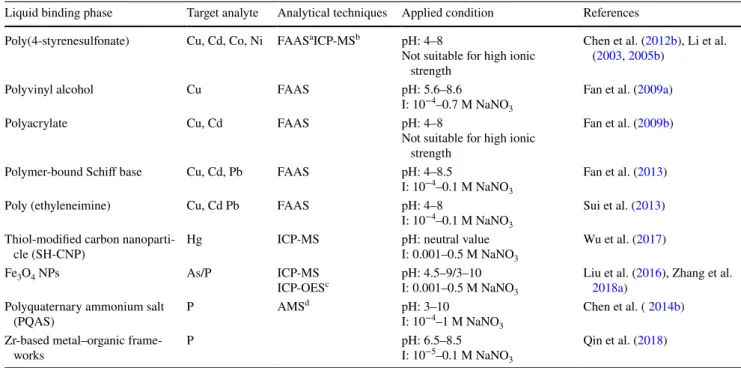
Table 2 Binding agents used for preparation of the liquid binding phase in diffusive gradients in thin films (DGT)
a Flame atomic absorption spectroscopy (FAAS)
b Inductively coupled plasma mass spectrometry (ICP-MS)
c Inductively coupled plasma optical emission spectrophotometry (ICP-OES) d Ammonium molybdate spectrophotometry (AMS)
Liquid binding phase Target analyte Analytical techniques Applied condition References Poly(4-styrenesulfonate) Cu, Cd, Co, Ni FAASaICP-MSb pH: 4–8
Not suitable for high ionic strength
Chen et al. (2012b), Li et al. (2003, 2005b)
Polyvinyl alcohol Cu FAAS pH: 5.6–8.6
I: 10−4–0.7 M NaNO 3
Fan et al. (2009a)
Polyacrylate Cu, Cd FAAS pH: 4–8
Not suitable for high ionic strength
Fan et al. (2009b)
Polymer-bound Schiff base Cu, Cd, Pb FAAS pH: 4–8.5
I: 10−4–0.1 M NaNO 3
Fan et al. (2013)
Poly (ethyleneimine) Cu, Cd Pb FAAS pH: 4–8
I: 10−4–0.1 M NaNO 3
Sui et al. (2013) Thiol-modified carbon
nanoparti-cle (SH-CNP) Hg ICP-MS pH: neutral valueI: 0.001–0.5 M NaNO3
Wu et al. (2017)
Fe3O4 NPs As/P ICP-MS
ICP-OESc pH: 4.5–9/3–10I: 0.001–0.5 M NaNO 3
Liu et al. (2016), Zhang et al.
2018a) Polyquaternary ammonium salt
(PQAS) P AMS
d pH: 3–10
I: 10−4–1 M NaNO 3
Chen et al. ( 2014b) Zr-based metal–organic
frame-works P pH: 6.5–8.5I: 10−5–0.1 M NaNO
3
Zr-oxide DGT can measure similar anionic analytes includ-ing As, Mo, Sb, V, W, Se, P in a similar range of pH (Dinclud-ing et al. 2016c; Osterlund et al. 2010; Panther et al. 2010, 2013; Zhang et al. 2017a, b). Compared with Ferrihydrite, the capacity of Metsorb DGT was higher, with superior results found when deployment times were greater than 1 day or in seawater deployment. Both Metsorb and Ferrihydrite DGTs were found to be independent of Cl− and SO
4− for
the measurement of dissolved reactive phosphorous (DRP) in water, whereas Ferrihydrite DGT was more susceptible to the effects of HCO3− (Mason et al. 2008; Panther et al.
2011). A high phosphate binding capacity was observed for Zr-oxide DGT, up to 223 µg P cm−2, which was significantly
higher than Ferrihydrite DGT (6.94 µg P cm−2), Metsorb
DGT (12.7 µg P cm−2) (Ding et al. 2010b). The capacities
of Zr-oxide DGT for oxyanions are ~ 29 to > 2397-fold that of Metasorb and approximately 7.5 to 232-fold that of Ferri-hydrite DGT in freshwater and seawater, respectively (Ding et al. 2016c). Teasdale et al. (1999) initially developed a new DGT method for 2D measurement of S(II), based on the use of AgI as DGT binding phase. S(II) reacts specifically with the pale yellow AgI to form black Ag2S substance.
There-fore, the accumulation amount of S(II) can be quantitatively related to the grayscale intensity of the gel surface measured by the computer imaging density (CID) (Robertson et al.
2008; Teasdale et al. 1999).
Recently, DGT methods have been widely developed to measure the inorganic nutrient P (Ding et al. 2010b; Price et al. 2013; Zhang et al. 1998a), while there were relatively few reports about N. Feng et al. (2015) determined NH4–N
concentrations using DGT, based on the use of a novel bind-ing material containbind-ing micro-sized zeolite in natural waters, effective between pH 3–8 and 0.001–10 mM ionic strengths. Huang et al. (2016a, c) used Purolite A520E anion exchange resin and Microlite PrCH cation exchange resin and as DGT binding agents for measurement of NO3–N and NH4–N in freshwaters, respectively, with neither A520E DGT or PrCH DGT affected in the pH range of 3.5–8.5. Huang et al. (2016d) also used AMI-7001 and CMI-7000 cation exchange membranes as binding layers for DGT measure-ments of NO3–N and NH4–N in freshwaters, respectively. They have the advantages of easy preparation, low detection limits and the use of non-toxic chemicals (i.e., acrylamide) in comparison with the uses of A520E and PrCH, enable the two DGTs more promising for measurement of N. Moreover, a novel styrene divinylbenzene-based absorbent with amine functional groups (SIR-100-HP) has been developed for the measurement of NO3–N in soils, with performance found to be effective at a pH range of 3–8 and ionic strengths of 0–0.018 M (Cai et al. 2017).
The binding agents used for the measurement of metals, oxyanions and nutrients have been considerably developed, while there is a tendency for the development of DGT in
measurement of organic compounds. XAD-18 resin is to date, the most commonly used adsorbent for measuring antibiotics and it has been developed to simultaneously several drugs and perfluoroalkyl substances (PFASs) in water and soil (Chen et al. 2014a, 2015a; Guan et al. 2018; Guo et al. 2017a). Some studies have proven that XAD-18 DGT is effective in situ tools to monitor multiple antibiot-ics and illicit drugs in the wide range of pH 4–9, with ionic strengths of 0.001–0.1 M NaCl (Chen et al. 2015b; Zhang et al. 2018b). In addition, Xie et al. (2018a, b) used the novel XAD-1 resin as a binding phase for the determination of antibiotics and endocrine disrupting chemicals (EDCs) in seawater. Compared with XAD-18 resin, the XAD-1 resin was suitable for application in high ionic strength environ-ments (0.4–0.8 M), such as seawater. Activated charcoal DGT has also been employed for the simultaneous determi-nation of bisphenols in water and soil, with performance not affected by pH within the range of 5–8, or ionic strengths between 0.001 and 0.5 M (Guan et al. 2017; Zheng et al.
2015). Ren et al. (2018b) developed a novel binding phase using porous carbon material (PCM) as binding agent for measuring 20 antibiotics in water samples, and its meas-urement was independent of pH 4.2–8.4 and ionic strength 0.001–0.5 M NaCl. Guibal et al. (2017) utilized both Oasis®
HLB and Oasis® MAX sorbent in DGT devices, to monitor
anionic pesticides in rivers, with accuracies better than 30% found under the conditions of pH 3–8 and ionic strength 0.01–1 M NaNO3. The application of hydrophilic–lipo-philic-balanced (HLB) binding agents has been reported for the measurement of household and personal care prod-ucts (HPCPs) in waters, being effective in the pH range of 3.5–9.5, and ionic strengths of 0.001–0.1 M, with dissolved organic matter levels of 0–20 mg L−1 (Chen et al. 2017b).
Chen et al. (2018c) further compared the performances of three different resins [HLB, XAD18 and Strata-XL-A (SXLA)] for measuring endocrine disrupting chemicals, showing that the measurements with HLB and XAD18 DGT were more stable than that of SXLA-DGT, with the tolerant pH range of 3.5–9.5 and ionic strength of 0.001–0.5 M. The use of DGT for measurement of organometallics have been optimized, with Cole et al. (2018) using Bondesil® C
8 silica
particles as DGT sorbents for measurement of five organotin compounds in sediment, with performances effective within a range of pH 4–9 and ionic strength of 0.01–1 M NaCl.
Hybrid solid binding agents
Both direct and indirect interactions occur between different analyte species in biogeochemical processes. Consequently, in order to further understand potential coupled relation-ships, the hybrid DGT incorporating different adsorbents in a single gel has been developed. The concentrations of Zn, Pb, Cd, Cu, Mn, Mo, P and As in water and soil, were
determined using mixed binding layer (MBL) DGT, con-sisting of Ferrihydrite and Chelex-100 (Ferrihydrite–Chelex DGT) (Huynh et al. 2012; Mason et al. 2005). The added Chelex-100 does not interfere with the absorption capac-ity of Ferrihydrite for As and P, although the coating of Ferrihydrite on to the surface of Chelex-100 can affect the capacity of Chelex-100 to absorb trace metals. In particular, Ferrihydrite–Chelex DGT cannot be used to measure Fe. The simultaneous measurement of six labile cations (Mn, Co, Ni, Cu, Cd, and Pb) and six oxyanions (V, As, Mo, Sb, W, and P) was performed using Metsorb–Chelex DGT both in freshwater and seawater (Arsic et al. 2018; Panther et al.
2014). Both the diffusion coefficients and the measure-ment concentrations of cations and oxyanions agreed well with Metsorb–Chelex DGT, compared with Metsorb DGT and Chelex DGT, respectively. Both the number of analyte species measured and the accuracy were higher with Met-sorb–Chelex DGT than Ferrihydrite–Chelex DGT.
In addition, AgI–Ferrihydrite DGT (for simultaneous measurement of S and oxyanion), and ZrO–AgI (for As, S and P measurement) have been developed in combina-tion with some high-resolucombina-tion analyte techniques, such as computer imaging densitometry (CID) (Ding et al. 2012; Stockdale et al. 2008, 2010; Xu et al. 2017). ZrO–SPR-IDA DGT was developed for 2D imaging of P, As, Co, Cu, Mn, and Zn distributions in combination with LA-ICP-MS, by embedding Zr-oxide and SPR-IDA into an ether-based ure-thane polymer hydrogel (Kreuzeder et al. 2013). Further-more, Wang et al. (2016, 2017a) obtained the concentrations and distributions for eight cations (Fe, Mn, Co, Ni, Cu, Zn, Pb, and Cd) and eight anions (P, As, Cr, Mo, Sb, Se, V, and W) in water and sediments, using ZrO–Chelex DGT. ZrO–Chelex DGT was shown to have high capacities for all analytes, and although the capacity for As was lower than Zr-oxide DGT, it still exhibits significantly better responses than other reported DGT (Sun et al. 2014).
The main disadvantage of MBL DGT is the limited bind-ing capacity, due to havbind-ing a sbind-ingle layer of mixed gel and therefore reduced amounts of adsorbents, as well as the mutual interference between different adsorbents (Huynh et al. 2012). It is to note, that adding increased concentra-tion of binding agents into mixed gels were demonstrated to be useful for elevating the binding capacity of MBL DGT (Wang et al. 2017a).
Liquid binding agents
Liquid binding phases are typically polymer solutions con-taining functional groups, with recent applications including homogeneous suspension solutions with nano-particulates, the homogeneous liquid binding phase with nano-particu-lates offers the advantages of a large surface area, rich in functional group, with high mobility (Liu et al. 2016).
The use of poly (4-styrenesulfonate) (PSS) and sodium polyacrylate (PA) as the liquid binding phase for DGT, have been developed for the measurement of Cu and Cd (Fan et al. 2009b; Li et al. 2003), but PSS DGT is not suitable for long-term deployment under high ionic strength condition (Li et al. 2003, 2005b). Several metals (Cu, Cd, Co and Ni) have also been measured simultaneously using PSS-E6 and PSS-7E4 DGTs (Chen et al. 2012b), respectively. The results showed that the use of large molecular weight PSS-E6 was more suitable than PSS-7E4 due to lower pretreatment depletion rate, and lower cost and pollution. In addition, pol-ymer-bound Schiff base (Py-PEI) and poly (ethyleneimine) (PEI) were employed as DGT liquid binding agents for the measurement of labile Cu, Cd and Pb (Fan et al. 2013; Sui et al. 2013). Py-PEI DGT has higher uptake percentages for metals than PA DGT and PSS DGT. Labile Hg species were determined using thiol-modified carbon nanoparticle (SH-CNP) suspensions as the DGT liquid binding agent, with performance effective in ionic strength of independ-ence of 0.001–0.5 M NaNO3, as well as other interfering ionic Cd, Cr, Cu and Pb (Wu et al. 2017). In addition, Fe3O4 nanoparticle aqueous suspensions (Fe3O4NPs) have been
applied as liquid binding phases in DGT measurement of DRP concentrations and As species (Liu et al. 2016; Zhang et al. 2018a). Furthermore, polyquaternary ammonium salt (PQAS) aqueous solutions have also been applied as the liquid binding phase in DGT systems, to monitor the concen-tration of DRP in water, with effective performance within pH range of 3–10 and at ionic strengths of 10−4–1 M (Chen
et al. 2014b). Qin et al. (2018) used Zr-based metal–organic frameworks (MOFs, UiO-66) as liquid binding agent for DGT measurement of P (UiO-66 DGT), and good agree-ments were obtained between the concentrations measured by DGT and in waters (CDGT/Csol: 0.9–1.1). The capacities
of different DGTs in measurement of P are in the order of Zr-oxide DGT (223 µg P cm−2) > UiO-66 DGT (20.8 μg P
cm−2) > Fe
3O4NPs DGT (15.4 μg P cm−2) > Metsorb DGT
(12.7 μg P cm−2) > PQAS DGT (9.9 μg P cm−2) >
Ferrihy-drite DGT (6.94 µg P cm−2) (Qin et al. 2018; Zhang et al.
2018a).
In summary, a large number of binding agents have been developed, and their uses have made DGT to be a commonly used sampling technique for measurement of a wide range of analytes.
Diffusive phase
A series of materials have been applied as the diffusive gel in DGT (Table 3), including agarose cross-linked poly-acrylamide (APA) gel (Shiva et al. 2017; Zhang and Davi-son 1995), agarose gel (Colaço et al. 2012; Docekalova and Divis 2005; Wang et al. 2016), dialysis membranes (Li et al. 2003), nylon membranes (Panther et al. 2008) and
paper-based diffusion layer, such as 3MM chromatographic paper (de Almeida et al. 2012; de Oliveira et al. 2012) as well as chromatography paper grade 1 Chr and 17 Chr (Larner and Seen 2005).
APA gel is the most widely used diffusive layer and has been employed for the measurement of various cations and anions, with advantage of retaining stability in the range of pH 2–9 after hydrogel (Osterlund et al. 2010; Wu et al.
2014). Nevertheless, some studies have shown that the inter-actions between APA gel functional groups and target ana-lytes, can result in inaccurate measurements, such as with Hg (Divis et al. 2005; Pelcova et al. 2015; Tafurt-Cardona et al. 2015), Cu (Garmo et al. 2008b), NH4+ (Huang et al.
2016c), and some organics (Guan et al. 2017). APA gel pos-sesses positive charge, therefore electrostatic interactions can interfere with metal diffusion at low ionic strengths according to the Donnan potential (Warnken et al. 2005). In addition, APA gel has relatively poor mechanical resistance, poor reproducibility and sophisticated preparation processes (Fan et al. 2013). An alternative diffusive material agarose gel, had been applied for the measurement of almost all DGT
analytes, such as various cations, anions, organic pollutants, Hg and NH4+, as well as many analytes which cannot be
measured with APA gel (Chen et al. 2012a; Divis et al. 2005; Huang et al. 2016d; Tafurt-Cardona et al. 2015; Wang et al.
2016); and Table 4 summarizes some reported diffusion coefficients of these species in agarose gel. The main bind-ing sites on agarose gel are negative charges, which have attractive and repulsive interactions with cations and ani-ons, respectively. Compared with the APA gel, the agarose gel (typically containing 1.5% agarose) is more stable in gel thickness, showing no swelling on hydration (APA gel showed 3.2-fold swelling) (> 99%) (Wang et al. 2016). It was also found that the thickness of agarose gel remained stable after hydration and storage under 4–40 °C, 0–1.0 M ionic strength, and 2–11 pH conditions, with the storage time extending to 300 days.
The reported diffusion coefficients for cations and anions in APA gel and agarose gel determined by diffusion cells (Dcell) and DGT time-series deployment methods (DDGT),
respectively, are presented in Table 5. The results indicated a considerable variation of the diffusion coefficients in APA
Table 3 Types and characteristics of diffusive gels used in diffusive gradients in thin films (DGT)
Diffusive gel Pore size Thickness Moisture content Analytes References
APA gel > 5 nm Typically 0.8 mm > 95% Oxyanions (including PO3− 4 ),
trace metals except of Hg and NH4+, and organic
pol-lutants
Chen et al. (2011), Wang et al. (2016), Zhang and Davison (1999)
Agarose gel > 20 nm Typically 0.8 mm > 99% Various cations and anions, organic pollutants, Hg, NH4+, and the analytes
capable and incapable of measurements with the APA gel
Divis et al. (2005), Wang et al. (2016)
Dialysis membrane < 5 nm 50–85 μm – Cu, Cd, Co, Ni and As Chen et al. (2012b), Li et al. (2003, 2005b)
Nylon membrane 0.22 μm 0.18 mm – 4-chlorophenol (4-CP) Dong et al. (2014)
3MM chromatography paper 0.46 mm Various cations de Almeida et al. (2012), de
Oliveira et al. (2012)
Table 4 Some reported diffusion coefficients for Hg species, NH4–N and some
organic species in agarose gel (D ± standard deviations; × 10−6
cm2 s−1, 25 °C)
Element D References
Hg 9.07 ± 0.23/7.65 ± 0.60 Pelcova et al. (2014), Ren et al. (2018a) MeHg 9.06 ± 0.30/9.94 ± 0.49 Pelcova et al. (2014), Ren et al. (2018a)
NH4–N 15.2/17.1 Feng et al. (2015), Huang et al. (2016c)
BPA/BPB/BPF 5.03/2.64/4.44 Zheng et al. (2015)
HPCPs 3.36–7.30 Chen et al. (2017b)
Anionic pesticides 2.7–4.6 (22 °C) Guibal et al. (2017) 17β-estradiol (E2) 4.65 ± 0.37 Guo et al. (2017b) Methcathinone/ephedrine 7.60/6.62 Zhang et al. (2018b) Ketamine/methamphetamine/
gel for the same analytes, even that the detection was per-formed in similar measurement conditions, using the same methods or by the same persons. Except for Cu, the errors (RSD%) of all other elements exceed 5%, and the errors of 8 elements even exceed 10%. These different reports have caused confusion to the users in calculation of DGT con-centration and the difficulty in comparing the measuring results in different studies. The errors should be caused by differences in raw materials and production batches in prepa-ration of the diffusion gel and binding gel. The diffusion coefficients measured by diffusion cells and DGT time-series deployment methods are also different, and the DDGT are slightly higher than Dcell (Table 5). The reason is likely the
presence of a diffusive boundary layer on each side of the diffusion gel in diffusion cell, even under fast stirring rate condition (Shiva et al. 2015). The measurement conditions of DGT time-series deployment method are closer to that of DGT deployment, compared to diffusion cell method. In addition, the diffusion coefficients for analytes in agarose gel are higher than that in APA gel, possibly due to the larger
pore size of agarose gel (> 20 nm) than APA gel (> 5 nm) (Zhang and Davison 1995).
Dialysis membranes and nylon membranes have widely been employed in liquid binding phase DGT for the meas-urement of heavy metals. No strong interactions exist between metals and dialysis membranes; therefore dialysis membranes do not concentrate Cd and Cu ions from solu-tions in a wide range of ionic concentrasolu-tions (Li et al. 2003). Moreover, the diffusive boundary layer is not significant when using dialysis membranes as compared with APA hydrogel or agarose gel, even in poorly mixed waters. The nylon membrane presents excellent mechanical strength and flexibility and has been developed to determine 4-chlorophe-nol (4-CP) concentration; due to it is inertness with organic compounds (Dong et al. 2014).
In addition, ultra-thin diffusion layer has been applied for DGT measurements, such as the use of a 0.01-mm
Nucle-pore membrane or a 0.1-mm DuraNucle-pore® PVDF membrane
(Ding et al. 2016a; Lehto et al. 2012). It is of note that the measured CDGT level was significantly lower than the
pore water concentration when using a thin diffusion layer
Table 5 Diffusion coefficients for some elements in agarose cross-linked polyacrylamide (APA) gel and agarose gel (1.5%) determined using diffusion cells Dcell and
diffusive gradients in thin-film (DGT) time-series deployment methods DDGT, respectively (D ± standard deviations; × 10−6 cm2 s−1, 25 °C) a Conditions: 0.01 M NaNO 3, pH 4.01(Panther et al. 2014) b 0.01 M NaNO 3, pH 4.00 (Shiva et al. 2015) c 0.01 M NaNO 3, pH 7.1 (Panther et al. 2013) d 0.01 M NaNO 3, pH 6.4 (Osterlund et al. 2010) e 0.01 M NaNO
3/0.004 M Mg(NO3)2, pH 6.06, using Chelex–Metsorb DGT (Panther et al. 2014) f 0.01 M NaNO
3/0.004 M Mg(NO3)2, pH 6.06, using Chelex DGT for anions and Metsorb DGT for cations g 0.01 M NaNO
3/0.004 M Mg(NO3)2, pH 4.01, using Chelex–Metsorb DGT (Shiva et al. 2015) h pH = 5.90, using Chelex DGT (Garmo et al. 2003)
i 0.01 M NaNO
3, pH 7.1; using Metsorb DGT (Panther et al. 2013) j 0.01 M NaNO
3, pH 6.2, using ferrihydrite DGT (Osterlund et al. 2010) k Obtained from DGT Research Ltd.
l Relative standard error (RSD%) of the diffusion coefficients in APA gel using the data of a–k, with the
error > 10% marked in bold
m The analyte diffusion coefficients in agarose gel 0.01 M NaNO
3, pH 5.50 for cations, Ph 6 for anions,
using ZrO–Chelex DGT, obtained from EasySensor Ltd.
Analyte Agarose cross-linked polyacrylamide gel Agarose gel
Da
cell Dbcell Dccell Ddcell DeDGT DfDGT DgDGT DhDGT DiDGT DjDGT Dk RSDl (%) Dm
As 5.26 5.36 5.54 5.21 6.02 8.13 5.96 6.78 5.54 6.09 14.9 6.38 Mo 5.18 5.58 6.28 5.96 6.33 6.43 7.24 6.81 5.70 5.94 9.9 6.53 Sb 4.90 5.50 6.04 5.55 6.22 6.16 6.74 6.86 5.25 6.23 10.7 6.59 V 3.75 3.88 7.14 6.72 7.98 8.13 8.92 8.02 6.69 5.85 26.3 5.91 W 6.22 4.28 6.89 5.45 6.88 7.06 6.50 6.26 5.82 5.77 13.7 6.54 Cd 5.52 5.36 5.56 5.72 5.56 5.50 8.03 16.1 8.41 Co 5.17 5.03 5.29 5.38 5.88 5.80 6.08 7.2 6.89 Cu 5.75 5.27 5.61 5.47 5.34 5.50 5.50 2.9 6.56 Mn 4.88 4.95 4.68 4.44 5.11 6.40 6.00 13.8 6.90 Ni 5.21 5.13 5.13 5.29 5.65 6.00 5.50 6.0 6.69 Pb 7.75 6.80 8.03 8.17 7.70 9.40 6.70 11.7 8.64 Zn 5.47 5.39 6.22 6.37 5.78 4.60 5.50 10.5 7.47
(10–100 µm thicknesses). Therefore, to avoid erroneous date-interpretation, DGT-measured result should be inter-preted as the time-averaged flux FDGT (Teasdale et al. 1999;
Widerlund et al. 2012):
Compared with the conventional 0.80 mm thickness APA gel and agarose diffusive gel, ultra-thin diffusion layers can reduce the diffusion distance, diffusion time and vertical diffusion of analytes in diffusive layer. Therefore, they are suitable for investigating the distribution of mobile chemi-cal species in soils and sediments at extremely high spatial resolutions.
In summary, the considerable variation in diffusion coef-ficients in APA gel is worthy of concern. The uses of agarose gel and ultra-thin membrane have improved the performance of DGT in expanding the range of analytes and increasing the spatial resolution. Particularly, the agarose gel can be used as a promising standard diffusive layer in DGT meas-urements of various inorganic and organic analytes.
Filter membrane
Filter membranes (usually 0.45 μm pore sizes) have been applied as protective layer, preventing some large particles from contaminating or damaging diffusive gels outer sur-face. Polyvinylidene fluoride (PVDF) membranes, cellulose nitrate membranes (CN), cellulose acetate membrane and hydrophilic polyethersulfone filter membranes (PES) are commonly used as DGT filter membrane (Desaulty et al.
2017; Kalkhajeh et al. 2018; Rolisola et al. 2014; Wang et al.
2016; Yabuki et al. 2014). Scally et al. (2006) reported the diffusion coefficients obtained by diffusion gels plus filter membranes were higher than those determined by the diffu-sion gel alone. Wang et al. (2016) further demonstrated that different filter membranes had a significant effect on the dif-fusion rates of anions and cations, showing the ranked order of diffusion rates to be: agarose < agarose plus PVDF < aga-rose plus PES < agaaga-rose plus CN. Compared the agaaga-rose gel, the larger pore size of filter membrane may be a reason for the increased diffusion rates. Some studies have indicated that different filter membranes have different affinities for solutes; and therefore, different filter membranes could result in alteration of diffusion coefficients (Garmo et al. 2008a, b; Weltje et al. 2003). In addition, the filter membrane thick-ness can also affect diffusion coefficients, while this aspect is rarely considered in DGT research.
A long deployment time is typically required for DGT deployment when measuring trace metals and other ana-lytes with low concentrations in natural waters. However, the biofilm attachment on the surface of filter membrane after long deployment time could alter the diffusional properties (2)
FDGT=
M At
of the DGT device (Li et al. 2005a). To overcome this prob-lem, Pichette et al. (2007) utilized antibiotics, copper and silver to pretreat the filter membrane, respectively. The results showed that copper and silver could prevent algal colonization within 14 days after DGT deployment. Pichette et al. (2009) also suggested an optimized deployment time of 4 days, since good measurement results and reduced bio-film effects were obtained. Other treatment methods have been applied, including the uses of additional polycarbonate membrane on the surface of DGT devices to limit biofilm growth (Uher et al. 2012), corrected diffusion coefficient to revise the DGT measurement (Feng et al. 2016). For the liquid binding phase, the dialysis membrane can be replaced by a fresh membrane regularly, which can reduce the bio-fouling effects without disturbing the liquid binding phase (Li et al. 2005a).
DGT deployment and sample analysis
In general, DGT measurement needs to undergo four set-ups, including diffusive and binding gels preparation, DGT assembly and storage, DGT deployment and retrieval, and sample analysis and date treatment. For assembly of the DGT device, the binding gel is placed on DGT base bot-tom, which is covered in order by a diffusion gel and a filter membrane and fixed in the DGT holder. The DGT device is generally sealed in a clean plastic bag contains a small volume of 0.01 M NaCl/NaNO3 solution, to keep a humid and ionic strength condition. Prior to deployment in anoxic soils and sediments, the loaded DGT device must be put into certain concentration of NaCl/NaNO3 solution, with
nitro-gen gas filled into the solution for at least 16 h to remove the oxygen in the probe. This avoids oxygenation of the sedi-ments or soils and the changes in the lability of solutes dur-ing deployment.
DGT deployment in sediments
The flat-type probe is usually deployed in flooded soils and sediments (Fig. 3). In laboratory, the flat-type probe can be inserted vertically and slowly into the sediment in a core or other containers by hands, with 2–4 cm length left in the overlying water (the probe has a totally 15 cm effec-tive length). When applying in the field, some researchers have inserted the flat-type probes into sediments by diver or lander (Brodersen et al. 2017). The lander has relatively big volume and needs additional equipment (camera) to iden-tify the sediment–water interface (SWI). Ding et al. (2015) developed a man-pack, small volume releasing device. The probe can be inserted into the sediment vertically utilizing the gravity of releasing device. After that, the device can be retrieved from the water column, leaving the DGT probe in the sediment. The releasing device can be applied in shallow
water bodies (< 10 m depth of water). Ding et al. (2015) fur-ther developed a new method to identify the sediment–water interface after retrieval of the DGT probe. The back of the flat-type probe is attached by a sheet of sponge. There are numerous small holes on the surface of the sponge where the sediment particles will be squeezed in when inserting the probe, giving a clear mark of the sediment–water inter-face position on the sponge. Meanwhile, a sheet of plastic membrane is fixed on the top of the device prior to deploy-ment. Once the probe is pulled out from the sediment, the plastic membrane will immediately cover both the front and back sides of the probe. This measure can preserve the sedi-ment–water interface mark from water flow impact during pulling out the probe. The deployment of flat-type DGT and sample analysis is summarized in Fig. 5.
DGT deployment in soils
Dryland soil must be moisturized prior to DGT deployment, but the water content has not been standardized in the litera-ture (Kalkhajeh et al. 2018; Luo et al. 2014). Some research-ers adjusted the water content at a high level (over 90% of the maximum water holding capacity) (Guan et al. 2016; Gao et al. 2017; Kalkhajeh et al. 2018; Zhang et al. 2004). This may result in anoxic condition in soils and cause the bias of the measurement from the field. Other researchers adjusted the water content to around 70% of the maximum water holding capacity (Zhang et al. 2017a). This content approaches the level in the field dryland soils, while the deployment operation can be preceded smoothly under most cases. The water content can be increased step-by-step on
Fig. 5 Operational procedures for in situ deployment of the flat-type diffusive gradients in thin-film (DGT) device in sedi-ment and treatsedi-ment for analysis
Flat-type DGT deployment and treatment
In laboratory In filed
Inserting deoxygenated DGT device in sediment
Retaining DGT device 2-4cm in laying water
Fixing deoxygenated DGT in a releasing device, attaching rope to DGT and releasing
device
The DGT is inserted into the sediment under the gravity of releasing device Then, the releasing device is slowly taken out using the rope, DGT device remains in
sediment.
Marking the DGT location, deploying 24h, and recording water temperature and water
depth Deploying 24h and recording water
temperature.
Retrieving DGT probe, marking the sediment-water interface, cleaning the exposed surface, and taking out the binding gel
Cutting the binding gel into 1-5mm×20mm slice, transferring each segment into centrifuge vial to elute
Transferring the eluent into sample bottles and dilute to certain volume for analysis
Measuring analytes by ICP-MS, ICP-OES or GFAAS, and calculating the concentrations and fluxes of analytes
a 5% interval if it is difficult to operate the deployment for some types of soils containing high content of organic mat-ter or calcite. Adjustment of the wamat-ter content is tradition-ally made using a glass rod by hands. It is tedious if a large number of samples are treated. Another good method is that using an electric non-metallic stirrer to mix the soil sam-ple after addition of deionized water (www.easys ensor .net). This method can significantly save in labor, while the mixing efficiency can be greatly improved comparing to the use by hands. After adjustment of the water content, the soil sample is incubated at a certain temperature for 48 h for sufficiently moist prior to DGT deployment. For flooded soils, the DGT device can be directly deployed with the soils without adjustment of the water content. They can also be dried after sample collection and treated according to the procedure of dryland soil. It is of note, that air drying of flooded soil should be avoided prior to DGT deployment because that the properties of the soil may be changed (Zhang et al. 2017a).
The deployment procedure is different between using the piston-type and cavity-type (dual-mode) DGT device. For the use of piston-type DGT device, the device is deployed into wetted soil sample by hand pressing,a good contact should be ensured between the filter membrane and soil sample. For the use of cavity-type DGT device, the wet-ted soil sample is filled up to the open cavity of the device directly, and the device is gently shaken to ensure good contact between the filter membrane and soil sample. Then, DGT device is transferred to semi-closed zip lock bag pre-filled with a small amount of deionized water for 24 h. The deployment of DGT and sample analysis in soil is summa-rized in Fig. 6.
DGT deployment in waters
The piston-type DGT device can be deployed in freshwa-ter, seawafreshwa-ter, and wastewaters for obtaining time-averaged concentrations of solutes, including organic chemicals/ compounds, nutrients and multiple cations and anions (Guo et al. 2017a, b; Huang et al. 2016c; Wang et al. 2016; Xie et al. 2018a). The piston-type DGT device has been in situ deployed in water by several ways. The DGT devices can be attached to a buoy with fishing line (Pichette et al. 2007); multiple devices can be fixed into a polyhedral structure (the device exposure windows outward) (Guo et al. 2017a; Zheng et al. 2015); the devices can be fixed on plastic mesh strips or in the middle of two plexiglass plate (Lucas et al. 2014; Uher et al. 2017).
Many studies used a constant thickness diffusion layer to directly measure the time-averaged concentrations of sol-utes in water (Gimpel et al. 2003; Zheng et al. 2015). How-ever, a thin solution layer is adjacent on the surface of DGT device to form a diffusive boundary layer when the device is deployed in water, which can affect the solute diffusive
rate (Warnken et al. 2006; Zhang et al. 1998a). The diffusive boundary layer thickness (δ) in water can be calculated by simultaneously using various thicknesses of diffusive gel layer (Garmo et al. 2006; Scally et al. 2006; Zhang et al.
1998a):
where ∆g is the thickness of diffusive layer; CDGT is the
solute concentration measured by DGT; A is the exposed surface area of the DGT device; M is the accumulated mass of analyte in the binding gel; D is the analyte diffusion coef-ficient in the diffusive layer; t is the deployment time.
Davison and Zhang (2012) have reviewed that the thick-ness of diffusive boundary layer is typically ~ 0.2 mm in well-stirred solutions, and varies from 0.26 mm in fast-flowing waters, 0.31 mm in lake epilimnion, to 0.39 mm in stagnant pond. Huang et al. (2016b) recently found that the thickness of diffusive boundary layer in some pond and wetland sites are approximately 100% of the standard DGT diffusive layer thickness (Δg = 0.09 cm). Therefore, a sub-stantial error will be introduced in DGT concentration cal-culation if ignoring the diffusive boundary layer thickness.
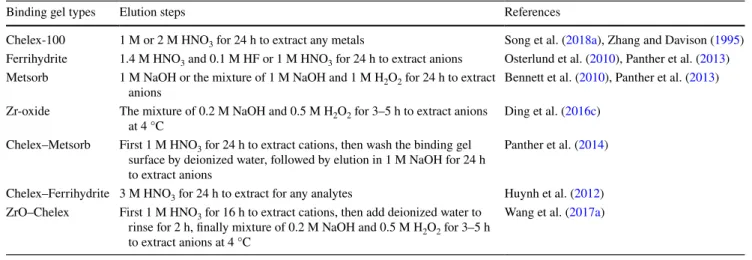
Analysis of DGT sample
The DGT samples from the use of liquid binding phases can be determined directly without elution step. In comparison, the sample analysis from the use of solid binding phases generally requires an elution step. The elution agencies vary with the types of binding gels. The elution steps of common used binding gels are summarized in Table 6.
For sample analysis, the eluent containing target analytes can be determined by multiple analysis methods, such as inductively coupled plasma mass spectrometry (ICP-MS), inductively coupled plasma optical emission spectrophotom-etry (ICP-OES) or graphite flame atomic absorption spec-troscopy (GFAAS). For the measurements in sediments and flooded soils, the 1D solute profile distributions with the use of flat-type DGT probes can be obtained by section-elution-analysis procedure. Several cutting tools have been applied for the section of the binding gel, including Teflon coated razor blade (Zhang et al. 2002), Plexiglass gel cut-ter (Gao et al. 2006) and multi-bladed ceramic cutter (Ding et al. 2015). Compared with other cutting tools, the use of multi-bladed ceramic cutter not only greatly increases the sample treatment efficiency, but also avoids the risk of metal contamination during the cutting. Furthermore, the spatial resolution of the cutting can be varied from 1.0 mm to 5.0 mm through adjusting the interval between the adja-cent single ceramic blades.
(3) 1 M = Δg DCDGTAt + 𝛿 DCDGTAt
In addition, some high-resolution techniques have been developed to obtain 2D solute distributions at sub-mm resolution, including 2D slicing-elution-microcolorimetric method for the determination of P (Ding et al. 2011, 2012), the staining technique coupled with computer imaging den-sitometry (CID) for the measurement of S(II), P and Cr(VI) (Ding et al. 2013; Teasdale et al. 1999; Yao et al. 2016), as well as laser ablation inductively coupled plasma mass spectrometry (LA-ICP-MS) for the determination of cations and anions (Kreuzeder et al. 2013; Stockdale et al. 2010; Warnken et al. 2004b). The CID technique is established
based on a relationship between the solute accumulation mass and the grayscale intensity, which simplifies the analy-sis procedures, improves the analyanaly-sis efficiency and spatial resolution compared with traditional section-elution-analysis method. In comparison, the LA-ICP-MS requires a sophis-ticated instrument, complex analytical and expensive cost.
Fig. 6 Operational procedures for piston-type and dual-mode diffusive gradients in thin-film (DGT) deployment and treat-ment
The soil is wetted to certain maximum water holding capacity, incubated 48h; then raised the capacity, incubated 48h Deoxygenated DGT device is carefully
placed on soil surface by hand
Deploying DGT device for 24h under constant temperature
The soil is wetted to 70% maximum water holding capacity, incubated 48h Adding moistened soil to open cavity,
gently shaken to ensure good contact between filter membrane and soil
Transferring DGT device to semi-closed zip lock bag pre-filled with
a small amount of deionized water Deploying DGT device for 24h under
constant temperature DGT deployment and treatment
Removing the soil, cleaning the DGT device with deionized water, and
taking out the binding gel Retrieving DGT device, cleaning
device surface with deionized water, and taking out the binding gel
Transferring the binding gel into centrifuge vial, and adding eluent to elute the analytes
Transferring the eluent into sample bottles and rinsing the centrifuge vial for analysis
Piston-type DGT
Ensuring good contact between filter membrane and soil
Measuring analytes by ICP-MS, ICP-OES or GFAAS, calculating the concentrations and fluxes of analytes