HAL Id: hal-00297569
https://hal.archives-ouvertes.fr/hal-00297569
Submitted on 4 Aug 2006
HAL is a multi-disciplinary open access
archive for the deposit and dissemination of
sci-entific research documents, whether they are
pub-lished or not. The documents may come from
teaching and research institutions in France or
abroad, or from public or private research centers.
L’archive ouverte pluridisciplinaire HAL, est
destinée au dépôt et à la diffusion de documents
scientifiques de niveau recherche, publiés ou non,
émanant des établissements d’enseignement et de
recherche français ou étrangers, des laboratoires
publics ou privés.
The relationship between NH3 emissions from a poultry
farm and soil NO and N2O fluxes from a downwind
forest
U. Skiba, J. Dick, R. Storeton-West, S. Lopez-Fernandez, C. Woods, S. Tang,
N. Vandijk
To cite this version:
U. Skiba, J. Dick, R. Storeton-West, S. Lopez-Fernandez, C. Woods, et al.. The relationship between
NH3 emissions from a poultry farm and soil NO and N2O fluxes from a downwind forest.
Biogeo-sciences, European Geosciences Union, 2006, 3 (3), pp.375-382. �hal-00297569�
Biogeosciences, 3, 375–382, 2006 www.biogeosciences.net/3/375/2006/ © Author(s) 2006. This work is licensed under a Creative Commons License.
Biogeosciences
The relationship between NH
3
emissions from a poultry farm and
soil NO and N
2
O fluxes from a downwind forest
U. Skiba1, J. Dick1, R. Storeton-West1, S. Lopez-Fernandez2, C. Woods3, S. Tang1, and N. vanDijk1
1Centre for Ecology and Hydrology (CEH) Edinburgh, Bush Estate, Penicuik, Midlothian EH26 0QB, UK
2Dpto. Qu´ımica y An´alisis Agr´ıcola – E.T.S.I. Agr´onomos de Madrid, Ciudad Universitaria s/n, 28040 Madrid, Spain 3CEH Lancaster, Lancaster Environment Centre, Library Avenue, Bailrigg, Lancaster LAI1 4AP, UK
Received: 6 July 2005 – Published in Biogeosciences Discuss.: 10 August 2005 Revised: 19 January 2006 – Accepted: 18 June 2006 – Published: 4 August 2006
Abstract. Intensive livestock farms emit large
concentra-tions of NH3, most of which is deposited very close to the
source. The presence of trees enhances the deposition. Rates to downwind forests can exceed 40 kg N ha−1 y−1. The steep gradient in large NH3 concentrations of 34.3±20.4,
47.6±24.9, 21.7±16.8 µg NH3 m3 at the edge of a forest
15, 30 and 45 m downwind of the farm to near background concentrations within 270 m downwind (1.15±0.7 µg NH3
m3)provides an ideal site to study the effect of different rates of atmospheric NH3concentrations and inferred deposition
on biological and chemical processes under similar environ-mental conditions. We have investigated the effect of dif-ferent NH3 concentrations and implied deposition rates on
the flux of NO and N2O from soil in a mixed woodland
downwind of a large poultry farm (160 000 birds) in Scot-land, which has been operating for about 40 years. Measure-ments were carried out for a 6 month period, with hourly NO flux measurements, daily N2O fluxes close to the farm
and monthly at all sites, and monthly cumulative wet and dry N deposition. The increased NH3and NH+4 deposition
to the woodland increased emissions of NO and N2O and
soil available NH+4 and NO−3 concentrations. Average NO and N2O fluxes measured 15, 25 and 45 m downwind of the
farm were 111.2±41.1, 123.3±40.7, 38.3±28.8 µg NO-N m−2h−1and 9.9±7.5, 34.3±33.3 and 21.2±6.1 µg N2O-N
m−2h−1, respectively. At the background site 270 m down-wind the N2O flux was reduced to 1.75±2.1 µg N2O-N m−2
h−1. NO emissions were significantly influenced by sea-sonal and daily changes in soil temperature and followed a diurnal pattern with maximum emissions approximately 3 h after noon. For N2O no consistent diurnal pattern was
ob-served. Changes in soil moisture content had a less clear effect on the NO and N2O flux. In spite of the large NO and
N2O emissions accounting for >3% of the N deposited to the
Correspondence to: U. Skiba
(ums@ceh.ac.uk)
woodland downwind of the farm, extrapolation to the entire British poultry flock suggests that these NH3emissions
con-tribute to less than 0.5% and 0.02%, respectively of the total annual UK NOxand N2O emissions.
1 Introduction
The deposition of nitrogen (N) to the soil has increased since the industrial revolution and now ranges from less than 5 kg N ha−1 y−1 in pristine environments to over 80 kg N
ha−1y−1 in the most polluted locations of Europe (Fowler et al., 2004a). In many areas N deposition is dominated by reduced N, NH3 (ammonia) and NH+4 (ammonium), which
together contribute 60% of the total annual emission rate in the UK (Fowler et al., 2004a). Most of the reduced N is re-deposited over a much shorter distance than oxidised N, and for islands like the UK the export of NH3 to other
countries is negligible. The livestock industry is the single largest source of NH3 and intensive livestock farms create
significant local hotspots of elevated atmospheric NH3
con-centrations (Theobald et al., 2004). The rate of deposition is dependent on the downwind land use and its surface rough-ness. Deposition rates to a forest can be 2 to 3 fold larger than to shorter vegetation (Fowler et al., 2004b). Fowler et al. (1998) have shown that over 60% of the elevated NH3
emitted was deposited to a downwind forest within 50 m, but declined to background concentrations within a few hundred meters. The high rates of N deposited to the forest floor in-creased the N content of the plant tissues and the soil and also soil emissions of N2O (nitrous oxide) and NO (nitric
oxide) (Pitcairn et al., 1998; Skiba et al., 2004). High N de-position rates will eventually result in changes in the forest floor plant communities to nitrogen tolerant species (Pitcairn et al., 1998).
The steep gradient of NH3deposition rates does provide
376 U. Skiba et al.: Ammonia deposition and N trace gas emissions
P
o
u
ltry sh
ed
s
62
.6
m
N
B
C
A
D
I
SW
Figure 1
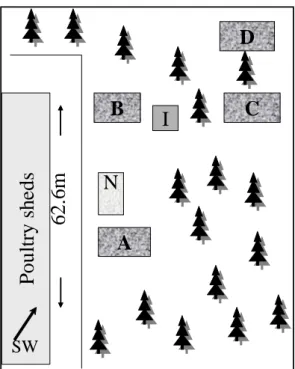
Fig. 1. A schematic diagram, not drawn to scale, of the study site. The prevailing wind direction is southwesterly (SW). Mea-surements were made 15 m (A), 25 m (B), 45 m (C) and 270 m (D) downwind from the centre of the closest shed. (I) represents the shed housing loggers, instruments and control unit for the au-tochambers. (N) represents the autochamber for N2O flux
measure-ments.
deposition on biological and chemical processes under sim-ilar climatic conditions. In this paper we have concentrated on the significance of an intensive poultry farm for increased downwind emissions of the atmospheric pollutants NO and N2O.
2 Site description and methods
Measurements were made in a mixed woodland downwind of a large poultry farm in Scotland, which has been oper-ating for about 40 years, from January to mid July 2004. The poultry farm grows broilers in 8 sheds (63 m long), each containing 20 000 birds on a 40-day cycle. The sheds are arranged in parallel pointing from NNW to SSE. The pre-vailing wind direction is from the SW. The edge of this farm borders onto the woodland located on freely drained brown earth (pH 3.2 in CaCl2, 9.5% C and 0.44% N), containing
a mixture of pine and birch with undergrowth of grasses in the sunnier parts and brambles, ferns and mosses dominant in the shadier parts.
Four sites were established at increasing distance down-wind from the centre of the closest of the poultry sheds. The closest site (A) was established at the edge of the woodland at 15 m, directly opposite the centre of the shed. The second
site (B) was installed 17 m away from A and 15 m opposite the downwind edge of the poultry shed, and therefore was 25 m downwind of the centre of the farm building. Site C was located 18 m east of site A and 45 m downwind from the centre of the poultry shed. A “background” site (D) was installed 270 m downwind of the farm (NW) (Fig. 1)
Monthly concentrations of atmospheric NH3 and NO2
were monitored using continuous time-integrated sampling with passive diffusion samplers. Triplicate ALPHA sam-plers for NH3 and triplicate modified GRADKO diffusion
tubes for NO2were installed at a height of 1.5 m at all sites
and were prepared and analysed within two weeks of collec-tion according to standard protocols developed at CEH; by conductivity for NH3and by colorimetric methods for NO2
(Tang et al., 2001). The ALPHA sampler method was rig-orously tested against a reference active diffusion denuder method (Sutton et al., 2001). The GRADKO diffusion tube (Stevenson et al., 2001) was modified by addition of a turbu-lence damping membrane across the air inlet and validated (Bush et al., 2001).
Throughfall containers (2 per site), containing the biocide thymol, collected rainwater and material that has been dry deposited onto the leaves falling through the tree canopy over a 0.2 m2area at sites A–C. At the background site D, 3 rain-fall collectors (0.035 m2)were installed at a height of 1.5 m. Throughfall and rainfall samples were bulked to provide a monthly sample analysed for NH+4 and NO−3 concentrations by standard colorimetric methods.
For manual N2O measurements by the static chamber
ap-proach, two small round polypropylene chambers fitted with a 4.5 cm wide outward facing flange (31 l) and covering a sur-face area of 0.123 m2were installed at each site for the dura-tion of the field experiment (MacDonald et al., 1997). Fluxes were measured at roughly monthly intervals, by closing the chambers for a 1 h period around midday using lids manu-factured from UV permeable polyvinylchloride attached in a dome shape fashion to a second flange. A circle of rubber attached to the underside of the flange acted as a seal when attached to the flange of the chamber during the measurement period. Samples were collected by syringe from a small port at the site of the chamber and were stored in 1 l Tedlar bags until analysis within 3 days of sample collection, by gas chro-matography using an electron capture detector (ECD) detec-tor. The detection limit of the ECD for N2O was <20 ppb
and the precision was 2%. Concentrations were calculated against an N2O standard containing 1 ppm N2O in a 20%
O2, 80% N2mix. The ECD response was linear in the range
of 0.3 to >10 ppm N2O. The bulk samples were analysed for
N2O by gas chromatography at least twice and more often if
agreement between duplicates was poor.
In addition to the above described monthly samples at dif-ferent locations in the forest the temporal variations of N2O
were monitored by collecting one daily sample from an au-tomatically closing static chamber (1 m2, 130 l) positioned between sites A and B, 20 m downwind of the centre point
U. Skiba et al.: Ammonia deposition and N trace gas emissions 377 of the shed. The design of the autochamber is described in
detail by Kitzler et al. (2005). The chamber was closed for one-hour periods every midday and samples were collected immediately after chamber closure and 45 and 60 min later. The samples were pumped at a flowrate of 100 ml min−1into 20 ml glass vials for a period of 10 min. The vials were sit-uated on a rotational fraction collector housed in a weather proof container and were collected for analysis of N2O by
gas chromatography at least every 14 days. Routine tests showed that over the 14-day period concentrations of 1 ppm N2O did not deteriorate inside the vials. Fluxes were
calcu-lated from the difference between N2O concentrations in
am-bient air (manual static chambers) or in chamber air immedi-ately after closure (automatic static chamber), the headspace volume, and the surface area enclosed by the chamber and the length of enclosure time. The enclosure time of 1 h was routinely applied; tests showed that the N2O concentration
inside both chamber types increased linearly with time of closure for at least 2 h. There are views that the static enclo-sure method underestimates the real flux by not considering N2O stored in the surface layers of the soil. The linear model
developed by Conen and Smith (2000) to calculate the frac-tion of N2O stored in soil air suggests that the potential
un-derestimation by using static rather than dynamic chambers was 9% for the 1 m2autochamber and 16% for the 40 cm di-ameter round chambers. These underestimates are not trivial and therefore absolute values should be treated with caution. However, as the same static chamber approach was used for all chambers, a comparison between sites receiving different rates of deposition is valid.
NO fluxes were measured by the dynamic chamber ap-proach. At the three closest sites (A–C) 2 square automati-cally closing dynamic PTFE chambers (18 l) were installed for hourly NO, (NOx-NO) and O3 flux measurements per
site. The chamber system is described in detail by Pilegaard et al. (1999). Two small fans stirred the air in each cham-ber. Upon closure ambient air from a single location, and 1 m above the soil surface close, was pushed through the cham-ber at a rate of 11 l min−1. Complete mixing of air inside the chambers was not demonstrated here, but was shown by Pilegaard et al. (1999) under very similar conditions. At the opposite chamber outlet the combined pump vacuum of the NOx and O3analysers drew air into the analysers at a rate of
2 l min−1. The pressure deficit in the chamber was <0.5 Pa, therefore not affecting the magnitude of the NOx fluxes mea-sured. One minute average NO, (NOx-NO) and O3
concen-trations were recorded on a 23x Campbell data logger. These data could be viewed and downloaded online via a modem. The analysers, logger and pumps were housed in a water-proof powered shed receiving mains power from the poultry house. NO and (NOx-NO) was measured by chemilumines-cence fitted with a molybdenum converter, the analyser pro-vides an output of NO, NOx and (NOx-NO); the latter are
all other nitrogenous species measured by the analyser and include NO2, HNO3, HONO, PAN, NH3and aerosol NH4,
NO3and NO2. The analyser had a detection limit of 0.3 ppb
for NO and a response time of 40 s over a 10 s average period. The stability of the analyser was <0.4 ppb zero drift over a 24 h period. Calibration was performed by diluting 10.3 ppm NO in nitrogen by gas phase titration. Due to the excellent stability of the analyser this calibration was only performed at the beginning and end of the flux measurement period, but zero drift was monitored weekly using a portable calibrator. Ozone was measured using a dual channel photometric ozone analyser with a detection limit of 1 ppb.
The chambers closed in sequence for 8 min in the order Site A, Site B, a blank chamber fitted with PTFE bottom adjacent to the two chambers at site B and then site C. In the remaining 4 min of every hour ambient air was analysed for NO, (NOx-NO) and O3. In order to avoid long residence
times of unstable gases in the supply lines (6 mm bore), these were kept to a maximum, but same length of 20 m. This maximum distance between chambers and analysers also de-termined the distances between the 3 transect sites. Unfor-tunately the fourth site was too far to be connected to the automated NO, (NOx-NO) flux measurement system and the
power supply. Fluxes were calculated from the concentra-tion difference between the chamber and blank chamber, the flow rate of air through the chamber and the surface area of the chamber. The chemical reactions of NO with O3
in-side the chambers were taken into account, as described by Butterbach-Bahl et al. (1998).
Measurements of soil temperatures at 2, 5, 7, 10 cm depth using thermocouples and soil moisture by theta probe (Delta T) were made continuously. Fifteen-minute averages were stored on a Campbell 21x data logger. The theta probe volt-age measurements were converted to volumetric moisture contents, using conversion factors established for the study soil, rather than using the company’s standard calibration factors. Soils were analysed for KCl extractable (1 M) NH+4 and NO−3 concentrations in the surface 10 cm once during the measurement period using established colorimetric methods (Henriksen and Slemer-Olsen, 1970).
3 Results
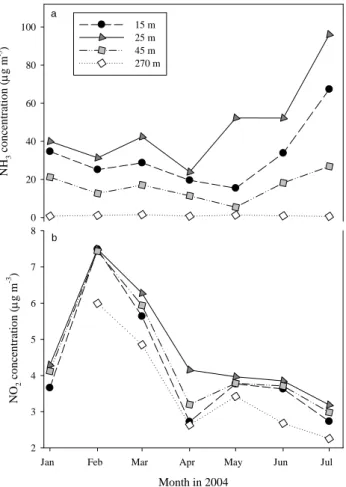
The monthly NH3concentrations measured at the three sites
close to the farm were on average 20 to 40 times larger than at the background site, 270 m away (Fig. 2a). Largest NH3 concentrations were measured at site B, which is
fur-ther away from the centre of the farm building (25 m down-wind of the farm) than site A; but due to its position in rela-tion to the farm building and the prevailing SW wind direc-tion receives the plume from all farm vents, whereas site A only receives the plume from 50% of the farm vents. This difference was reflected in the NH3 concentration
measure-ments (Fig. 2a). Average concentrations for the three sites 15, 25 and 45 m downwind were 34.3±20.4, 47.6±24.9 and
378 U. Skiba et al.: Ammonia deposition and N trace gas emissions NH 3 co n cen tr atio n ( μg m -3) 0 20 40 60 80 100 15 m 25 m 45 m 270 m Month in 2004
Jan Feb Mar Apr May Jun Jul
NO 2 c onc ent ra ti on ( μg m -3 ) 2 3 4 5 6 7 8 a b
Fig. 2. Concentrations of atmospheric NH3(a) and NO2(b)
down-wind of the poultry farm.
21.7±16.8 µg NH3m−3. Background concentrations at the
site 270 m downwind were 1.15±0.7 µg NH3m−3.
The NO2 concentrations did not differ between the three
sites closest to the farm, but they were all slightly larger com-pared to the background site (Fig. 2b). This could simply reflect the frequent traffic of vehicles to the farm, which did not occur at the more remote background site. The average annual concentrations at sites A–C were 3.9±1.4, 4.3±1.3, 4.1±1.3 mg NO2m−3and at the background site 3.1±1.4 mg
NO2m−3.
Rates of NH3deposition to the relatively open forest floor
were estimated using deposition velocities calculated else-where, because necessary meteorological variables to calcu-late deposition velocities from first principles were not mea-sured in this forest. The same concentration dependent depo-sition velocities as used by Fowler et al. (1998) for the same forest a few years earlier were applied in this study. These NH3 deposition velocities were based on observations that
over a moorland vegetation canopy resistance increased from 20 s m−1at 0.3 µg NH3m−3to 50 s m−1at 2 µg NH3m−3
for example for wet canopy surfaces (Flechard and Fowler, 1998). Average NH3deposition rates close to the farm may
Table 1. Estimated dry and measured wet N deposition to a mixed forest downwind of an NH3 emitting poultry farm. Average of
monthly cumulative samples (January–June 2004).
Distance NH3-Na NO2-Na NH4-Nb NO3-Nb
from farm kg N ha−1y−1 kg N ha−1y−1 kg N ha−1y−1 kg N ha−1y−1
m mean stdev mean stdev mean stdev mean stdev
15 42.62 24.59 0.46 0.06 22.10 11.82 2.96 1.57
25 62.13 32.29 0.54 0.06 27.29 19.65 3.23 2.12
45 23.43 12.53 0.48 0.05 15.05 7.63 4.41 2.36
270 5.26 4.51 0.35 0.08 2.40c 1.36 1.43c 1.01
aestimated using a concentration dependent deposition velocities
for NH3and a deposition velocity of 1.5 mm s−1for NO2; bmeasured concentrations in throughfall;
cconcentrations in rainwater
Month in 2004
Jan Feb Mar Apr May Jun Jul
NO fl ux ( μg N O -N m -2 h -1 ) 0 50 100 150 200 15 m 25 m 45 m
Fig. 3. Average monthly NO fluxes from hourly data of two auto-matically closing flow through chambers per site. The bars show standard errors of the temporal and spatial variability.
therefore be 62, 42, 23 kg NH3-N ha−1y−1compared to the
background deposition rate of 5 kg NH3-N ha−1 y−1
(Ta-ble 1). The uncertainties in assuming same canopy and aero-dynamic resistances for a forest and moorland ecosystem at slightly different locations are high. However, in comparison the deposition of NH+4, measured by the bulk samplers, do show almost identical fractional increases above background deposition rates in rainwater as calculated for dry NH3
de-position rates (Table 1). Monthly NH+4 concentrations in the bulk collectors were at least 6 times larger than those in rainwater and mostly followed the same pattern observed for NH3, with largest concentrations measured at site B, 25 m
downwind, and smallest at site C, 45 m downwind. The rank-ing order of NH+4 concentrations, site B > site A > site C, was observed in most months. Nitrate concentrations in the bulk collectors were at least 2 times larger than in rainfall, however differences between sites were negligible. The rela-tionship between the NH+4 concentration in the bulk collec-tors and dry deposition of NH3alone was linear and highly
U. Skiba et al.: Ammonia deposition and N trace gas emissions 379
Month in 2004
Jan Feb Mar Apr May Jun Jul N2 O fl ux ( μg N 2 O-N m -2 h -1 ) 0 25 50 75 100 125 15 m 25 m 45 m 270 m
Fig. 4. Nitrous oxide emission downwind of the poultry farm; aver-age fluxes from 2 manual static chambers per site.
correlated, with r2>90% for the two sites closest to the farm (A and B).
Assuming that the calculations of dry deposition rate, us-ing the concentration dependent deposition rates, are correct, then in this forest the dry deposition of NH3was more
im-portant than the wet deposition of NH+4.
Rates of NO2 deposition, assuming a deposition velocity
of 1.5 mm s−1(Duyzer, personal communication), where al-most two orders of magnitude smaller than NH3deposition
rates. Close to the farm the bulk deposition of oxidised N, as measured in the throughfall, was at least 7 fold smaller than that of reduced N (Table 1).
The increased rate of N deposition to the woodland was reflected in the soil available NH+4 and NO−3 concentrations, measured on one occasion (31 March 2004). The same pat-tern as observed for the deposition rates, with largest concen-trations at site B (25 m), followed by site A (15 m) and then C (45 m) was followed. The soil extractable NH+4 and NO−3 concentrations were 6.8±6.0, 10.3±4.1, 3.2±1.9 µg NH+4-N g−dry soil1 and 3.0±1.5, 9.9±5.3, 0.5±0.4 µg NO−3-N g−dry soil1 at site A, B and C with n=6, 9, 6, respectively.
The increased mineral N concentrations along this NH3
deposition gradient provide the substrate for the nitrifying and denitrifying microbes, and consequently have increased the emissions of NO and to a lesser extent N2O (Figs. 3 and
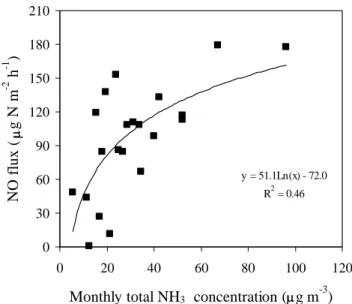
4). Average NO fluxes for the entire study period for site A, B and C were 111.2±41.1, 123.3±40.7, 38.3±28.8 µg NO-N m−2 h−1. The differences between the three sites were statistically significant at p<0.001. Daily NO emissions at site A and B were larger than those measured at site C on 93% and 95% of the 190 days for which flux measurements could be calculated, respectively. Fluxes measured at site B were larger than those measured at site A on 69% of the 190 days. The relationship between the monthly average NO flux
y = 51.1Ln(x) - 72.0 R2 = 0.46 0 30 60 90 120 150 180 210 0 20 40 60 80 100 120
Monthly total NH3 concentration (μg m
-3 ) N O flux ( μ g N m -2 h -1 )
Fig. 5. The relationship between monthly average NO flux and NH3
concentrations at the three transect sites downwind of the poultry farm.
and monthly cumulative NH3 concentration was log linear
and significant (p<0.001) (Fig. 5).
For N2O, average fluxes for the 8 measurements were
9.9±7.5, 34.3±33.3, 21.2±6.1 and 1.8±2.5 µg N2O-N m−2
h−1for site A, B, C and the background site D respectively.
Standard deviations of the mean were large due to temporal and spatial variability. The autochamber positioned close to sites A was employed to provide 1 daily N2O flux
measure-ment. The temporal scatter of the N2O fluxes was normally
distributed over the entire measurement period and the aver-age flux (12.9±15 µg N2O-N m−2h−1, n=136) was in
rea-sonable agreement with the monthly static chamber measure-ments from site A. At site B largest flux rates were measured and at site C occasional negative fluxes of N2O, indicating
N2O uptake, were measured (Fig. 4). None of these
differ-ences were statistically significant. Fluxes at site C were larger than those at site A, possibly caused by the slightly wetter soil conditions at site C. Average volumetric soil mois-ture contents for site C were 35.1±6.2% and at sites A and B 31.3±2.3% and 31.9±5.2%, respectively.
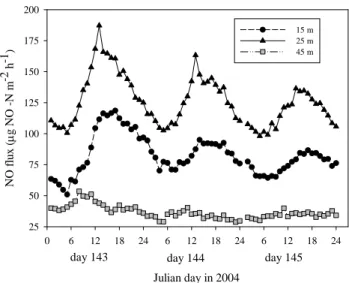
Nitric oxide fluxes were significantly influenced by daily and seasonal temperature changes. NO emissions followed a diurnal pattern with maximum emissions approximately 3 h after noon at sites A and B (Fig. 6). The oscillation fre-quency was much larger for locations where large NO fluxes were measured compared to locations where the NO flux was small. Daily average NO fluxes correlated significantly with daily average soil temperatures measured at the soil surface and 2, 5 and 10 cm below the soil surface. The daily aver-age soil temperature ranged between –1 and 13◦C at the soil surface and between 4.3 and 11.7◦C at a soil depth of 10 cm. For NO the correlations were significant at p>0.001 at all
380 U. Skiba et al.: Ammonia deposition and N trace gas emissions day 144 day 143 day 145 Julian day in 2004 0 6 12 18 24 6 12 18 24 6 12 18 24 NO f lu x ( µg NO -N m -2 h -1) 25 50 75 100 125 150 175 200 15 m 25 m 45 m
Fig. 6. The diurnal variations in NO flux from 2 chamber each at 15, 25 and 45 m downwind of the poultry farm in May 2004. Data are averages from two chambers.
soil depths. Best linear correlations were observed between NO flux and the soil surface temperature and a depth of 2 cm depth for plots at site A and B. At site C, however, best cor-relations were obtained with soil temperatures at 5 and 10 cm depth. The linear relationships between the inverse absolute soil temperature and the natural logarithm of the NO flux at site A and B provided r2values of 46% and 24% (n=186) and activation energies, calculated from the slope of the rela-tionship, of 59 and 33 kJ mol−1. For site C the r2was 39.4% (n=234) and the activation energy was 140 kJ mol−1. For N2O the relationship with soil temperature was established
over a 15 day period, when the autochamber was used to measure fluxes every 6 h for 15 days. No consistent diurnal pattern could be established from this work.
The soil moisture content for the entire study period varied between 16 and 63% (v/v). A linear relationship between NO flux and soil moisture content was only observed at site C where NO emissions decreased with increasing soil moisture content (r2=0.001). For N2O fluxes measured by static and
auto chambers no linear relationship with soil moisture was observed. However, fluxes >27 µg N2O-N m−2 h−1 were
only observed at soil moisture contents above 30% (v/v).
4 Discussion
We have shown that point source emissions of NH3
signif-icantly increased atmospheric concentrations of NH3
down-wind of the source, implying increased rates of dry depo-sition of NH3 and wet deposition of NH+4 to the close by
woodland. Ammonia concentrations, measured inside the woodland downwind of the farm, were between 20 and 40 times larger than the background concentrations of 1.15 µg
m−3 270 m downwind. The background concentrations are
within the range of concentrations measured and modelled for UK agricultural fields (Dragosits et al., 2002). Also the FRAME (Fine Resolution Atmospheric Multi-species Ex-change, Singles et al., 1998) model output for the 5 km grid square, in which the study farm is situated, estimated a grid average NH3concentration of 1.32 µg m−3. Similar
elevated NH3concentrations and relatively fast decay rates
over a short distance (<300 m) have been observed at sev-eral woodlands downwind of intensive poultry and pig farms (e.g. Theobald et al., 2004; Spangenberg and K¨olling, 2004) and also downwind of an artificial NH3release source over
an ombrotrophic bog (Leith et al., 2004). Thus a tree shel-terbelt can be ideal in not only screening an unsightly animal farm from the public, but also by creating a biological fil-ter, which contains the pollution to a small local area. The side effect, however, is that the enhanced N deposition can increase the soil mineral N content (Skiba et al., 2004) and consequently the emission of the atmospheric pollutants N2O
and NO and also can increase the risk of loss or change in biodiversity. Pitcairn et al. (1998) have reported a prevalence of N loving species and lack of N sensitive species close to the poultry farm discussed in this paper. Due to the close distance to this very large NH3point source, the total N
de-position appears to be dominated by dry dede-position of NH3,
rather than wet deposition of NH+4 and NO−3, which was the case for the transect of European forests investigated under NOFRETETE (Pilegaard et al., 2006). Both studies have shown strong relationships between N deposition and NO emission. A linear relationship between NO flux and wet deposition of N was observed for the coniferous forests of the European transect studied in the NOFRETETE project (Pilegaard et al., 2006). For this forest downwind of the poultry farm, where environmental variations are minimal in comparison to the European transect, a log linear relation-ship between NO flux and atmospheric NH3 concentration
was demonstrated (Fig. 5). In addition to nitrogen, the most important variables that influenced NO emission rates were soil moisture and soil temperature. The literature supports the observations that NO increased linearly with increased soil temperature, but decreased with increasing soil moisture content once the optimum moisture content has been passed (Kitzler et al., 2005; Davidson et al., 2000; van Dijk and Duyzer, 1999; Skiba et al., 1997). The much larger activa-tion energy calculated for the relaactiva-tionship between soil tem-perature and NO flux at site C, suggests that conditions were less optimal for NO to be produced and emitted compared to the closer sites receiving larger rates of N deposition (Skiba et al., 1992).
For both studies, the European transect studied in the NOFRETETE project (Pilegaard et al., 2006) and the for-est downwind of the poultry farm, relationships between N deposition rate and N2O emission were very weak.
How-ever, the trend of decreasing N2O emissions with decreasing
NH3concentrations and distance away from the farm are in
U. Skiba et al.: Ammonia deposition and N trace gas emissions 381 good agreement with previous measurements from the same
forest in 1995 (5 dates) and 1997 (3 dates) when the same chambers, this time three replicates, and the same measure-ment strategy was employed (Skiba et al,, 1998). For the poultry farm also relationships between N2O flux and soil
moisture and soil temperature changes were much weaker than for NO. Possible reasons are that the data set for N2O in
this study is much smaller than for NO (monthly rather than hourly data), but perhaps more importantly, that the environ-mental variables, particularly the redox potential of the soil, most commonly measured by the surrogates soil moisture or water filled pore space, exert a stronger control on N2O than
NO.
Overall the NO and N2O emissions downwind of this
poultry farm were larger than the maximum annual emissions calculated for the European transect (Pilegaard et al., 2006). Downwind of the poultry farm maximum emissions for the study period were 123 µg NO-N m−2h−1and 34.3 µg N
2
O-N m−2 h−1 compared to 75 and 81 µg NO-N m−2 h−1 in the Dutch and south German coniferous forests and 20 µg N2O-N m−2h−1in the Hungarian and Italian forests.
On average the NO emissions expressed as a fraction of the elevated N deposited as throughfall were 39% (at 15 m), 30% (at 25 m) and 17% (at 45 m) downwind of the farm, whereas for N2O the emissions were 3.5% (at 15 m), 9.8% (at 25 m),
9.5% (at 45 m) and 4.1% (at 270 m) downwind of the farm. Due to high spatial and temporal variability the uncertainty in these emission factors is high, 50% for NO and 80% for N2O. However these emission fractions exceed the emission
factor of 1% (±50%) advised by the IPCC for N2O emissions
resulting from atmospheric N deposition (Houghton et al., 2001) for some of the sites.
5 Conclusion
This study has shown that increased atmospheric nitrogen de-position rates increased the emissions of NO and N2O. For
N2O the rate of increase was larger than predicted by the
IPCC (Houghton et al., 2001).
Although the emission rates of atmospheric pollutants downwind of intensive NH3 emitting livestock farms were
large, the contribution to the total national NO and N2O
emissions are negligible. If we assume the conditions and emission factors observed in this study are true for the entire British poultry flock (360 million), which emits 28 kt NH3
y−1(calculated from standard NH
3emission factors for
poul-try manure); then intensive poulpoul-try farming will contribute an additional 36 t NO-N y−1and 10 t N2O-N y−1. This is only
a small percentage of the total annual NO and N2O emitted
from British soils of 7 kt NO-N y−1 and 56 kt N2O-N y−1
(Skiba et al., 2001).
Acknowledgements. We wish to thank the farmer for electricity supply and access to the farm, G. Rutherford, A. Horsburgh and D. McEwan for their help in installing and dismantling the field experiment and L. Love for assistance in preparation and chemical analysis of passive NH3and NO2samplers. This work is part of
the EU project NOFRETETE EVK2-CT2001-00106. Edited by: F. X. Meixner
References
Bush, T., Smith, S., Stevenson, K., and Moorcroft, S.: Validation of nitrogen dioxide diffusion tube methodology in the UK, Atmos. Environ., 35, 289–296, 2001.
Butterbach-Bahl, K., Gasche, R., Huber, C., Kreutzer, K., and Pa-pen, H.: Impact of N-input by wet depostion on N-trace gas fluxes and CH4-oxidation in spruce forest ecosystems of the tem-perate zone in Europe, Atmos. Environ., 32(3), 559–564, 1998. Conen, F. and Smith, K. A.: An explanation of linear increases in
gas concentrations under closed chambers used to measure gas exchange between soil and atmosphere, Europ. J. Soil Sci., 51, 111–117, 2000.
Davidson, E. A., Keller, M., Erickson, H. E., Verchot, L. V., and Veldkamp, E.: Testing a conceptual model of soil emissions of nitrous and nitric oxides, BioScience, 50, 667–680, 2000. Dragosits, U., Theobald, M. R., Place, C. J., Lord, E., Webb, J.,
Hill, J., ApSimon, H. M., and Sutton, M. A.: Ammonia emission, deposition and impact assessment at the field scale: a case study of sub-grid spatial variability, Environ. Pollution, 117, 147–158, 2002.
Flechard, C. R. and Fowler, D.: Atmospheric ammonia at a moor-land site. II: Long term surface atmospheric micrometeorological flux measurements, Q. J. Meteorol. Soc., 124, 733–757, 1998. Fowler, D., O’Donoghue, M., Muller, J. B. A., Smith, R. I.,
Dragosits, U., Skiba, U., Sutton, M., and Brimblecombe, P.: A chronology of nitrogen deposition in the UK between 1900 and 2000, Water air and soil pollution: Focus, 4, 9–23, 2004a. Fowler, D., Skiba, U., Nemitz, E., Choubedar, F., Branford, D.,
Donovan, R., and Rowland, P.: Measuring aerosols and heavy metal deposition on urban woodland and grass using inventories of210Pb and metal concentrations in soil, Water, Air and Soil Pollution: Focus, 4, 483–499, 2004b.
Fowler, D., Pitcairn, C. E. R., Sutton, M. A., Flechard, C., Lou-bet, B., Coyle, M., and Munro, R. C.: The mass budget of atmo-spheric ammonia in woodland within 1 km of livestock buildings, Environ. Pollution, 102, 343–348, 1998.
Henriksen, A. and Slemer-Olsen, A. R.: Automatic methods for determining nitrate and nitrite in water and soil extracts, Analyst, 95, 514–518, 1970.
Houghton, J. T., Meira Filho, L. G., Lim, B., Treanton, K., Mamaty, I., and Bonduki, Y.: Revised 1996 IPCC Guidelines for National Greenhouse Gas Inventories, in: Reference Manual Vol. 3, edited by: Griggs, D. J. and Callender, B. A., IPCC/OECD/IEAUK Me-teorological Office, Bracknell, 2001.
Kitzler, B., Zechmeister-Boltenstern, S., Holtermann, C., Skiba, U., and Butterbach-Bahl, K.: Nitrogen oxides emission from two beech forests subjected to different nitrogen loads, Biogeo-sciences Discuss., 2, 1381–1422, 2005,
382 U. Skiba et al.: Ammonia deposition and N trace gas emissions Leith, I. D., Sheppard, L. J., Fowler, D., Cape, J. N., Jones, M.,
Crossley, A., Hargreaves, K. J., Tang, S. Y., Theobald, M., and Sutton, M. A.: Quantifying dry NH3deposition to an om-brotrophic bog from an automated NH3field release system,
Wa-ter Air and Soil Pollution: Focus, 4, 207–218, 2004.
MacDonald, J. A., Skiba, U. M., Sheppard, L. J., Ball, B., Roberts, J. D., Smith, K. A., and Fowler, D.: The effect of nitrogen depo-sition and seasonal variability on methane oxidation and nitrous oxide emission rates in an upland spruce plantation and moor-land, Atmos. Environ., 31, 3693–3706, 1997.
Pilegaard, K., Hummelshøj, P., and Jensen, N. O.: Nitric oxide emission from a Norway spruce forest floor, J. Geophys. Res., 104, 3433–3445, 1999.
Pilegaard, K., Skiba, U., Ambus, P., Beier, C., Bruggemann, N., Butterbach-Bahl, K., Dick, J., Dorsey, J., Duyzer, J., Gallagher, M., Gasche, R., Horvath, L., Kitzler, B., Leip, A., Pihlatie, M. K., Rosenkranz, P., Seufert, G., Vesala, T., Westrate, H., and Zechmeister-Boltenstern, S.: Nitrogen load and forest type de-termine the soil emission of nitrogen oxides (NO and N2O), Bio-geosciences Discuss., 3, 837–869, 2006,
http://www.biogeosciences-discuss.net/3/837/2006/.
Pitcairn, C. E. R., Leith, I. D., Sheppard, L. J., Sutton, M. A., Fowler, D., Munro, R. C., Tang, S., and Wilson, D.: The rela-tionship between nitrogen deposition, species composition and foliar nitrogen concentrations in woodland flora, Environ. Pollu-tion, 102, 41–48, 1998.
Singles, R., Sutton, M. A., and Weston, K. J.: A multi-layer model to describe the atmospheric transport and deposition of ammonia in Great Britain, Atmos. Environ., 32, 393–399, 1998.
Skiba, U., Pitcairn, C., Sheppard, L., Kennedy, V., and Fowler, D.: The influence of atmospheric N deposition on nitrous oxide and nitric oxide fluxes and soil ammonium and nitrate concentrations, Water, Air and Soil Pollution: Focus, 4, 37–43, 2004.
Skiba, U., Sozanska, M., Metcalfe, S., and Fowler, D.: Spatially dis-aggregated inventories of soil NO and N2O emissions for Great Britain, Water Air and Soil Pollution, 1, 109–118, 2001.
Skiba, U., Sheppard, L., Pitcairn, C. E. R., Leith, I., Crossley, A., van Dijk, S., Kennedy, V. H., and Fowler, D.: Soil nitrous oxide and nitric oxide emissions as indicators of elevated atmospheric N deposition rates in seminatural ecosystems, Environ. Pollution, 102, 457–461, 1998.
Skiba, U., Fowler, D., and Smith, K. A.: Nitric oxide emis-sions from agricultural soils in temperate and tropical climates: sources, control and mitigation options, Nutrient Cycling in Agroecosys., 48, 75–90, 1997.
Skiba, U., Hargreaves, K. J., Smith, K. A., and Fowler, D.: Fluxes of nitric and nitrous oxides from agricultural soils in a cool tem-perate climates, Atmos. Environ., 26A, 2477–2488, 1992. Spangenberg, A. and K¨olling, C.: Nitrogen deposition and nitrate
leaching at forest edges exposed to high ammonia emissions in southern Bavaria, Water, Air and Soil Pollution, 152, 233–255, 2004.
Stevenson, K., Bush, T., and Mooney, D.: Five years of nitrogen dioxide measurement with diffusion tube samplers at over 1000 sites in the UK, Atmos. Environ., 35, 281–287, 2001.
Sutton, M. A., Tang, Y. S., Miners, B., and Fowler, D.: A new diffu-sion denuder system for long-term, regional monitoring of atmo-spheric ammonia and ammonium, Water, Air Soil Poll., Focus 1, Part 5/6, 145–156, 2001.
Tang, Y. S., Cape, J. N., and Sutton, M. A.: Development and types of passive samplers for monitoring atmospheric NO2and NH3
concentrations, The Scientific World 1, 513–529, 2001. Theobald, M., Dragosits, U., Place, C. J., Smith, J. U., Sozanska,
M., Brown, L., Scholefield, D., Del Prado, A., Webb, J., White-head, P., Angus, A., Hodge, I. D., Fowler, D., and Sutton, M. A.: Modelling nitrogen fluxes at the landscape scale, Water, Air and Soil Pollution: Focus, 4, 135–142, 2004.
van Dijk, S. M. and Duyzer, J. H.: Nitric oxide emissions from forest soils, J. Geophys. Res., 104, 15 955–15 961, 1999.