HAL Id: dumas-02492914
https://dumas.ccsd.cnrs.fr/dumas-02492914
Submitted on 27 Feb 2020HAL is a multi-disciplinary open access
archive for the deposit and dissemination of sci-entific research documents, whether they are pub-lished or not. The documents may come from teaching and research institutions in France or abroad, or from public or private research centers.
L’archive ouverte pluridisciplinaire HAL, est destinée au dépôt et à la diffusion de documents scientifiques de niveau recherche, publiés ou non, émanant des établissements d’enseignement et de recherche français ou étrangers, des laboratoires publics ou privés.
Prédiction de la réponse thérapeutique précoce par TEP
au 18FDG dans le cancer du sein HER2+ : Approche
conventionnelle et analyse texturale en situation
néoadjuvante
Marion Chanchou
To cite this version:
Marion Chanchou. Prédiction de la réponse thérapeutique précoce par TEP au 18FDG dans le cancer du sein HER2+ : Approche conventionnelle et analyse texturale en situation néoadjuvante. Life Sciences [q-bio]. 2019. �dumas-02492914�
N°
Année 2019
UNIVERSITÉ CLERMONT AUVERGNE
UFR DE MÉDECINE ET DES PROFESSIONS PARAMÉDICALES
THÈSE D’EXERCICE
pour leDIPLÔME D’ÉTAT DE DOCTEUR EN MÉDECINE
parCHANCHOU Marion
Présentée et soutenue publiquement le 03 septembre 2019
Prédiction de la réponse thérapeutique précoce par TEP au
18FDG
dans le cancer du sein HER2+ : Approche conventionnelle et analyse
texturale en situation néoadjuvante.
Directeur de thèse : Monsieur CACHIN Florent, Professeur, Centre de Lutte contre le Cancer Jean Perrin (Service de Médecine Nucléaire)
Président du jury : Madame PENAULT-LLORCA Frédérique, Professeur, UFR de Médecine et des professions paramédicales de Clermont-Ferrand.
Membres du jury :
Madame PENAULT-LLORCA Frédérique, Professeur, UFR de Médecine et des professions paramédicales de Clermont-Ferrand.
Monsieur CACHIN Florent, Professeur, UFR de Médecine et des Professions paramédicales de Clermont-Ferrand
Monsieur DURANDO Xavier, Professeur, UFR de Médecine et des professions paramédicales de Clermont-Ferrand.
Madame ORLHAC Fanny, PhD, Chercheure post-doctorante, Equipe-projet Epione, Inria, Sophia-Antipolis.
1
N°
Année 2019
UNIVERSITÉ CLERMONT AUVERGNE
UFR DE MÉDECINE ET DES PROFESSIONS PARAMÉDICALES
THÈSE D’EXERCICE
pour leDIPLÔME D’ÉTAT DE DOCTEUR EN MÉDECINE
parCHANCHOU Marion
Présentée et soutenue publiquement le 03 septembre 2019
Prédiction de la réponse thérapeutique précoce par TEP au
18FDG
dans le cancer du sein HER2+ : Approche conventionnelle et analyse
texturale en situation néoadjuvante.
Directeur de thèse : Monsieur CACHIN Florent, Professeur, Centre de Lutte contre le Cancer Jean Perrin (Service de Médecine Nucléaire)
Président du jury : Madame PENAULT-LLORCA Frédérique, Professeur, UFR de Médecine et des professions paramédicales de Clermont-Ferrand.
Membres du jury :
Madame PENAULT-LLORCA Frédérique, Professeur, UFR de Médecine et des professions paramédicales de Clermont-Ferrand.
Monsieur CACHIN Florent, Professeur, UFR de Médecine et des Professions paramédicales de Clermont-Ferrand
Monsieur DURANDO Xavier, Professeur, UFR de Médecine et des professions paramédicales de Clermont-Ferrand.
Madame ORLHAC Fanny, PhD, Chercheure post-doctorante, Equipe-projet Epione, Inria, Sophia-Antipolis.
2
UNIVERSITE CLERMONT AUVERGNE
PRESIDENTS HONORAIRES UNIVERSITE D’AUVERGNE : JOYON Louis - DOLY Michel - TURPIN
Dominique - VEYRE Annie - DULBECCO Philippe - ESCHALIER Alain
PRESIDENTS HONORAIRES UNIVERSITE BLAISE PASCAL : CABANES Pierre - FONTAINE Jacques -BOUTIN
Christian - MONTEIL Jean-Marc - ODOUARD Albert - LAVIGNOTTE Nadine
PRESIDENT DE L'UNIVERSITE et PRESIDENT DU CONSEIL ACADEMIQUE PLENIER : BERNARD Mathias PRESIDENT DU CONSEIL ACADEMIQUE RESTREINT : DEQUIEDT Vianney
VICE-PRESIDENT DU CONSEIL D'ADMINISTRATION : WILLIAMS Benjamin VICE-PRESIDENT DE LA COMMISSION DE LA RECHERCHE : HENRARD Pierre
VICE PRESIDENTE DE LA COMMISSION DE LA FORMATION ET DE LA VIE UNIVERSITAIRE : PEYRARD
Françoise
DIRECTEUR GENERAL DES SERVICES : PAQUIS François
UFR DE MEDECINE ET DES PROFESSIONS PARAMEDICALES
DOYENS HONORAIRES : DETEIX Patrice - CHAZAL Jean DOYEN : CLAVELOU Pierre
RESPONSABLE ADMINISTRATIVE : ROBERT Gaëlle
LISTE DU PERSONNEL ENSEIGNANT
PROFESSEURS HONORAIRES :
MM. BACIN Franck - BEGUE René-Jean - BOUCHER Daniel - BOURGES Michel - BUSSIERE Jean-Louis - CANO Noël - CASSAGNES Jean - CATILINA Pierre - CHABANNES Jacques – CHAZAL Jean - CHIPPONI Jacques - CHOLLET Philippe - COUDERT Jean - DASTUGUE Bernard - DEMEOCQ François - DE RIBEROLLES Charles - ESCANDE Georges - Mme FONCK Yvette - MM. GENTOU Claude - GLANDDIER Gérard - Mmes GLANDDIER Phyllis - LAVARENNE Jeanine - MM. LAVERAN Henri - LEVAI Jean-Paul - MAGE Gérard - MALPUECH Georges - MARCHEIX Jean-Claude - MICHEL Jean-Luc - MOLINA Claude - MONDIE Jean-Michel - PERI Georges - PETIT Georges - PHILIPPE Pierre - PLAGNE Robert - PLANCHE Roger - PONSONNAILLE Jean - RAYNAUD Elie - REY Michel - Mme RIGAL Danièle - MM. ROZAN Raymond - SCHOEFFLER Pierre - SIROT Jacques - SOUTEYRAND Pierre - TANGUY Alain - TERVER Sylvain - THIEBLOT Philippe - TOURNILHAC Michel - VANNEUVILLE Guy - VIALLET Jean-François - Mle VEYRE Annie
PROFESSEURS EMERITES :
MM. - BEYTOUT Jean - BOITEUX Jean-Paul - BOMMELAER Gilles - CHAMOUX Alain - DAUPLAT Jacques - DETEIX Patrice - ESCHALIER Alain - IRTHUM Bernard - JACQUETIN Bernard - KEMENY Jean-Louis – Mme LAFEUILLE Hélène – MM. LEMERY Didier - LESOURD Bruno - LUSSON René - RIBAL Jean-Pierre
PROFESSEURS DES UNIVERSITES-PRATICIENS HOSPITALIERS
PROFESSEURS DE CLASSE EXCEPTIONNELLE :
M. VAGO Philippe : Histologie-Embryologie Cytogénétique M. AUMAITRE Olivier : Médecine Interne
M. LABBE André : Pédiatrie
M. AVAN Paul : Biophysique et Traitement de l'Image M. DURIF Franck : Neurologie
3 M. BOIRE Jean-Yves : Biostatistiques, Informatique Médicale et Technologies de Communication M. BOYER Louis : Radiologie et Imagerie Médicale option Clinique
M. POULY Jean-Luc : Gynécologie et Obstétrique M. CANIS Michel : Gynécologie-Obstétrique
Mme PENAULT-LLORCA Frédérique : Anatomie et Cytologie Pathologiques M. BAZIN Jean-Etienne : Anesthésiologie et Réanimation Chirurgicale M. BIGNON Yves Jean : Cancérologie option Biologique
M. BOIRIE Yves : Nutrition Humaine M. CLAVELOU Pierre : Neurologie
M. DUBRAY Claude : Pharmacologie Clinique M. GILAIN Laurent : O.R.L.
M. LEMAIRE Jean-Jacques : Neurochirurgie
M. CAMILLERI Lionel : Chirurgie Thoracique et Cardio-Vasculaire M. DAPOIGNY Michel : Gastro-Entérologie
M. LLORCA Pierre-Michel : Psychiatrie d’Adultes M. PEZET Denis : Chirurgie Digestive
M. SOUWEINE Bertrand : Réanimation Médicale
M. BOISGARD Stéphane : Chirurgie Orthopédique et Traumatologie
M. CONSTANTIN Jean-Michel : Anesthésiologie et Réanimation Chirurgicale Mme DUCLOS Martine : Physiologie
M. SCHMIDT Jeannot : Thérapeutique
PROFESSEURS DE 1ère CLASSE :
M. DECHELOTTE Pierre : Anatomie et Cytologie Pathologique M. CAILLAUD Denis : Pneumo-phtisiologie
M. VERRELLE Pierre : Radiothérapie option Clinique M. CITRON Bernard : Cardiologie et Maladies Vasculaires M. D’INCAN Michel : Dermatologie -Vénéréologie Mme JALENQUES Isabelle : Psychiatrie d'Adultes Mle BARTHELEMY Isabelle : Chirurgie Maxillo-Faciale
M. GARCIER Jean-Marc : Anatomie-Radiologie et Imagerie Médicale M. GERBAUD Laurent : Epidémiologie, Economie de la Santé et Prévention M. SOUBRIER Martin : Rhumatologie
M. TAUVERON Igor : Endocrinologie et Maladies Métaboliques M. MOM Thierry : Oto-Rhino-Laryngologie
M. RICHARD Ruddy : Physiologie M. RUIVARD Marc : Médecine Interne
M. SAPIN Vincent : Biochimie et Biologie Moléculaire M. BAY Jacques-Olivier : Cancérologie
M. BERGER Marc : Hématologie
M. COUDEYRE Emmanuel : Médecine Physique et de Réadaptation Mme GODFRAIND Catherine : Anatomie et Cytologie Pathologiques M. ROSSET Eugénio : Chirurgie Vasculaire
M. ABERGEL Armando : Hépatologie
M. LAURICHESSE Henri : Maladies Infectieuses et Tropicales M. TOURNILHAC Olivier : Hématologie
M. CHIAMBARETTA Frédéric : Ophtalmologie
M. FILAIRE Marc : Anatomie – Chirurgie Thoracique et Cardio-Vasculaire M. GALLOT Denis : Gynécologie-Obstétrique
M. GUY Laurent : Urologie
M. TRAORE Ousmane : Hygiène Hospitalière M. ANDRE Marc : Médecine Interne
4 M. BONNET Richard : Bactériologie, Virologie
M. CACHIN Florent : Biophysique et Médecine Nucléaire M. COSTES Frédéric : Physiologie
M. FUTIER Emmanuel : Anesthésiologie-Réanimation Mme HENG Anne-Elisabeth : Néphrologie
M. MOTREFF Pascal : Cardiologie
Mme PICKERING Gisèle : Pharmacologie Clinique
PROFESSEURS DE 2ème CLASSE :
Mme CREVEAUX Isabelle : Biochimie et Biologie Moléculaire M. FAICT Thierry : Médecine Légale et Droit de la Santé Mme KANOLD LASTAWIECKA Justyna : Pédiatrie M. TCHIRKOV Andréï : Cytologie et Histologie M. CORNELIS François : Génétique
M. DESCAMPS Stéphane : Chirurgie Orthopédique et Traumatologique M. POMEL Christophe : Cancérologie – Chirurgie Générale
M. CANAVESE Fédérico : Chirurgie Infantile
M. LESENS Olivier : Maladies Infectieuses et Tropicales M. RABISCHONG Benoît : Gynécologie Obstétrique M. AUTHIER Nicolas : Pharmacologie Médicale
M. BROUSSE Georges : Psychiatrie Adultes/Addictologie M. BUC Emmanuel : Chirurgie Digestive
M. CHABROT Pascal : Radiologie et Imagerie Médicale
M. LAUTRETTE Alexandre : Néphrologie Réanimation Médicale M. AZARNOUSH Kasra : Chirurgie Thoracique et Cardiovasculaire
Mme BRUGNON Florence : Biologie et Médecine du Développement et de la Reproduction Mme HENQUELL Cécile : Bactériologie Virologie
M. ESCHALIER Romain : Cardiologie M. MERLIN Etienne : Pédiatrie
Mme TOURNADRE Anne : Rhumatologie M. DURANDO Xavier : Cancérologie
M. DUTHEIL Frédéric : Médecine et Santé au Travail Mme FANTINI Maria Livia : Neurologie
M. SAKKA Laurent : Anatomie – Neurochirurgie M. BOURDEL Nicolas : Gynécologie-Obstétrique M. GUIEZE Romain : Hématologie
M. POINCLOUX Laurent : Gastroentérologie M. SOUTEYRAND Géraud : Cardiologie
PROFESSEURS DES UNIVERSITES
M. CLEMENT Gilles : Médecine GénéraleMme MALPUECH-BRUGERE Corinne : Nutrition Humaine M. VORILHON Philippe : Médecine Générale
PROFESSEURS ASSOCIES DES UNIVERSITES
Mme BOTTET-MAULOUBIER Anne : Médecine GénéraleM. CAMBON Benoît : Médecine Générale
5
MAITRES DE CONFERENCES HORS CLASSE
Mme CHAMBON Martine : Bactériologie Virologie Mme BOUTELOUP Corinne : Nutrition
MAITRES DE CONFERENCES DE 1ère CLASSE
M. MORVAN Daniel : Biophysique et Traitement de l’Image Mle GOUMY Carole : Cytologie et Histologie, Cytogénétique Mme FOGLI Anne : Biochimie Biologie Moléculaire
Mle GOUAS Laetitia : Cytologie et Histologie, Cytogénétique M. MARCEAU Geoffroy : Biochimie Biologie Moléculaire Mme MINET-QUINARD Régine : Biochimie Biologie Moléculaire M. ROBIN Frédéric : Bactériologie
Mle VERONESE Lauren : Cytologie et Histologie, Cytogénétique M. DELMAS Julien : Bactériologie
Mle MIRAND Andrey : Bactériologie Virologie
M. OUCHCHANE Lemlih : Biostatistiques, Informatique Médicale et Technologies de Communication M. LIBERT Frédéric : Pharmacologie Médicale
Mle COSTE Karen : Pédiatrie
M. EVRARD Bertrand : Immunologie
Mle AUMERAN Claire : Hygiène Hospitalière M. POIRIER Philippe : Parasitologie et Mycologie
Mme CASSAGNES Lucie : Radiologie et Imagerie Médicale M. LEBRETON Aurélien : Hématologie
MAITRES DE CONFERENCES DE 2ème CLASSE
Mme PONS Hanaë : Biologie et Médecine du Développement et de la Reproduction M. JABAUDON-GANDET Matthieu : Anesthésiologie – Réanimation Chirurgicale M. BOUVIER Damien : Biochimie et Biologie Moléculaire
M. BUISSON Anthony : Gastroentérologie M. COLL Guillaume : Neurochirurgie Mme SARRET Catherine : Pédiatrie
M. MAQDASY Salwan : Endocrinologie, Diabète et Maladies Métaboliques Mme NOURRISSON Céline : Parasitologie – Mycologie
MAITRES DE CONFERENCES DES UNIVERSITES
Mme BONHOMME Brigitte : Biophysique et Traitement de l’ImageMme VAURS-BARRIERE Catherine : Biochimie Biologie Moléculaire M. BAILLY Jean-Luc : Bactériologie Virologie
Mle AUBEL Corinne : Oncologie Moléculaire
M. BLANCHON Loïc : Biochimie Biologie Moléculaire Mle GUILLET Christelle : Nutrition Humaine
M. BIDET Yannick : Oncogénétique
M. MARCHAND Fabien : Pharmacologie Médicale M. DALMASSO Guillaume : Bactériologie
M. SOLER Cédric : Biochimie Biologie Moléculaire
M. GIRAUDET Fabrice : Biophysique et Traitement de l’Image Mme VAILLANT-ROUSSEL : Hélène Médecine Générale Mme LAPORTE Catherine : Médecine Générale
6 Mme MARTEIL Gaëlle : Biologie de la Reproduction
M. PINEL Alexandre : Nutrition Humaine
MAITRES DE CONFERENCES ASSOCIES DES UNIVERSITES
M. TANGUY Gilles : Médecine GénéraleM. BERNARD Pierre : Médecine Générale
Mme ESCHALIER Bénédicte : Médecine Générale Mme RICHARD Amélie : Médecine Générale
7
DEDICACES
A Oleg, qui partage ma vie et me soutient au quotidien. Merci d’être là dans cette grande aventure de la vie.
A ma famille, particulièrement à mes parents, qui ont toujours cru en moi, et à mon frère, qui sait ce que signifie se battre pour vivre…
Aux amis de longue date, Nono, Emilie, Lilix, Caro, les jumelles et Bebe, souvent loin des yeux mais jamais loin du cœur !
Aux copines de médecine et pharmacie : Anne-Cho, Marie, Claire, Laure, Odile et Julianne. Que de bons souvenirs partagés ensembles, et encore beaucoup à vivre.
Aux médecins nucléaires de Jean Perrin, pour l’extraordinaire ambiance qu’ils font régner dans ce service, et particulièrement à ceux qui furent d’agréables cointernes. Si je devais remercier chacun d’entre vous, deux pages n’y suffiraient pas. J’espère que nous travaillerons longtemps ensemble.
Aux manipulateurs radio, radiopharmaciens et physiciens de Jean-Perrin, parce que si le service fonctionne, c’est grâce au travail d’équipe.
Aux professeurs Zanca et Mariano-Goulart, qui m’ont fait découvrir ma spécialité bien avant le début d’internat.
A Arnaud, pour avoir pris le temps de réaliser les nombreuses statistiques de cette thèse. Aux copains de l’internat du Puy en Velay et d’Aurillac, pour les innombrables moments de joie que nous avons partagés.
Aux radiologues d’Issoire, pour leur accueil chaleureux et le superbe été que nous avons passé ensemble.
Au service de radiologie d’Aurillac, qui m’a permis de me perfectionner dans ce domaine, et surtout à Friemin, pour sa bonne humeur.
Aux médecins du service d’oncologie du Puy en Velay, qui m’ont permis d’acquérir de bonnes bases dans la prise en charge clinique des patients.
Aux infirmières d’oncologie du Puy en Velay, bien plus qu’une simple équipe de travail. A l’équipe du Haras de Prat, qui me permet de vivre l’un de mes grands rêves d’enfant, et à celle du Batut, pour m’avoir tant appris à ce sujet.
8
REMERCIEMENTS
A Notre Président de Thèse :
A Madame le professeur PENAULT-LLORCA Frédérique, Vous m’avez fait l’honneur d’accepter de présider le jury de ma thèse,
Je tiens à vous témoigner l’expression de mon profond respect, Merci pour votre disponibilité et votre bienveillance.
A Notre Jury de Thèse :
A mon Directeur de Thèse, Monsieur le professeur CACHIN Florent, Tu m’as fait l’honneur de me confier ce projet d’ampleur,
Tes conseils avisés m’ont permis de m’orienter dans ce sujet de recherche sans m’y perdre, Merci pour ton implication dans cette thèse, pour ton engagement quotidien en tant qu’enseignant,
ainsi que pour ton soutien concernant mes projets professionnels.
A Monsieur le professeur DURANDO Xavier,
Vous avez accepté de faire partie de ce jury, permettant ainsi d’apporter votre point de vue clinique sur ce projet,
Soyez-en remercié.
Au Docteur ORLHAC Fanny,
Je vous témoigne toute ma reconnaissance pour nos nombreux échanges de mails et discussion concernant l’analyse de texture,
Vos connaissances m’ont grandement aidée dans la réalisation de ce travail, Je vous en remercie chaleureusement.
9
Table des matières
Dédicaces ... 7
Remerciements ... 8
Table des matières ... 9
Liste des tableaux et figures ... 10
Liste des abréviations ... 11
1. Introduction ... 13
2. Method ... 15
2.1. Population ... 15
2.2. Treatment ... 16
2.3. Clinical and Pathological Assessment ... 17
2.4. 18FDG PET/CT Imaging ... 17
2.5. Statistical Analyses ... 22
3. Results ... 23
3.1. Population ... 23
3.2. Value of 18FDG PET/CT for locoregional staging: Analysis by conventional and textural methods... 24
3.3. Prediction of pathological response by 18FDG PET/CT: Analysis by conventional and textural methods... 26
4. Discussion ... 32
5. Conclusion ... 38
References ... 40
Annexe 1: Breast Cancer TNM classification (American Cancer Society)(3) ... 42
Annexe 2: Numbers and average values of baseline PET conventional and textural analysis: whole population ... 43
Annexe 3: Numbers and average values of interim PET conventional and textural analysis: whole population ... 45
Annexe 4: Principal Component Analysis (PCA) of conventionnal study ... 47
Annexe 5: Principal Component Analysis (PCA) of textural analysis ... 49
Annexe 6: Numbers and average values of baseline PET conventional and textural analysis, depending on pathological results ... 52
Annexe 7: Numbers and average values of interim PET conventional and textural analysis, depending on pathological results ... 55
Serment d’Hippocrate – Version longue ... 61
10
Liste des tableaux et figures
Tableaux
Table I : Population characteristics ... 24
Table II: Results of conventional and texture analysis of PET0, depending on pathological complete response ... 27
Table III: Results of conventional metabolic evaluation on PET1, depending on pathological complete response ... 29
Table IV : Results of textural metabolic evaluation on PET1, depending on pathological complete response ... 30
Table V: Conventional analyses of PET0 in whole population ... 43
Table VI: First order textural analysis on PET0 in whole population ... 43
Table VII : Second order textural analysis on PET0 in whole population ... 43
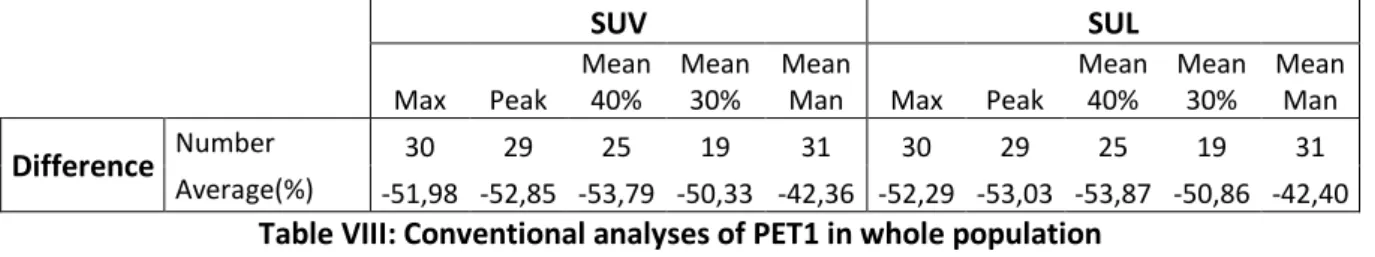
Table VIII: Conventional analyses of PET1 in whole population ... 45
Table IX: First order textural analysis on PET1 in whole population ... 45
Table X: Second order textural analysis on PET1in whole population ... 46
Table XI: Differences in lymph nodal uptakes between PET0 and PET1 ... 46
Table XII: Results of conventional and texture analysis of PET0: Grade 1 of Chevallier versus other patients ... 52
Table XIII : Results of conventional and texture analysis of PET0: Grade 1 versus Grade 2 versus Grade 3 of Chevallier ... 53
Table XIV: Results of PET0 nodal analysis... 54
Table XV: Results of conventional analysis of PET1: Grade 1 of Chevallier versus other patients ... 55
Table XVI: Results of first order textural analysis of PET1: Grade 1 of Chevallier versus other patients ... 56
Table XVII: Results of second order textural analysis of PET1: Grade 1 of Chevallier versus other patients ... 56
Table XVIII: Results of conventional analysis of PET1: Grade 1 versus Grade 2 versus Grade 3 of Chevallier ... 57
Table XIX: Results of first order textural analysis of PET1: Grade 1 versus Grade 2 versus Grade 3 of Chevallier ... 58
Table XX: Results of second order analysis of PET1: Grade 1 versus Grade 2 versus Grade 3 of Chevallier ... 58
Table XXI: Results of PET1 nodal analysis - qualitative description ... 59
Table XXII: Results of PET1 nodal analysis - quantitative description ... 60
Figures
Figure 1 : Screen captures with LIFEx® software of one breast tumor, in PET0 and PET1... 21Figure 2 : Flow chart of studied population ... 23
Figure 3 : Example of Axial Fusion PET/CT views, Axial PET views and MIP views (right column) of one of our studied patients’ exams. ... 31
11
Liste des abréviations
5-FU: 5-Fluorouracil
CEA: Commissariat à l’Energie Atomique CMR: Complete Metabolic Response CR: Complete Response
DICOM: Digital Imaging and Communications in Medicine EANM: European Association of Nuclear Medicine
18FDG: 18F-fluorodéoxyglucose
FEC 100: 5-Fluorouracil (5-FU): 500 mg/m2, Epirubicin: 100 mg/m2 and Cyclophosphamide:
500 mg/m2
g: grams
HR: Hormonal Receptors
HER2: Human epidermal growth factor Receptor 2 HER+: overexpressing HER2 tumours
HGZE: High Grey-level Zone Emphasis IHC: Immunohistochemistry
INCa: Institut National du Cancer IV: intravenous/intravenously
LIFEx®: Local Image Features Extraction® LGZE: Low Grey-level Zone Emphasis LRE: Long Run Emphasis
MBq/Kg : Megabecquerels per kilograms MIP: Maximum Intensity Projection mL: milliliters
MRI: Magnetic Resonance Imaging MV: Metabolic Volume
NeoTOP: Neoadjuvant phase II trial combining [3 FEC 100 followed by 3 docetaxel associated with trastuzumab plus pertuzumab] or [6 docetaxel, carboplatin associated with trastuzumab plus pertuzumab] according to TOP2A status in patients with operable, HER2-positive breast cancer
OR: Oestrogen Receptor
PCA: Principal Component Analysis pCR: pathological Complete Response PD: Progression Disease
PMD: Progression Metabolic Disease PMR: Partial Metabolic Response PR: Partial Response
PR: Progesterone Receptor q3w: each three weeks ROI: region of interest SD: Stable Disease
SFMN: Société Française de Médecine Nucléaire SMD: Stable Metabolic Disease
SUL: Lean body mass corrected SUV SUL max: Maximum value of SUL in a ROI SUL mean: Average value of SUL in a ROI
12
SUL peak: Average value of SUL in a 1 cm³ sphere centred on the voxel corresponding to SUL max in a ROI
SUV: Standard Uptake Value
SUV max: Maximum value of SUV in a ROI SUV mean: Average value of SUV in a ROI
SUV peak: Average value of SUV in a 1 cm³ sphere centred on the voxel corresponding to SUV max in a ROI
SRE: Short Run Emphasis
PET/CT: Positon Emission Tomography/Computed Tomodensitometry TLG: Total Lesion Glycolysis
TN: Triple Negative
TOP2A: Topoisomerase 2-alpha WHO: World Health Organization
13
1. Introduction
Breast cancers have the highest incidence and mortality rates among women’s solid malignant diseases. In France, between 1990 and 2018, its incidence is still increasing (more than 58000 new cases during that period), despite a high but decreasing mortality rate (12 004 death), probably due to a better organized screening during last decades(1).
Nowadays, its treatment is based on a multidisciplinary management, which can include surgery, medical oncology and radiation therapy, depending on breast cancer staging(2). This initial staging include TNM classification, updated in 2017 by the American Cancer Society(3) (reported in Annexe 1). Moreover, pathological tumours markers as Oestrogen Receptor (OR), Progesterone Receptor (PR), Human epidermal growth factor Receptor 2 (HER2) and proliferation rate (Ki67) are used to staging tumour aggressiveness, and can leading to a personalized management of breast cancer treatment, including endocrine therapy and/or HER2-directed Therapy(2).
Within the different kind of imaging modalities used in the management of breast cancer
treatment, 18F-fluorodeoxyglucose Positon Emission Tomography/Computed
Tomodensitometry (18FDG PET/CT) takes a more and more important place. Indeed, numerous
studies had demonstrated the superiority of this exam’s performance, regarding extra-axillar nodal staging, and detection of bone and visceral metastasis (excepted for brain)(4). Moreover, the prognostic value of initial staging by 18FDG PET(4) and its performance in
diagnosis of breast cancer relapse(4) had been highly validated.
French recommendations of the Institut National du Cancer (INCa) define it as an option in first intention initial staging for cT3-T4 and cN+ breast cancer, or after surgery, in case of macrometastatic lymph node disease(5). In 2018, it is recommended by the Société Française de Médecine Nucléaire (SFMN) for the initial staging of breast tumours clinically superior to
14
IIB stage, preferably before surgery, and can be proposed for the initial staging of breast tumours with a IIA clinical stage (T1N1 or T2N0), also preferably before surgery(6). It is recommended in case of suspected breast cancer relapse and in the restaging of proven breast cancer relapse(6). It can be proposed for the evaluation of systemic treatments in metastatic disease (particularly concerning bone metastasis)(6), and for the early evaluation of therapeutic response to neoadjuvant treatment, particularly for Triple Negative(TN) and HER2 overexpressing (HER2+) tumours(6). By the way, its predictive value of pathological response concerning this last indication remains uncertain. As well, even whether textural analysis of
18FDG PET/CT has been evaluated for predicting the histological tumour type of breast cancer
in some studies(7), only few analysed its ability to predict the pathological response to neoadjuvant therapy.
The main objective of this work was to determine the value of 18FDG PET/CT for evaluation of
disease staging and for prediction of early therapeutic response in neoadjuvant chemotherapy setting. Analysis were performed both by visual and conventional quantitative methods. The secondary objective of this study was to analyse tumoral 18FDG PET/CT textural features
15
2. Method
2.1. Population
Studied population was extracted from the multicentric phase II trial NeoTOP (Neoadjuvant phase II trial combining [3 FEC 100 followed by 3 docetaxel associated with Trastuzumab plus Pertuzumab] or [6 Docetaxel, Carboplatin associated with Trastuzumab plus Pertuzumab] according to TOP2A status in patients with operable, HER2-positive breast cancer), promoted by Unicancer, whose rational was built by Clermont-Ferrand team, and whose final intent was to include 90 patients. Patients included was women over 18, and had a histologically confirmed breast cancer, with a clinical tumour superior to 1 cm (cT1c, cT2-3 or cT4a), any N status, and no clinically or radiologically detectable metastases (M0). Hormonal tumour receptors for T1c status were negative (both Oestrogen Receptor (OR) and Progesterone Receptor (PR) < 10% by Immunohistochemistry (IHC)), otherwise negative or positive. All tumours were HER2+ (i.e. IHC score 3+ or FISH/SISH/CISH positive). Performance status was ≤ 1 (according to World Health Organization (WHO) criteria). Hematologic, hepatic, renal and ionic patients’ biology were normal at inclusion date. Cardiac ejection fraction, measured by MUGA or echography, was necessary superior to 50% within four weeks before inclusion. All patients agreed to use effective contraception during and for more than seven months after completion of study treatment. Finally, patients had to be able to comply with the protocol, must have signed a written informed consent form prior to any study specific procedures and must be affiliated to a Social Health Insurance.
Patients with bilateral or multifocal breast cancer, non-measurable tumour, inflammatory and/or overlooked forms (T4b or T4d) cancer, HER2- (i.e. IHC score 0 or 1+, or IHC score 2+ and FISH/SISH/CISH negative) or RH positive (OR or PR ≥ 10% by IHC) for T1c status were not included. Whether patients had a history of second cancer, including breast cancer, they were
16
not included, with exception of in situ cervical cancer or basocellular skin cancer which was regarded as cured. Pregnant women, women who was likely to become pregnant or was breast-feeding were not included. Patients with uncontrolled heart disease and for whom anthracyclines was contraindicated were not included.
Our population was included from January 12th of 2015 to December 3rd of 2018, and we collected data of the first scheduled interim analysis of NeoTOP trial.
2.2. Treatment
Patients were treated by six cycles of neoadjuvant chemotherapy, before undergoing mammary surgery. The therapeutic scheme was depending on the genetic Topoisomerase 2-alpha (TOP2A) amplification state.
Whether TOP2A was amplified, patients were treated with three cycles of FEC 100 (5-Fluorouracil (5-FU): 500 mg/m2, Epirubicin: 100 mg/m2 and Cyclophosphamide: 500 mg/m2),
administered intravenously (IV) each three weeks (q3w), followed by three cycles of Trastuzumab-Pertuzumab-Docetaxel (Trastuzumab 8 mg/kg loading dose administered intravenously (IV), followed by 6 mg/kg IV q3w in subsequent cycles ; Pertuzumab 840 mg loading dose administered IV followed by 420 mg IV q3w in subsequent cycles ; Docetaxel 75 mg/m2 IV escalading at 100 mg/m2 IV as tolerated, q3w).
Whether TOP2A was not amplified, patients were treated with TCHP, administered IV q3w for six cycles (Trastuzumab 8 mg/kg loading dose administered IV followed by 6 mg/kg IV q3w in subsequent cycles; Pertuzumab 840 mg loading dose administered IV followed by 420 mg IV q3w in subsequent cycles; Docetaxel 75 mg/m2 IV q3w; Carboplatin AUC 6 IV q3w).
Mammary surgery was performed within 28 days after completion of neoadjuvant treatment. If isotopic sentinel lymph node detection was performed during surgery, we noted it.
17
2.3. Clinical and Pathological Assessment
At baseline, clinical evaluations of tumoral and nodal involvement were fulfilled during four weeks before first cure of neoadjuvant therapy. Pathological results of biopsy were gathered, including tumour type and OR, PR and HER2 status.
Pathological response was scored on surgical sample according to Chevallier classification(8), whose pathological Complete Response (pCR) was corresponding to grades 1 (no residual tumour cell) and 2 (residual in situ carcinoma). Non-responders group corresponded to grades 3 (invasive carcinoma with stromal alterations, such as sclerosis or fibrosis) and 4 (no or few alterations in tumour appearance) of Chevallier classification. Whether an axillary lymph node dissection was performed during the surgery, the number of resected lymph nodes, tumour involved lymph nodes and carcinoma nodules were recorded.
2.4. 18FDG PET/CT Imaging
Imaging acquisition
Two 18FDG PET/CT exams were performed during neoadjuvant chemotherapy, one within
seven days before starting treatment (baseline PET: PET0), the second 21 +/-3 days after the first cycle of chemotherapy (interim PET: PET1). Patients were instructed to fast and not consume beverages, except water, for at least four to six hours before administration of
18FDG. Oral hydration was encouraged. Blood glucose level was measured before 18FDG
administration. Patient was rescheduled whether the glycaemia was greater than 11 mmol/L. Two to five MBq/Kg of 18FDG was administrated, IV, for each 18FDG PET/CT exam.
For PET0, a “whole body” standard acquisition was performed 60 min after injection. A dedicated mammary acquisition was followed exactly 90 minutes after tracer injection: two
18
beds of 5 min each with patient in prone position were acquired, centred on the mammary area.
For PET1, only a dedicated mammary acquisition was realized as same method described for PET 0.
Cross calibrations of all PET/CT devices and 18FDG PET/CT acquisitions was performed
according to guidelines of the European Association of Nuclear Medicine (EANM).
Whole body staging analysis
Whole body acquisition was analysed on Advantage Window Server 3.2 software (GE Healtcare®), to determine the metastatic staging. Uptake foci were considered as abnormal when their intensities were superior to liver uptake for lesions size superior to 1 cm or superior to vascular background for lesions inferior to 1 cm. Their localisations were recorded and a visual analysis was realized, staging these lesions in four categories:
- 0: no uptake
- 1: low uptake, inferior to liver background - 2: moderate uptake, higher to liver background - 3: high uptake
This visual staging was completed by a quantitative analysis, with measurement of SUV max, for suspected metastatic lesions.
Regional analysis of breast acquisition by conventional method: staging and metabolic response assessment
Conventional analysis of mammary acquisitions was also performed on Advantage Window Server 3.2 software.
19
Breast tumours localisations were collected and lesions were pooled in four categories, according to their visual uptake, in the same way as described for metastatic lesions.
Regional lymph nodes regions (ipsilateral axillary, intramammary and internal mammary chains) was visually analysed, and patients were sorted in two groups, according to absence or presence of lymph nodes uptakes suspicious of nodal disease.
For each breast and lymphonode uptake suspicious of tumour disease, we measured several parameters. Maximum Standard Uptake Value (SUV max)(9) was determined after automatic segmentation centred on the voxel with the highest intensity. SUV peak was the average uptake determined in a circular region of interest (1.2 cm in diameter) drawn automatically around SUV max voxel.
Moreover, three different tumoral 18FDG mean uptakes were calculated: two based on
growing region methods over 40% and 30% of the maximal intensity, respectively called SUV mean40% and SUV mean30%, and one by manual segmentation, named SUV meanMan. For each SUV parameters, equivalent standardized patient lean mass (instead of weight), corresponding to SUL values(9), were also calculated.
The lesion with highest SUL peak on PET0 was considered as the main target for the evaluation, according to PERCIST criteria(10) .
All quantitative parameters were expressed in g/mL.
Finally, assessment of early metabolic response to chemotherapy was evaluated by comparison of PET0 and PET1 imaging in three ways:
- visual reading, scored as Progression Disease (PD), Stable Disease (SD), Partial Response (PR) and Complete Response (CR),
20
- quantitative analysis according to PERCIST criteria (variation of SUL Peak), scored as Progression Metabolic Disease (PMD), Stable Metabolic Disease (SMD), Partial Metabolic Response (PMR) and Complete Metabolic Response (CMR),
- variation of SUV and SUL values, according to pCR or not-pCR groups.
Textural Analysis of breast tumours
Textural analysis of mammary acquisitions was performed with Local Image Features Extraction (LIFEx)® software(11), whose associated intellectual property rights is held by the Commissariat à l’Energie Atomique (CEA).
On PET0 breast tumoral uptakes, a first ROI was drawn, by automatic segmentation defined at 40% of SUV max, named T40%. In an exploratory aim, we also analysed the peritumoral area, in a 5 mm thick region surrounding T40%, automatically drawn, named T40%Ring. With the purpose of performing a comparison between centres, we drew a spherical ROI of 10 cm3
in the contralateral breast, named Contralat.
The same technic was applied to create ROI of residual tumours on PET1. Moreover, ROI corresponding to PET0 was manually placed on PET1 exam, when it was possible, for analysing textural parameters’ variation in initial studied anatomic zones. These ROI were named T40%Repro and T40%ReproRing. Examples of each tumoral ROI drawn for textural analysis are illustrated with Figure 1. All ROI was resampled with voxels of 2 x 2 x 2 mm, and an absolute discretization of intensity in 128 grey levels, with a SUV max discretization fixed between 0 and 40 g/mL, was performed. Textural analysis wasn’t performed if ROI volume was lower than 64 voxels, of if more than one Cluster was detected inside. Measurements of 15 first order (conventional) and 31 second order (textural) parameters were available on LIFEx®. In a synthetic purpose, we focused our analysis on 5 conventional indices and 6 textural indices,
21
known for their robustness(12)(13). Conventional indices measured were SUV max, SUV mean, SUV peak, Metabolic Volume (MV) and Total Lesion Glycolysis (TLG), which is defined with the following formula:
TGL = MV ∗ SUV mean
Textural indices measured were Homogeneity, Entropy, Short Run Emphasis (SRE), Long Run Emphasis (LRE), Low Grey-level Zone Emphasis (LGZE) and High Grey-level Zone Emphasis (HGZE). Inside a ROI, Homogeneity represents the uniformity of voxels’ intensity repartition, whereas Entropy corresponds to its randomness. SRE and LRE give information about fields of homogeneous intensity, respectively in a short area or in a long area. LGZE and HGZE bring information about respectively low grey-level and high grey level voxels’ intensity repartition. Variations of conventional and textural parameters between PET0 and PET1 were expressed in percentage.
Figure 1 : Screen captures with LIFEx® software of one breast tumour, in PET0 and PET1.
A: Fusion PET/CT view of breast tumour on PET0.
B: Fusion PET/CT view of breast tumour on PET0, with coloured automatic ROI: T40% (pink) and T40%Ring (green). C: Fusion PET/CT view of breast tumour on PET1.
D: Fusion PET/CT view of breast tumour on PET1, with coloured automatic ROI: T40% (pink) and T40%Ring (blue).
E: Fusion PET/CT view of breast tumour on PET1, with coloured automatic ROI an manually placed PET0 ROI: T40% (blue), T40%Ring
(yellow), T40%Repro (pink) et T40% RingRepro (green). Due to a low uptake on PET1, automatic segmented volumes are wider than PET0 ones. A B C D E
22
2.5. Statistical Analyses
Statistical analyses were performed with R® software. Exact Fisher Test was used to detect dependence between pCR and qualitative variables: Visual response and PERCIST response. For conventional measures, Wilcoxon Mann Whitney Test was used to detect dependence between pCR and quantitative variables, concerning their initial values and variations between PET0 and PET1.
Regarding Textural Analysis, a t Student Test was performed if variables had a normal distribution. When variances were not equal between groups, a t Welsh Test was used. If observed data had not a normal distribution, a non-parametric Wilcoxon Mann Whitney Test (U test) was performed.
We performed a Principal Component Analysis (PCA) to detect a centre effect concerning quantitative variables of tumoral lesions measured in conventional analysis, and to study the correlation between them (details in Annexe 4). We also performed a PCA on the textural analysis of contralateral breast, to detect a centre effect in that kind of ROI, which was supposed to be more reproducible between patients (details in Annexe 5).
23
3. Results
3.1. Population
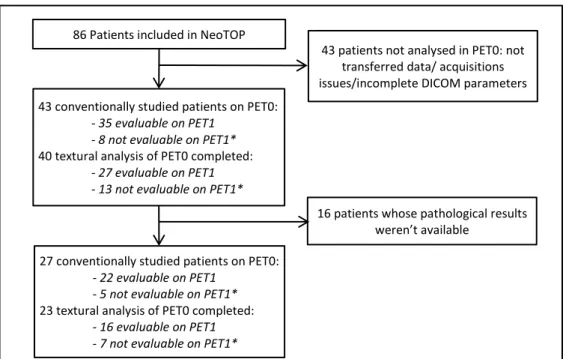
86 patients were included in NeoTOP trial at the time of our study. 43 PET0 exams were conventionally studied, among which 40 exams were analysable for textural parameters. Results and mean values of quantitative parameters of this first screening are reported in Annexes 2 and 3. 43 patients were not analysable for PET0 for this work, because of not transferred data, acquisitions issues or incomplete DICOM (Digital Imaging and Communications in Medicine) parameters. Pathological results were available for 27 studied patients, whose formed our effective population, and 23 of them were analysable for textural parameters. Among them, 22 were evaluable conventionally on PET1, and 16 were evaluable by texture analysis on PET1. Absence of revaluation on PET1 was also induced by technical acquisition issues, lack of data transfer, or incomplete DICOM parameters. Figure 2 summarizes the flow chart of our study.
86 Patients included in NeoTOP
43 conventionally studied patients on PET0:
- 35 evaluable on PET1 - 8 not evaluable on PET1*
40 textural analysis of PET0 completed:
- 27 evaluable on PET1 - 13 not evaluable on PET1*
27 conventionally studied patients on PET0:
- 22 evaluable on PET1 - 5 not evaluable on PET1*
23 textural analysis of PET0 completed:
- 16 evaluable on PET1 - 7 not evaluable on PET1*
43 patients not analysed in PET0: not transferred data/ acquisitions issues/incomplete DICOM parameters
16 patients whose pathological results weren’t available
Figure 2 : Flow chart of studied population
*: Some PET1 exams were not evaluable for the same ones than for PET0: transferred data/acquisitions issues/incomplete DICOM parameters
24
Our effective population was 53 years old (39-74), with a similar proportion of menopaused and not menopaused women. PET exams were acquired in eight centres. The histological type was ductal most of tumours: 24 patients (88,9%). None patient was presenting a lobular tumour. 15 patients (55,6%) had tumours with negative hormonal receptors. None of patients presented focal uptakes suspected of metastatic disease on PET 0 whole body acquisition. Chevallier classification was known for 25 patients in our database.
Characteristics of our population are summarized on Table I.
Anthropometric values Moy (N=27) Min-Max
Age (years) 53 39-74 Weight (kg) 62,7 40-91 Height (cm) 160,6 146-172 Menopausal state N % Menopaused 14 51,9 Not menopaused 13 48,1 Total 27 100 PET Center N % Clermont-Ferrand 8 29,6 Montpellier 6 22,2 Angers 3 11,1 Limoges 3 11,1 Saint-Herblain 3 11,1 Strasbourg 4 14,8 Total 27 100
Histological tumoral type N %
Ductal 24 88,9
Micropapillary breast cancer 1 03,7 Invasive Carcinoma 2 07,4
Total 27 100
Tumoral Hormonal Receptors N %
OR - and PR - 15 55,6 OR + and PR + 11 40,7 OR + and PR - 1 03,7
Total 27 100
Table I : Population characteristics
3.2. Value of 18FDG PET/CT for locoregional staging: Analysis by conventional and
textural methods
On PET0, 21 patients (81%) presented a tumour with high uptake; visual grade 3, and 4 patients’ tumours (16%) had a moderate uptake, visual grade 2. None of patients presented tumours with low or absent uptake. Three patients had two suspicious focal uptakes in the
25
same breast. The average of tumoral SUV max of our population was 12,87+/-7,85 g/mL. The PCA performed on breast tumoral lesions did not evidence a centre effect concerning conventional quantitative tumoral parameters, and all of them was highly correlated (minimum 0,89). Synthetic schemes of that PCA are reported in Annexe 4.
Concerning first order measured parameters, average of tumours’ TLG, automatically segmented at 40% of SUV max, was 37,04+/-45,16, average of SUV max of peritumoral zones (T40%Ring) was 7,57+/-4,93 g/mL, and average TLG of peritumoral zones was 30,07+/-23,17 mL. SUV Peak was not measurable for T40%Ring ROI. Concerning second order parameters of tumoral lesions, we found higher values of Entropy, LRE and HGZE than Homogeneity, SRE and LGZE ones on PET0. Moreover, PCA performed on Contralateral breast showed a correlation between SUV max, SUV peak, SUV mean, TLG, Entropy, SRE and HGZE. Most of these parameters had a reverse correlation with LRE and Homogeneity, and some of them with LGZE. By the way, the PCA also showed a significant centre effect existing in our textural measurement (p = 0.0286).
Among the 27 patients of our final population, 15 showed regional lymphnode uptakes suspected of malignancy on PET0, which quantitative characteristics are reported in Annexe 6, due to their low number.
20 patients (74,1%) were clinically staged N0, and among them, 11 had suspicious regional nodal uptakes on PET0. Six of the seven patients classed as clinical N1 showed suspicious regional nodal uptakes. In total, a discordance between PET and clinical regional nodal staging was present for 10 patients (37%).
Axillary lymph node clearance was not performed for 15 patients. Isotopic sentinel lymph node detection during surgery was realized for 13 of them. Among this group, five patients had suspicious nodal uptakes on PET0, whose one staged cN1 and four staged cN0 at baseline,
26
and eight patients was staged N0 on PET0, whose one staged cN1 and seven staged cN0 at baseline. Two patients did not underdo axillary clearance or isotopic sentinel lymph node detection, and these two did not showed suspicious lymph nodes uptakes on PET0 and was staged cN0 at baseline.
Twelve patients underwent an axillary lymph node clearance, and among them, only two had a pathological nodal involvement on surgical sample. Both had suspicious lymph nodes uptakes on PET0, one of them staged cN1 and the second one cN0 at baseline. Eight clearance did not demonstrate pathological nodal involvement. Two of them was staged N0 with PET0 and clinical baseline staging, and six had suspicious nodal uptakes in PET0: two staged cN0 and four staged cN1 at baseline. Pathological nodal involvement was unknown for two patient cases who had an axillary lymph node clearance. Numbers, average values, and known pathological state of PET0 lymph nodes analysis are reported in Annexe 6.
3.3. Prediction of pathological response by 18FDG PET/CT: Analysis by
conventional and textural methods Predictive value of initial PET
18 patients (72%) were considered in pCR according to Chevallier classification (Grades 1+2) and seven patients (28%) were considered as no responders (Grade 3). None of patients was classified as Grade 4 of Chevallier. Two of patients presenting two suspicious foci uptakes in the same breast were Grade 1, and the third was Grade 3.
There was not significant statistical difference between responders and no responders, concerning initial values of conventional and textural PET0 parameters, as well for tumoral ROI than T40%Ring ROI (p>0,2 for all of them).
27
Numbers, averages values and statistics corresponding to PET0 are reported in Table II. In order to avoid redundancies, SUV max, SUV mean and SUV peak measured with LIFEx® for T40% ROI are not reported.
There was not significant difference between Grade 1 of Chevallier group and others patients concerning conventional and textural quantitative parameters analysis on PET0. Same results were obtained with comparison of our three groups: Grade 1 vs Grade 2 vs Grade 3. Results of these complementary analyses are reported in Annexe 6.
Table II: Results of conventional and texture analysis of PET0, depending on pathological complete response
Total pCR No pCR Statistics Visual Analysis N % N % N % - 0 0 0 0 0 0 0 - 1 0 0 0 0 0 0 2 4 16 3 12 1 4 3 21 81 15 60 6 24 Total 25 100 18 72 7 28
SUV (g/mL) N Moy Σ N Moy Σ N Moy Σ P IC95%
Max 25 12.87 7.85 18 12.34 7.58 7 14.23 8.99 0.701 (-7.54 – 4.5) Peak 24 8.49 5.58 17 8.32 6.09 7 8.90 4.47 0.576 (-5.57 – 3.13) Mean40% 24 8.00 4.79 17 7.85 4.96 7 8.35 4.71 0.757 (-4.47 – 3.35) Mean30% 25 6.70 4.31 18 6.46 4.47 7 7.30 4.14 0.534 (-4.09 – 2.45) MeanMan 25 3.91 2.13 18 3.94 2.34 7 3.84 1.59 0.883 (-1.69 – 1.67)
SUL(g/mL) N Moy Σ N Moy Σ N Moy Σ p IC95%
Max 25 8.97 4.79 18 8.80 2.34 7 9.41 4.64 0.790 (-4.42 – 3.47) Peak 24 5.90 3.51 17 5.88 4.97 7 5.97 2.53 0.664 (-3.11 – 2.67) Mean40% 24 5.54 2.93 17 5.54 3.91 7 5.55 2.45 0.901 (-2.83 – 2.57) Mean30% 25 4.71 2.72 18 4.66 3.18 7 4.85 2.17 0.762 (-2.64 – 2.24) MeanMan 25 2.72 1.32 18 2.78 1.49 7 2.57 0.76 0.976 (-1.02 – 1.31)
Texture 1st order N Moy Σ N Moy σ N Moy Σ p IC95%
T40% TLG 22 37.04 45.16 16 39.02 52.08 6 31.77 19.57 0.641 (-29 – 32.8) MV (mL) 22 4.21 2.84 16 4.22 3.03 6 4.18 2.54 0.978 (-2.87 – 2.95) T40% Ring SUV mean 23 2.27 1.20 17 2.15 1.00 6 2.61 1.71 0.806 (-1.61 – 1.02) SUV max 23 7.57 4.93 17 7.07 4.67 6 8.99 5.82 0.392 (-6.84 – 3.41) TLG 23 30.07 23.17 17 28.51 24.64 6 34.51 19.70 0.293 (-28.28 – 13) MV (mL) 23 12.62 6.50 17 12.22 6.90 6 13.73 5.61 0.636 (-8.04 – 5.03)
Texture 2nd order N Moy Σ N Moy σ N Moy Σ p IC95%
T40% Homogeneity 17 0.31 0.12 11 0.33 0.14 6 0.29 0.09 0.733 (-0.1 – 0.16) Entropy 17 2.32 0.42 11 2.31 0.49 6 2.33 0.27 0.928 (-0.48 – 0.45) SRE 17 0.95 0.04 11 0.94 0.05 6 0.96 0.02 0.481 (-0.06 – 0.03) LRE 17 1.30 0.34 11 1.35 0.41 6 1.20 0.13 0.513 (-0.16 – 0.36) LGZE 17 0.01 0.01 11 0.01 0.02 6 0.00 0.00 0.884 (0 – 0.01) HGZE 17 1042.42 1199.12 11 1110.99 1324.69 6 916.69 1030.72 0.961 (-640 – 1409.84) T40% Ring Homogeneity 23 0.46 0.14 17 0.47 0.15 6 0.42 0.13 0.464 (-0.09 – 0.19) Entropy 23 1.97 0.51 17 1.92 0.53 6 2.12 0.46 0.422 (-0.71 – 0.31) SRE 23 0.89 0.07 17 0.89 0.07 6 0.91 0.04 0.806 (-0.08 – 0.05) LRE 23 1.85 0.67 17 1.91 0.75 6 1.69 0.40 0.944 (-0.46 – 0.88) LGZE 23 0.04 0.04 17 0.05 0.05 6 0.02 0.02 0.421 (0 – 0.05) HGZE 23 177.43 157.36 17 160.46 139.94 6 225.51 206.25 0.392 (-192.4 – 90.5)
28
Predictive value of interim PET
Metabolic evaluation on PET1 was performed for 21 patients.
In PET visual analysis, three patients (14,3%) was in CR, 17 (81,0%) was in PR and one of them (4,8%) showed a SD. None was visually progressing in PET1 evaluation. There was not significant difference between pathological responders and no responders concerning our visual analysis (p=1). Both patient with two suspicious breast uptakes on PET0 was in partial metabolic response on PET1 and Grade 1 of Chevallier, and the third wasn’t evaluable on PET1. All quantitative conventional parameters measured on tumoral ROI decreased between PET0 and PET1, with an average of -55+/-18% concerning SUV max. Whatever studying parameters, tumoral 18FDG decrease was similar in Chevallier defined response group (p>0,5 for all of
them).
PERCIST evaluation could be performed on 20 patients and classified one (5%) in complete metabolic response, eight (40%) in partial metabolic response, 10 in stable metabolic disease (50%) and one (5%) in progression disease. One patient could not be evaluated with PERCIST method, due to parameters issues in PET1 data (SUL peak not calculable). There was not significant difference between pathological responders and no responders concerning PERCIST evaluation (p=1). Numbers, averages values and statistics corresponding to conventional PET evaluation are reported in Table III.
Textural evaluation on PET1 exams could be performed on 13 patients’ exams. Most of first order parameters decreased between PET0 and PET1, excepting some metabolic volumes, which increased: 07,06+/-107,83% for T40%, 39,25+/-122,73% for T40%Ring, 14,76+/-28,02% for T40%Repro. TLG of lesions decreased of 65,89+/-20,25% with automatic segmentation and 67,01+/-14,08% with manual placement of initial ROI. TLG of peritumoral zone decreased of
29
24,84+/-64,39% with automatic segmentation and 53,36+/-11,27% with manual replacement of initial ROI.
Concerning second order textural parameters, we showed an increase of Homogeneity, LRE and LGZE, meanwhile Entropy, SRE and HGZE decreased, as well for tumoral than peritumoral region, and both for automatic segmentation and manually replacement methods, assessing a decrease of tumoral heterogeneity as well as uptake, due to first cure of chemotherapy. By the way, none textural parameters’ variation was significantly different between pCR and no pCR groups (p>0,2 for all of them). Numbers, averages values and statistics corresponding to textural evaluation are reported in Table IV.As well as for PET0 results, SUV max, SUV mean and SUV peak measured with LIFEx® for T40% ROI aren’t reported.
There was not significant difference between Grade 1 of Chevallier group and others patients concerning visual, PERCIST, conventional quantitative or textural metabolic evaluations on
Total pCR No pCR Statistics Visual analysis N % N % N % p CR 3 14,3 3 14,3 0 0,0 1 PR 17 81,0 13 62,9 4 19,0 SD 1 4,8 1 4,8 0 0,0 PD 0 0 0 0 0 0,0 Total 21 100 17 81,0 4 19,0
ΔSUV N Moy (%) σ N Moy (%) Σ N Moy (%) σ p IC95% Max 19 -55 18 15 -54 18 4 -60 16 0.578 (-0.27 – 0.16)
Peak 18 -54 16 14 -53 17 4 -57 14 0.639 (-0.24 – 0.16)
Mean40% 16 -57 16 12 -56 16 4 -60 18 0.678 (-0.24 – 0.17)
Mean30% 13 -55 15 10 -55 17 3 -53 07 0.843 (-0.21 – 0.26)
MeanMan 21 -49 21 17 -49 24 4 -48 07 0.977 (-0.25 – 0.26)
ΔSUL N Moy (%) σ N Moy (%) Σ N Moy (%) σ p IC95% Max 19 -55 18 15 -54 18 4 -60 16 0.544 (-0.27 – 0.15) Peak 18 -54 16 14 -53 17 4 -58 14 0.574 (-0.25 – 0.15) Mean40% 16 -57 16 12 -55 17 4 -60 18 0.613 (-0.25 – 0.16) Mean30% 13 -55 17 10 -56 19 3 -54 09 0.897 (-0.23 – 0.26) MeanMan 20 -43 18 16 -41 20 4 -49 07 0.437 (-0.29 – 0.13) PERCIST N % N % N % p CMR 1 5 1 5 0 0 1 PMR 8 40 4 20 4 20 SMD 10 50 10 50 0 0 PD 1 5 1 5 0 0 Total 20 100 16 80 4 20
30
PET1. It was the same for the comparison of conventionnal parameters of our three groups: Grade 1 vs Grade 2 vs Grade 3. Results of these complementary analysis are reported in Annexe 7.
Table IV : Results of textural metabolic evaluation on PET1, depending on pathological complete response
In a synthesis purpose, and due to their low numbers, lymphnode regional metabolic evaluations are not detailed here (reported in Annexe 7). By the way, we can note that the
Total pCR No pCR Statistics
ΔTexture 1st ordre N Moy (%) σ N Moy (%) σ N Moy (%) σ p IC95%
T40% TLG 12 -65.89 20.25 8 -66.20 24.98 4 -65.27 6.78 0.924 (-22.41 – 20.56) Volume 12 07.06 107.83 8 03.00 133.53 4 -27.17 14.89 0.799 (-53.59 – 338.43) T40% Ring SUV Mean 15 -44.84 18.22 10 -42.84 22.09 5 -48.85 5.83 0.437 (-10.36 – 22.39) SUV Max 15 -54.89 17.33 10 -53.97 20.93 5 -56.75 7.70 0.513 (-14.38 – 10.34) TLG 15 -24.84 64.39 10 -25.57 59.28 5 -23.37 81.25 0.768 (-77.9 – 64.31) Volume 15 39.25 122.73 10 31.24 99.18 5 55.28 173.49 0.953 (-216.58 – 161.7) T40% Repro SUV Mean 10 -70.42 13.45 5 -72.63 17.14 5 -68.21 10.05 0.632 (-24.91 – 16.08) SUV Max 10 -58.83 20.28 5 -56.65 27.54 5 -61.01 12.47 0.841 (-20.12 – 49.59) SUVPeak 0,5mL 6 -61.00 25.28 4 -63.86 31.94 2 -55.28 5.96 0.740 (-75.48 – 58.32) SUVPeak 1mL 5 -56.50 20.56 3 -56.28 28.85 2 -56.85 4.97 0.981 (-68.37 – 69.52) TLG 10 -67.01 14.08 5 -70.67 16.82 5 -63.34 11.38 0.443 (-28.27 – 13.62) Volume 10 14.76 28.02 5 12.87 36.00 5 16.64 21.50 0.846 (-47.01 – 39.47) T40% Ring Repro SUV Mean 11 -52.12 11.29 6 -53.14 15.30 5 -50.89 4.76 0.745 (-18.31 – 13.82) SUV Max 11 -40.16 27.17 6 -37.82 34.31 5 -42.98 18.85 0.772 (-33.87 – 44.19) TLG 11 -53.36 11.27 6 -53.79 15.47 5 -52.86 4.25 0.893 (-17.14 – 15.28) Volume 11 -02.27 06.91 6 -0.94 8.81 5 -3.86 4.09 0.515 (-6.81 – 12.65)
ΔTexture 2nd ordre N Moy (%) σ N Moy (%) σ N Moy (%) σ p IC95%
T40% Homogeneity 10 48.16 31.70 6 54.87 40.35 4 38.10 8.76 0.365 (-25.5 – 59.04) Entropy log10 10 -24.80 14.81 6 -27.06 18.01 4 -21.39 9.59 0.762 (-33.84 – 13.99) SRE 10 -08.13 13.39 6 -10.49 17.29 4 -4.59 3.39 0.914 (-38.3 – 5.6) LRE 10 71.99 158.90 6 101.82 205.99 4 27.25 24.13 0.990 (-42.64 – 478.19) LGZE 10 485.75 319.40 6 485.97 331.88 4 485.42 349.97 0.998 (-503.71 – 504.82) HGZE 10 -74.24 10.07 6 -72.98 24.81 4 -76.12 7.55 0.610 (-18.38 – 45.28) T40% Ring Homogeneity 15 45.15 21.91 10 45.34 26.58 5 44.76 9.46 0.964 (-26.32 – 27.48) Entropy log10 15 -33.73 14.80 10 -34.04 16.64 5 -33.12 11.99 0.915 (-19.09 – 17.25) SRE 15 -15.83 14.77 10 -15.56 15.72 5 -16.37 14.37 0.859 (-14.01 – 19.16) LRE 15 111.29 144.62 10 109.31 161.26 5 115.24 121.08 0.679 (-190.43 – 81.01) LGZE 15 482.78 395.15 10 397.79 288.95 5 652.77 551.79 0.253 (-715.52 – 205.57) HGZE 15 -68.28 20.25 10 -66.26 24.18 5 -72.34 9.38 0.859 (-12.94 – 26.17) T40% Repro Homogeneity 10 77.70 62.88 5 95.89 77.85 5 59.52 44.80 0.392 (-56.26 – 129.01) Entropy log10 10 -24.79 17.85 5 -30.64 22.28 5 -18.93 11.63 0.328 (-37.62 – 14.2) SRE 10 -11.52 13.40 5 -16.07 18.33 5 -6.97 4.08 0.841 (-37.78 – 8.17) LRE 10 87.30 127.34 5 132.67 174.68 5 41.93 28.72 0.548 (-49.1 – 381.33) LGZE 10 2508.36 2141.76 5 2937.59 2798.79 5 2079.14 1423.83 0.990 (-1975.22 – 6169.25) HGZE 10 -82.70 11.75 5 -82.89 15.53 5 -82.51 8.32 0.963 (-18.54 – 17.79) T40% Ring Repro Homogeneity 11 61.33 28.37 6 65.43 36.54 5 56.41 16.96 0.626 (-31.37 – 49.41) Entropy log10 11 -33.34 12.55 6 -34.08 15.59 5 -32.45 9.37 0.844 (-19.69 – 16.45) SRE 11 -20.96 12.10 6 -22.39 15.11 5 -19.24 8.60 0.69 (-20.46 – 14.16) LRE 11 136.75 81.06 6 151.10 101.99 5 119.53 52.40 0.549 (-83.02 – 146.17) LGZE 11 516.55 476.84 6 557.66 516.68 5 467.21 478.73 0.772 (-594.68 – 775.57) HGZE 11 -60.55 27.15 6 -57.58 35.41 5 -64.11 15.71 0.713 (-32.36 – 45.42)
31
only patient classed in stable metabolic disease concerning her nodal involvement on PET1, and which presented an unusual high uptake on PET0 (SUV max = 39,76 g/mL), had a pathological nodal involvement diagnosed on her axillary clearance.
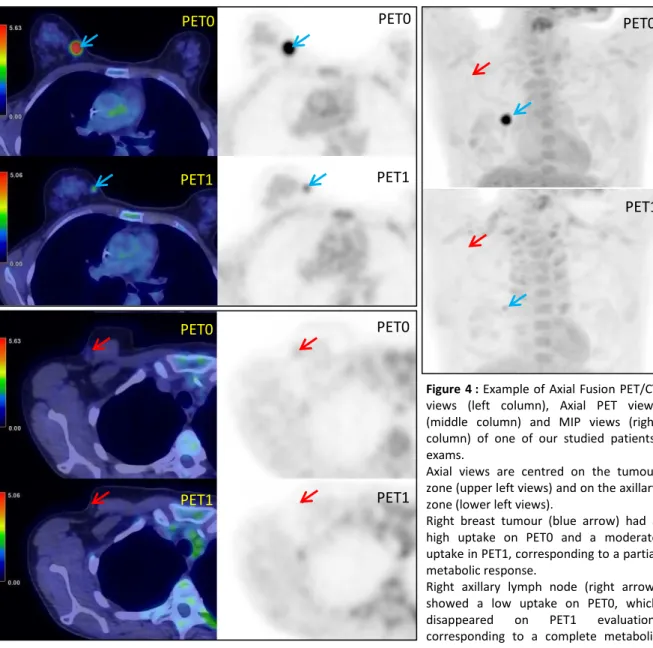
In Figure 3, we show the example of a patient classed in PR concerning her tumour, but in CR concerning her nodal uptake.
PET0 PET1 PET0 PET0 PET1 PET1 PET0 PET0 PET1 PET1
Figure 4 : Example of Axial Fusion PET/CT
views (left column), Axial PET views (middle column) and MIP views (right column) of one of our studied patients’ exams.
Axial views are centred on the tumour zone (upper left views) and on the axillary zone (lower left views).
Right breast tumour (blue arrow) had a high uptake on PET0 and a moderate uptake in PET1, corresponding to a partial metabolic response.
Right axillary lymph node (right arrow) showed a low uptake on PET0, which disappeared on PET1 evaluation, corresponding to a complete metabolic response.
32
4. Discussion
Conventional PET assessment and pathological complete response
We did not evidence any significant differences between pathological responders and no responders concerning initial PET local assessment and interim PET therapeutic response by conventional evaluation. It could be explained by the low statistical power of our population, particularly concerning no responders: seven patients (28%). Double inhibition of HER2 receptor associated with chemotherapy in neoadjuvant treatment could explain our high pCR rate. Moreover, it is important to underline the absence of Grade 4 of Chevallier in our population, suggesting some partial pathologic response even for patients considered as no responders. Indeed, variations of conventional parameters between PET0 and PET1 seem to suggest a therapeutic effect of neoadjuvant chemotherapy for the whole studied population. At last, we performed PET/CT evaluation after only one treatment cycle, possibly too early for observing a difference between pCR and no pCR groups.
Interestingly, all conventional parameters were correlated, suggesting that measurement of only one suffices to inform about 18FDG uptake. Indeed, the measurement of SUV max, which
is usually practiced in Nuclear Medicine, seems to be an easy and fast way to gather this information.
Our results are in contradiction with Avathaxer trial, which studied the relationship between
18FDG PET/CT and pathological response(14). In this study, an adjunction of Bevacizumab to
the initial therapy (Docetaxel) + Trastuzumab) was performed in one subgroup of responding patients in PET evaluation, leading to a better pCR rate that the subgroup of non-responding metabolic patients, who was treated with Docetaxel and Trastuzumab: 43,8% versus 24% respectively. Moreover, these two subgroups had a lower pCR rate than the PET-responding one (53,6%).
33
Textural PET features and pathological complete response
Our tumoral ROI on PET0 showed high values of Entropy and HGZE, associated with low values of Homogeneity and LGZE, which seems to be coherent with tumoral microenvironment characteristics, known for being composed of different kind of cells with high metabolism(15). Surprisingly, in our study, the values of LRE was higher that SRE ones in PET0, suggesting the presence of a majority large areas with homogeneous intensity fields in tumoral sites, compared with short areas. By the way, textural parameters measured in our study after one cure of neoadjuvant treatment varied as expected (13), with a decrease of Entropy, SRE,HGZE and respectively an increase of Homogeneity, LRE and LGZE indexes. Correlations or reverse correlations between textural parameters existing in Contralateral breast ROI supported the logic of these variations induced by neoadjuvant treatment. However, we did not evidence any significant differences between pathological responders and no responders concerning textural evaluation, on baseline as well as interim PET.
To our best knowledge, this study is the first to measure 18FDG accumulation and variation in
peritumoral zones before and after one cure of chemotherapy, as well as its potential ability to predict pCR. On PET0, average SUV max was 7,57+/-4,93 g/mL, and average TLG was 30,07 +/-23,17, which decreased on PET1, as well for automatic than manually placed ROI. We measured high values of Entropy, LRE and HGZE and low values of Homogeneity, SRE and LGZE on PET0. Increase of Homogeneity, LRE and LGZE, and decrease of Entropy, SRE and HGZE were measured on PET1, as well as for automatic than manually placed ROI. Unfortunately, no relationship between these parameters and pCR was demonstrated in our study. This point should be studied further, particularly with a comparison to pathological results. Imaging of tumoral and peritumoral microenvironment remains of interest, especially in view of development of specific therapies targeting microenvironment(15).
34
The centre effect existing in textural analysis underline the difficulties inherent to use this technic in multicentric studies. Low reproducibility is due to differences of PET/CT devices’ resolution and reconstruction technics. Moreover, textural analysis’ comparison between studies is affected by the use of different kind of segmentation method, variations in textural indexes definition and small size of the majority of studies (12,13,16,17). Furthermore, some results of our textural study question about the validity of our measurement, particularly concerning variations of PET0 ROI volumes placed manually on PET1 (14,76+/-28,02% for T40%Repro), which logically should not vary. Indeed, our results have to be carefully interpreted.
Even if relationship between 18FDG PET/CT and pCR following neoadjuvant therapies in breast
cancer have already been investigated, results of different studies are discordant and suffer from reproducibility issues. In their study, Soussan et al. found a moderate correlation between Homogeneity, Entropy and Metabolic Volume PET parameters, and the association of HGRE with SUV max was higher than SUV max alone to predict the aggressiveness of histological type(7). By the way, the method was not the same as ours, a Nestle segmentation being used.
Few studies evaluated the predictive value of PET/CT textures parameters to predict pCR in HER+ breast cancers. As for our study, Cheng et al. did not observe a link between absolute values of conventional and textural parameters of initial PET and pCR. On a cohort of 31 HER2+ breast cancers patients, they only demonstrate a moderately predictive value of pCR relative to the variations of one texture parameter (Skewness) and SUV max, between 2 PET exams(18). Moreover, they also measured a high rate of pCR in their HER2+ group (71%). By the way, PET evaluation was performed after two cures of chemotherapy (Paclitaxel+Carboplatine+Trastuzumab), and the segmentation method was also different.