HAL Id: inserm-02181387
https://www.hal.inserm.fr/inserm-02181387
Submitted on 12 Jul 2019
HAL is a multi-disciplinary open access archive for the deposit and dissemination of sci-entific research documents, whether they are pub-lished or not. The documents may come from teaching and research institutions in France or abroad, or from public or private research centers.
L’archive ouverte pluridisciplinaire HAL, est destinée au dépôt et à la diffusion de documents scientifiques de niveau recherche, publiés ou non, émanant des établissements d’enseignement et de recherche français ou étrangers, des laboratoires publics ou privés.
Z-score change versus Patel exponential model
Laure Simon, Matthieu Hanf, Anne Frondas-Chauty, Dominique Darmaun,
Valérie Rouger, Géraldine Gascoin, Cyril Flamant, Simon Nusinovici,
Jean-Christophe Rozé
To cite this version:
Laure Simon, Matthieu Hanf, Anne Frondas-Chauty, Dominique Darmaun, Valérie Rouger, et al.. Neonatal growth velocity of preterm infants: The weight Z-score change versus Patel exponen-tial model. PLoS ONE, Public Library of Science, 2019, 14 (6), pp.e0218746. �10.1371/jour-nal.pone.0218746�. �inserm-02181387�
Neonatal growth velocity of preterm infants:
The weight Z-score change versus Patel
exponential model
Laure SimonID1,2*, Matthieu Hanf3, Anne Frondas-Chauty1,2, Dominique Darmaun4,
Vale´rie Rouger5, Ge´raldine Gascoin6, Cyril Flamant1,2, Simon Nusinovici3, Jean-Christophe Roze´1,2,4
1 Department of Neonatal Medicine, Nantes University Hospital, Nantes, France, 2 Epidemiologie Clinique, Centre d’Investigation Clinique (CIC004), Nantes University Hospital, Nantes, France, 3 INSERM CIC 1413, Clinical Investigation Center, Nantes University Hospital, Nantes, France, 4 INRA, UMR 1280 Physiologie des Adaptations Nutritionnelles, Nantes University Hospital, Nantes, France, 5 Re´seau "Grandir Ensemble", Nantes University Hospital, Nantes, France, 6 Department of Neonatal Medicine, Angers University Hospital, Angers, France
*laure.simon@chu-nantes.fr
Abstract
Background
Different methods are used to assess the growth of preterm infants during neonatal hospital stay. The primary objective was to compare two methods for assessing growth velocity: g/ kg/d according to the Patel exponential model (EM) and change in weight z-score (ZS) according to Fenton curves. The secondary objective was to highlight factors influencing the level of agreement between the two methods.
Methods
Preterm infants born before 33 weeks were included. Growth velocity was computed by EM and ZS methods and linear regression was used to predict what growth velocity by EM method would be obtained using the ZS method. Differences between EM growth velocity and EM growth velocity predicted by ZS method were then used to assess the level of agreement between the two methods. A difference between -2 and +2 g/kg/day was consid-ered as fair agreement, greater than±4 g/kg/day as poor agreement, and as disagreement otherwise.
Results
Among the 3954 children included, we observe a fair agreement in 2471 children (62.5%), a poor agreement in 1278 (32.3%) and a disagreement in 205 children (5.2%). Birth weight and gestational age explained 31% and 25%, respectively, of the variance in the difference between the two methods.
a1111111111 a1111111111 a1111111111 a1111111111 a1111111111 OPEN ACCESS
Citation: Simon L, Hanf M, Frondas-Chauty A,
Darmaun D, Rouger V, Gascoin G, et al. (2019) Neonatal growth velocity of preterm infants: The weight Z-score change versus Patel exponential model. PLoS ONE 14(6): e0218746.https://doi. org/10.1371/journal.pone.0218746
Editor: Umberto Simeoni, Centre Hospitalier
Universitaire Vaudois, FRANCE
Received: February 8, 2019 Accepted: June 8, 2019 Published: June 28, 2019
Copyright:© 2019 Simon et al. This is an open access article distributed under the terms of the Creative Commons Attribution License, which permits unrestricted use, distribution, and reproduction in any medium, provided the original author and source are credited.
Data Availability Statement: All relevant data are
within the manuscript and its Supporting Information files.
Funding: The authors received no specific funding
for this work.
Competing interests: The authors have declared
Conclusions
In more than a third of enrolled children, the two methods for measuring growth velocity dis-agreed substantially. As variation of weight Z-score takes into account infant gestational age and gender, it could be more suitable to analyze a population of preterm infants with a wide range of gestational age.
Introduction
Ensuring adequate growth in very preterm infants during neonatal hospital stay represents a challenge and a top priority for neonatologists. The aim of the nutritional management of pre-term infants is to support a growth trajectory which mimics the fetal growth during the 3rd tri-mester of gestation, which is normally associated with a tripling in fetal weight [1–2]. Growth rate in the perinatal period is associated with neurologic and metabolic outcomes [3–4]. Ehrenkranz et al. showed that a higher weight gain based on g/kg/d measurements during neo-natal hospital stay was associated with better neurologic outcomes between 18 and 22 months of age in preterm infants [5]. Frondas et al. drew similar conclusions with a growth analysis based on change in weight Z-score [6].
The measurement of postnatal growth is thus central for the clinical care and investigation of very preterm infants. However, no clear consensus currently exists concerning the methods suitable to quantify growth in this population leading clinicians and researchers to use a variety of methods [7–10]. A recent systematic review concludes that more research is clearly needed in the field to identify which methods are preferable to quantify the growth of very preterm infants [8].
Two of the most frequently used methods to calculate weight gain velocity use g/kg/d and change in Z-score relative to an intrauterine or postnatal reference growth chart [8]. Over the last decade, growth velocity was frequently assessed by change of weight Z-score in spite of the fact that Patel showed that g/kg/d estimates based on an exponential model were accurate [7,11]. The latter model was used to assess the growth of preterm infants during neonatal hos-pitalization by several authors [10,12]. Similarly, Fenton et al. recently examined how well growth velocity recommendations for preterm infants fit with current growth references but did not include Z-score methods in their analysis [13]. Although it is necessary to evaluate whether the methodological differences between measurement methods may significantly impact the calculated growth velocity, no clear evaluation of the agreement between g/kg/d and change in Z-score was performed until now.
The aim of this study was thus to determine in preterm infants of less than 33 weeks of ges-tational age whether the two methods for measuring the growth velocity: g/kg/d according to the Patel exponential model (EM), and change in weight Z-score (ZS) according to Fenton curves, resulted in concordant results. The secondary objective was to highlight factors influ-encing the level of agreement between these two methods.
Materials and methods
Patients
The study population was composed of preterm infants enrolled in the Loire Infant Follow-up Team (LIFT) cohort, born at <33 weeks of gestation between January 2003 and December 2015. The LIFT network encompasses 24 maternity clinics including 5 neonatal intermediate
or intensive care units in the Pays-de-la-Loire region [14]. The children’s parents provided written informed consent before inclusion in the LIFT cohort. The patient database was regis-tered with the French data protection authority for clinical research (Commission Nationale de l’Informatique et des Liberte´s (CNIL)). The study was approved by the Nantes Ethics Com-mittee (Groupe Nantais d’Ethique dans le Domaine de la Sante´ (GNEDS)). Verbal consent was obtained from parents, and a statement of “non opposition” was recorded in the infant’s clini-cal chart, as required by French law for this kind of observational study.
Evaluation of growth and agreement between the two methods
Data on growth were recorded at birth and at discharge. Body weight was measured on an electronic scale accurate to the nearest 1g.
Growth velocity was computed by two methods, EM and ZS methods:
[1] To compute growth velocity (g/kg/d) using EM method, we calculated the exponential relationship between initial weight (W1) and weight at the second time point (Wn) as a func-tion of time, with D representing day of life [7]. An exponential model assumes that growth occurs at a constant fraction (k) of the previous weight, such that weight changes over time by some fraction of the previous weight. To compute growth velocity by EM method, the follow-ing formula was used:
Growth velocity (g/kg/d) by EM method = [1000 x ln (discharge Weight / birth Weight)] / length of hospital stay, where ln is the natural logarithm, and weights are expressed in grams, and length of hospital stay in days.
Growth velocity by EM method was called EM growth velocity.
[2] To compute growth velocity using ZS method, we calculated Z-score by usingλ-μ-σ method (LMS). We used Fenton growth chart for birth and discharge [15]. The following for-mula was used:
Growth velocity by ZS method = weight ZS at discharge–weight ZS at birth. Growth velocity calculated by ZS method was called ZS growth velocity.
Because EM and ZS growth velocities are expressed in different units, linear regression was used to predict what the EM growth velocity would be, given the ZS method. Differences between EM growth velocity and EM growth velocity predicted by ZS method were then used to assess the level of agreement between the two methods.
Statistical analysis
To compare differences between EM growth velocity and EM growth velocity predicted by ZS method, the 95% limits of agreement (1.96 standard deviation of the difference) as formalized by Bland and Altman [16] were computed. Normality of the differences was checked. Values obtained by the two methods were plotted against each other with the calculated 95% limits of agreement. Three limits of agreements were preliminary defined between the two methods based on clinical pertinence and literature. Those limits are arbitrary. A limit of agreement between± 2 g/kg/day was considered as fair agreement, between ± 4 g/kg/day as poor agree-ment and as disagreeagree-ment otherwise.
The difference between the two methods was visually inspected according to gender, gesta-tional age, and birth weight ZS. Multivariable regression analyses were then used to determine the adjusted relationships between the differences and 1) characteristics of the child (gender, gestational age, birth weight, birth weight Z-score, discharge weight, discharge weight Z-score, growth velocity, weight Z-score change and parent’s socioeconomic level) 2) characteristics of the mother and her pregnancy (multiple pregnancy, antenatal corticotherapy, hypertension during pregnancy) and 3) characteristics of the neonatal hospital stay (Apgar score at 5 min,
bronchopulmonary dysplasia, late onset infection and breastfeeding at discharge) as indepen-dent variables.
All the analyses were performed with the statistical software R. Significance level was set to p < 0.05. To describe the study population, medians and interquartile ranges (IQR) were com-puted for continuous variables and compared between groups using a Mann-Whitney test as well as proportions for categorical variables and chi-square tests for their comparisons.
Results
Baseline characteristics
We included 4,652 children born < 33 weeks of gestational age between January 2003 and December 2015, who had been enrolled in the LIFT network. The study population consisted of the 3,954 children (85.0%) with no missing data concerning birth weight and weight at discharge.
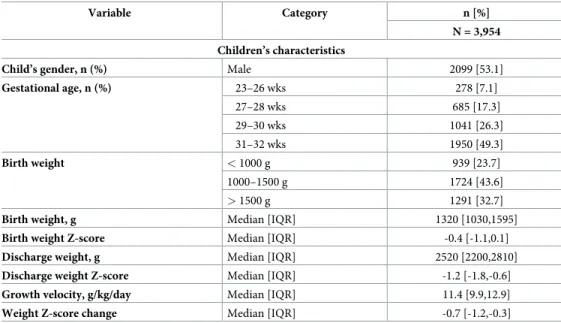
The baseline characteristics of the patients are described inTable 1. In the 3,954 included preterm children, 2099 (53.1%) were male, 278 (7.0%) had a gestational age below 26 weeks of gestation and 1950 (49.3%) above 30 weeks of gestation. Median birth and discharge weights were 1320 g (IQR: 1030; 1590 g) and 2500 g (IQR: 2200; 2800 g), respectively, with an associ-ated median EM growth velocity of 11.4 g/kg/day (IQR: 9.9; 12.9 g/kg/day) and a median ZS growth velocity of -1.10 (-1.50; -0.60) during hospital stay.
Agreement between EM and ZS growth velocity methods
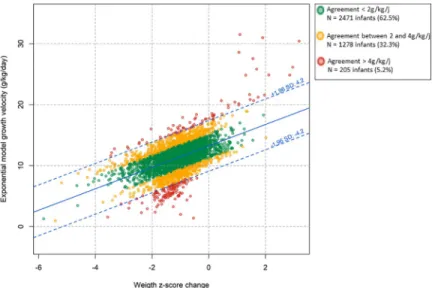
Fig 1shows the observed relationship between EM and ZS growth velocity values as well as the 95% limits of agreement computed according to Bland and Altman. The mean difference between EM growth velocity and EM growth velocity predicted by ZS method was 0.0 g/kg/ day with a standard deviation of 2.1 g/kg/day. These differences were observed in both direc-tions and followed a Gaussian distribution. The calculated 95% limits of agreement was± 4.2 g/kg/day meaning that the difference between EM growth velocity and EM growth velocity predicted by ZS method was in 95% of cases within± 4.2 g/kg/day of the observed EM growth
Table 1. Characteristics of the population.
Variable Category n [%] N = 3,954 Children’s characteristics
Child’s gender, n (%) Male 2099 [53.1]
Gestational age, n (%) 23–26 wks 278 [7.1] 27–28 wks 685 [17.3] 29–30 wks 1041 [26.3] 31–32 wks 1950 [49.3] Birth weight < 1000 g 939 [23.7] 1000–1500 g 1724 [43.6] > 1500 g 1291 [32.7]
Birth weight, g Median [IQR] 1320 [1030,1595]
Birth weight Z-score Median [IQR] -0.4 [-1.1,0.1]
Discharge weight, g Median [IQR] 2520 [2200,2810]
Discharge weight Z-score Median [IQR] -1.2 [-1.8,-0.6]
Growth velocity, g/kg/day Median [IQR] 11.4 [9.9,12.9]
Weight Z-score change Median [IQR] -0.7 [-1.2,-0.3] https://doi.org/10.1371/journal.pone.0218746.t001
velocity. According to our predefined cut-offs, this observed agreement between the two meth-ods was classified as disagreement.
In the study population, 62.5% (n = 2471) of children had a difference of less than 2 g/kg/ day, 32.3% (n = 1278) a difference of more than± 2 g/kg/day, and 5.2% (n = 205) a difference of more than± 4 g/kg/day between the two methods for measuring growth velocity.
Identification of factors influencing the difference between EM growth
velocity and EM growth velocity predicted by ZS method
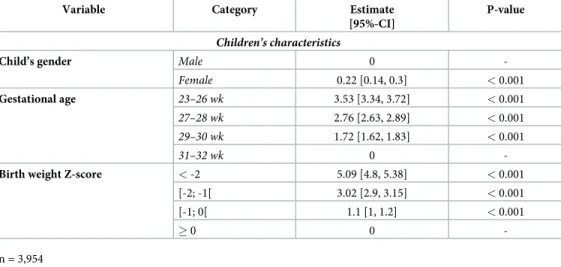
Fig 2shows the density of the differences between EM growth velocity and EM growth velocity predicted by ZS method during neonatal hospitalization according to gender, gestational age and birth weight Z-score. Results of the multiple regression analysis are shown inTable 2. On multivariable analysis, child’s gender, gestational age, birth weight had a significant impact on the difference between EM growth velocity and EM growth velocity predicted by ZS method (p< 0.05). In this multivariable analysis, female gender, low gestational age, low birth weight Z-score increased the observed difference between the two methods. Birth weight and gesta-tional age explained 31% and 25%, respectively, of the variance in the difference between EM growth velocity and EM growth velocity predicted by ZS method. All others included variables explained less than 1% of the variance.
Discussion
In this study, we highlight the very poor agreement between two methods commonly used for neonatal growth assessment, growth velocity by EM and ZS methods. In our population, a fair agreement between the two methods was found in only 62.5% of preterm children, 32.3% had a poor agreement and 5.2% a disagreement. The cut-offs of 2 and 4 g/kg/d are arbitrary but they seem to be relevant for clinical practice. Moreover, it corresponds to the change of weight gain quartiles in the study by Ehrenkranz et al [5] (between 2.2 and 3.6 g/kg/d).
Fig 1. Scatterplot and 95% limits of agreement of the relationship between exponential model and Z-score growth velocities. Z-score growth velocity is the exponential model growth velocity predicted by weight Z-score change
according to Fenton curves during neonatal hospital stay (n = 3,954) Green points represent infants with
agreement < 2 g/kg/day, yellow points represent agreement between 2 and 4 g/kg/day and red points agreement > 4g/ kg/d.
Birth weight and gestational age explained 31% and 25%, respectively, of the variance in the difference between EM growth velocity and EM growth velocity predicted by ZS method. All others included variables explained less than 1% of the variance. Difference between the two methods increased when gestational age decreased. Growth velocity during the third trimester of gestation is not linear and highly depends on weeks of gestation). The change of weight Z-score takes into account gestational age, and therefore seems more physiologically relevant to assess growth during the third trimester of gestation.
Gender is associated with the difference between EM growth velocity and EM growth veloc-ity predicted by ZS method. Nutrition and growth may affect boys more dramatically than girls [6,17]. Boys may be more vulnerable to the stress associated with birth [18]. Studies on placentae of mothers who delivered prematurely described sex-specific alterations of pro-oxi-dant/antioxidant balance with a predominantly pro-oxidant status in placentae of male infants [19]. Growth trajectories therefore are different for boys and girls. Contrary to EM, ZS growth velocity according to Fenton curves takes into account the known difference between boys and girls.
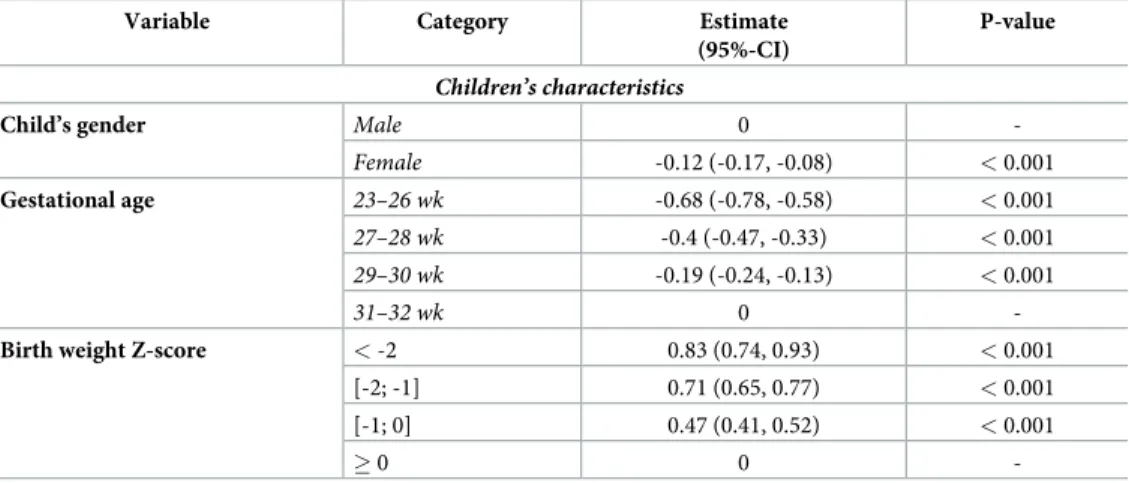
Fenton standards were used to compute ZS. Other standards exist and could question the validity of our results. There is no consensus on which growth curve should be used. We have chosen to use Fenton curves for several reasons 1) the curves had been established from a large sample of newborns 2) the LMS data used to calculate weight, length and head circumference ZS in her reference curve were kindly provided by Dr Fenton; and 3] the curves are specific for boys and girls. Moreover, similar trends were however observed when using Olsen curves [20] (S1andS2Figs,Table 3) confirming the robustness of the disagreement between EM and ZS methods.
With a fair agreement between the two methods for 62.5% of preterm children, we under-stand that clinicians use either of the methods for clinical practice and research [8]. Neverthe-less, poor agreement or disagreement was observed in 37.5% of children in our cohort. We
Fig 2. Agreement between exponential model and Z-score growth velocities according to gender, gestational age and birth weight Z-score. Z-score growth velocity is the exponential model growth velocity predicted by weight Z-score change according to
Fenton curves during neonatal hospital stay according to gender, gestational age and birth weight Z-score (n = 3,954). https://doi.org/10.1371/journal.pone.0218746.g002
Table 2. Multiple regression analysis for factors associated with the difference between exponential model growth velocity and exponential model growth velocity predicted by weight Z-score change according to Fenton curves.
Variable Category Estimate [95%-CI]
P-value
Children’s characteristics
Child’s gender Male 0
-Female 0.22 [0.14, 0.3] < 0.001
Gestational age 23–26 wk 3.53 [3.34, 3.72] < 0.001
27–28 wk 2.76 [2.63, 2.89] < 0.001
29–30 wk 1.72 [1.62, 1.83] < 0.001
31–32 wk 0
-Birth weight Z-score < -2 5.09 [4.8, 5.38] < 0.001
[-2; -1[ 3.02 [2.9, 3.15] < 0.001
[-1; 0[ 1.1 [1, 1.2] < 0.001
� 0 0
-n = 3,954
believe the use of an exponential calculation of weight gain velocity is questionable. The rapid early growth observed in preterm infants indeed does not sustainably follow an exponential trajectory, but rather decreases rapidly after early infancy [21].We fully agree with Fenton et al who recently suggested [13] that ZS growth velocity calculation warrants consideration.
The choice of an appropriate method of growth assessment is important both for clinical practice and research. Postnatal growth is used to guide day-to-day decisions, such as deter-mining the feeding regimen of preterm infants [22]. The lack of standardization of methods of growth assessment makes comparisons between studies difficult and represents an obstacle for the translation of results from research studies into improved clinical guidelines. It therefore appears urgent to standardize the methods for measuring growth velocity in preterm infants.
Our study suffered several limitations. First, when comparing children included and not included in the analysis, significant differences could be seen (Table 4). Preterm children with an antenatal corticosteroid treatment, bronchopulmonary dysplasia, and breastfeeding at dis-charge were indeed overrepresented in those included in the analysis. However, because 1) our study was based on a large number of children (n = 3,954) with a good distribution in all
Table 3. Multiple regression analysis for factors associated with the difference between exponential model growth velocity and exponential model growth velocity predicted by weight Z-score change according to Olsen curves.
Variable Category Estimate (95%-CI)
P-value
Children’s characteristics
Child’s gender Male 0
-Female -0.12 (-0.17, -0.08) < 0.001
Gestational age 23–26 wk -0.68 (-0.78, -0.58) < 0.001
27–28 wk -0.4 (-0.47, -0.33) < 0.001
29–30 wk -0.19 (-0.24, -0.13) < 0.001
31–32 wk 0
-Birth weight Z-score < -2 0.83 (0.74, 0.93) < 0.001
[-2; -1] 0.71 (0.65, 0.77) < 0.001
[-1; 0] 0.47 (0.41, 0.52) < 0.001
� 0 0
-https://doi.org/10.1371/journal.pone.0218746.t003
Table 4. Comparison of the included and not included population. Not included preterm infants Included preterm infants Total P value Total n = 698 n = 3954 n = 4652 Gender 0.78 Boys 366 (52.4) 2099 (53.1) 2465 (53) Girls 332 (47.6) 1855 (46.9) 2187 (47) Gestational age 0.11 23–26 wks 52 (7.4) 278 (7) 330 (7.1) 27–28 wks 117 (16.8) 685 (17.3) 802 (17.2) 29–30 wks 213 (30.5) 1041 (26.3) 1254 (27) 31–32 wks 316 (45.3) 1950 (49.3) 2266 (48.7) Birth weight 0.67 >1500 g 216 (30.9) 1291 (32.7) 1507 (32.4) <1000 g 169 (24.2) 939 (23.7) 1108 (23.8) 1000–1500 g 313 (44.8) 1724 (43.6) 2037 (43.8) https://doi.org/10.1371/journal.pone.0218746.t004
studied variables 2) the number of not included children was relatively small (n = 698, 15%), 3) no differences in anthropometric data were observed between included and not included children and 4) this restriction did not result in obvious selection bias (identified factors were indeed both positively and negatively correlated to observed differences), this bias was of lim-ited impact.
Another limitation concerns the number of weight measurements. However, this limitation should not bias the comparison between the methods as the same number of measurement is used for both methods. In addition to this, the postmenstrual age of discharge is not the same for all preterm infants. Nevertheless both methods take account for the length between birth and discharge, by weighting according to the length of stay in the exponential model and by calculating Z-scores at each ages. The main strength was the large sample of preterm infants enrolled and the population-based birth cohort.
Conclusions
A fair agreement between the two methods for assessing growth velocity: EM growth velocity and EM growth velocity predicted by ZS method was observed in only 62.5% of preterm chil-dren in our cohort. Birth weight and gestational age explained the bulk of the variance in the difference between the two methods. As variation of weight Z-score takes into account both gestational age and gender, this approach could be more suitable to analyze a population with a wide range of gestational age. More studies are needed to confirm this result in other populations.
Supporting information
S1 Fig. Scatterplot and 95% limits of agreement of the relationship between exponential model and Z-score growth velocity. Z-score growth velocity is the exponential growth veloc-ity predict by weight Z-score change according to Olsen curves during neonatal hospital stay (n = 3,954) Green points represent infants with agreement < 2 g/kg/day, yellow points agree-ment between 2 and 4 g/kg/day and red points agreeagree-ment > 4g/kg/d.
(JPG)
S2 Fig. Density of the differences between exponential model and Z-score growth veloci-ties. score growth velocity is the exponential model growth velocity predicted by weight Z-score change according to Olsen curves during neonatal hospital stay according to gender, ges-tational age and birth weight Z-score (n = 3,954).
(JPG)
S1 Table. Raw data of the study population. (XLS)
Acknowledgments
We sincerely thank Dr Fenton for sharing with us the LMS of the growth curves she published in 2013.
Author Contributions
Conceptualization: Laure Simon, Matthieu Hanf, Dominique Darmaun, Simon Nusinovici, Jean-Christophe Roze´.
Formal analysis: Matthieu Hanf, Dominique Darmaun.
Investigation: Laure Simon, Matthieu Hanf, Anne Frondas-Chauty, Vale´rie Rouger, Jean-Christophe Roze´.
Methodology: Laure Simon, Matthieu Hanf, Ge´raldine Gascoin, Cyril Flamant, Simon Nusinovici.
Software: Matthieu Hanf.
Supervision: Ge´raldine Gascoin, Cyril Flamant, Jean-Christophe Roze´. Validation: Anne Frondas-Chauty, Jean-Christophe Roze´.
Writing – original draft: Laure Simon.
Writing – review & editing: Matthieu Hanf, Anne Frondas-Chauty, Dominique Darmaun, Vale´rie Rouger, Ge´raldine Gascoin, Cyril Flamant, Simon Nusinovici, Jean-Christophe Roze´.
References
1. American Academy of Pediatrics Committee on Nutrition: Nutritional needs of low-birth-weight infants.
Pediatrics. 1985; 75(5):976–986. PMID:3921937
2. Agostoni C, Buonocore G, Carnielli VP, De Curtis M, Darmaun D, Decsi T, et al. Enteral nutrient supply for preterm infants: commentary from the European Society of Paediatric Gastroenterology, Hepatology and Nutrition Committee on Nutrition. J Pediatr Gastroenterol Nutr. 2010; 50(1):85–91.https://doi.org/ 10.1097/MPG.0b013e3181adaee0PMID:19881390
3. Ong KK, Kennedy K, Castañeda-Gutie´rrez E, Forsyth S, Godfrey KM, Koletzko B, et al. Postnatal growth in preterm infants and later health outcomes: a systematic review. Acta Paediatr Oslo Nor 1992. 2015; 104(10):974–986.
4. Belfort MB, Rifas-Shiman SL, Sullivan T, Collins CT, McPhee AJ, Ryan P, et al. Infant growth before and after term: effects on neurodevelopment in preterm infants. Pediatrics. 2011; 128(4):e899–906.
https://doi.org/10.1542/peds.2011-0282PMID:21949135
5. Ehrenkranz RA, Dusick AM, Vohr BR, Wright LL, Wrage LA, Poole WK. Growth in the neonatal inten-sive care unit influences neurodevelopmental and growth outcomes of extremely low birth weight infants. Pediatrics. 2006; 117(4):1253–1261.https://doi.org/10.1542/peds.2005-1368PMID:16585322
6. Frondas-Chauty A, Simon L, Branger B, Gascoin G, Flamant C, Ancel PY, et al. Early growth and neu-rodevelopmental outcome in very preterm infants: impact of gender. Arch Dis Child Fetal Neonatal Ed. 2014; 99(5):F366–372.https://doi.org/10.1136/archdischild-2013-305464PMID:24916576
7. Patel AL, Engstrom JL, Meier PP, Kimura RE. Accuracy of methods for calculating postnatal growth velocity for extremely low birth weight infants. Pediatrics. 2005; 116(6):1466–1473.https://doi.org/10. 1542/peds.2004-1699PMID:16322172
8. Fenton TR, Chan HT, Madhu A, Griffin IJ, Hoyos A, Ziegler EE, et al. Preterm Infant Growth Velocity Calculations: A Systematic Review. Pediatrics. 2017; 139(3).
9. Cormack BE, Embleton ND, van Goudoever JB, Hay WW, Bloomfield FH. Comparing apples with apples: it is time for standardized reporting of neonatal nutrition and growth studies. Pediatr Res. 2016; 79(6):810–820.https://doi.org/10.1038/pr.2016.26PMID:26866908
10. Horbar JD, Ehrenkranz RA, Badger GJ, Edwards EM, MOrrow KA, Soll RF, et al. Weight Growth Veloc-ity and Postnatal Growth Failure in Infants 501 to 1500 Grams: 2000–2013. Pediatrics. 2015; 136(1): e84–92.https://doi.org/10.1542/peds.2015-0129PMID:26101360
11. Patel AL, Engstrom JL, Meier PP, Jegier BJ, Kimura RE. Calculating postnatal growth velocity in very low birth weight (VLBW) premature infants. J Perinatol. 2009; 29(9):618–622.https://doi.org/10.1038/ jp.2009.55PMID:19461590
12. Griffin IJ, Tancredi DJ, Bertino E, Lee HC, Profit J. Postnatal growth failure in very low birthweight infants born between 2005 and 2012. Arch Dis Child Fetal Neonatal Ed. 2016; 101(1):F50–55.https:// doi.org/10.1136/archdischild-2014-308095PMID:26201534
13. Fenton TR, Anderson D, Groh-Wargo S, Hoyos A, Ehrenkranz RA, Senterre T. An Attempt to Standard-ize the Calculation of Growth Velocity of Preterm Infants-Evaluation of Practical Bedside Methods. J
14. Hanf M, Nusinovici S, Rouger V, Olivier M, Berlie I, Flamant C, et al. Cohort Profile: Longitudinal study of preterm infants in the Pays de la Loire region of France (LIFT cohort). Int J Epidemiol. 2017; 46 (5):1396–1397.https://doi.org/10.1093/ije/dyx110PMID:29106567
15. Fenton TR, Nasser R, Eliasziw M, Kim JH, Bilan D, Sauve R. Validating the weight gain of preterm infants between the reference growth curve of the fetus and the term infant. BMC Pediatr. 2013; 13:92.
https://doi.org/10.1186/1471-2431-13-92PMID:23758808
16. Bland JM, Altman DG. Applying the right statistics: analyses of measurement studies. Ultrasound
Obstet Gynecol Off J Int Soc Ultrasound Obstet Gynecol. 2003; 22(1):85–93.
17. Simon L, Borrego P, Darmaun D, Legrand A, Roze´ J-C, Chauty-Frondas A. Effect of sex and gesta-tional age on neonatal body composition. Br J Nutr. 2013; 109(6):1105–1108.https://doi.org/10.1017/ S0007114512002991PMID:22784704
18. Lee HC, Green C, Hintz SR, Tyson JE, Parikh NA, Langer J, et al. Prediction of death for extremely pre-mature infants in a population-based cohort. Pediatrics. 2010; 126(3):e644–650.https://doi.org/10. 1542/peds.2010-0097PMID:20713479
19. Stark MJ, Hodyl NA, Wright IMR, Clifton VL. Influence of sex and glucocorticoid exposure on preterm placental pro-oxidant-antioxidant balance. Placenta. 2011; 32(11):865–870.https://doi.org/10.1016/j. placenta.2011.08.010PMID:21903264
20. Olsen IE, Groveman SA, Lawson ML, Clark RH, Zemel BS. New intrauterine growth curves based on United States data. Pediatrics. 2010; 125(2):e214–224.https://doi.org/10.1542/peds.2009-0913PMID:
20100760
21. de Onis M, Siyam A, Borghi E, Onyango AW, Piwoz E, Garza C. Comparison of the World Health Orga-nization growth velocity standards with existing US reference data. Pediatrics. 2011; 128(1):e18–26.
https://doi.org/10.1542/peds.2010-2630PMID:21708799
22. McKenzie BL, Edmonds L, Thomson R, Haszard JJ, Houghton LA. Nutrition Practices and Predictors of Postnatal Growth in Preterm Infants During Hospitalization: A Longitudinal Study. J Pediatr