Design of an accurate monitoring system for a
grid-connected PV system based on LabVIEW
Bilal Taghezouit1,2*, Amar Hadj Arab1, Cherif Larbes 2, Semaoui Smail1 and Abdeladim Kamel1 1Centre de Développement des Energies Renouvelables, CDER, 16340, Algiers, Algeria.
2Laboratoire de dispositifs de communication et de conversion photovoltaïque (LDCCP), Ecole Nationale Polytechnique (ENP), 16200 Algiers, Algeria.
* b.taghezouit@cder.dz
Abstract— In this paper, we propose a method based on LabVIEW software allows to realize an accurate monitoring of a PV system using Agilent 34970A data acquisition (DAQ), our monitoring system is able to measure, analyze and display all informative data of a PV system through an intuitive and user-friendly interface in real time. The proposed monitoring solution has been applied for a grid-connected PV (GCPV) system, as it contains many climatic and electrical parameters to be monitored such as irradiance, temperature, voltage and current of the PV system. The developed monitoring interface of the GCPV system will thus allow recovering, displaying and recording all data measured by the DAQ system in real-time. while the calibration and validation of the measurements by the installed sensors was performed using the data measurements made by SMA Webbox as a reference.The installed monitoring system provides reliable and accurate measurements, especially for electrical sensors installed with very low errors below 0.6%. However, the implemented monitoring system is an indispensable step for the next work on modeling, performance analysis, and fault detection in a PV system.
Keywords—photovoltaic; data acqusition; accuracy; LabVIEW; monitoring;
I. INTRODUCTION
Photovoltaic (PV) market in the last year has seen a great expansion with 98 GW added at the end of 2017, reaching a total installed capacity of 402 GW [1]. This growth is due to innovations and competitiveness in solar PV manufacturing, electricity demand, free pollution, fast return on investment and low maintenance cost.
In front of this big trend, PV power generation systems put into operation, require continuous, reliable and accurate monitoring system, to determine PV performance and meet the expectations of owners / investors [2].
The performance of PV installations depends on several parameters such as: (1) climatic parameters, (2) efficiency of each PV system component and (3) operation & maintenance (O&M) contract which includes the chosen monitoring solution. A monitoring system usually consists of sensors, data acquisition device and software application, it can acquire and analyze a number of parameters for evaluation of performance, to ensure a reliable and stable operation of the PV installations.
Over the past decade, various aspects of PV monitoring systems have been reported in a wide range of publications. In the literature several authors have conducted studies on the design and development of data acquisition (DAQ) and
monitoring systems for PV installations [3-6]. In addition, numerous applications under LabVIEW and other programming environments for monitoring and performance analysis of PV systems have been published in [7-11].
However other authors have written a good review on the state of the art of monitoring PV systems [12-14].
In summary, the purpose of PV monitoring is to provide sufficient information to achieve an "energy balance" representing the amount of available solar energy and losses in each component in the system until delivery to the grid connection point.
The evaluation PV performances can be monitored according to various solutions, the main criteria for classification and selection of the monitoring system according to the standard IEC 61724 are (1) selected measured parameters according to size and application of the PV system, (2) sampling rate and accuracy of measurement, (3) processing, presentation and analysis of data, (4) quality and cost of the DAQ system and (5) transparency of protocols and measurement procedures. Several recommendations and standards have been reported by renowned institutions (e.g.
NREL, SNL and IEA PVPS) [15-21].
II. DESCRIPTION OF GCPVSYSTEM
The GCPV system at Centre de Développement des Energies Renouvelables (CDER) (36 °8′N, 3 °03′E), Algiers, consists of a PV array of 90 modules (ISOFOTON I106-12) monocrystalline- Si technology (see figure 1).
The PV array is composed of three identical PV generators of 3.18 kWp, with an inclination of 27° and an orientation of +15° to the southwest. Each PV generator is connected in a way to have the following configuration: two string in parallel of fifteen PV modules cabled in series.
Thereafter the PV generator is cabled through an electrical protection cabinet to the PV inverter (SMA Sunny Boy 3000TL-21). The single-phase PV sub-systems are assembled in three-phase and connected to the low-voltage electrical grid (Sonelgaz) [22].
Fig 1. Picture of PV Array of the GCPV system on the adminitration roof at CDER
The main electrical characteristics of PV sub-array and inverter are given respectively in Table 1 and Table 2.
TABLE I. ELECTRICAL CHARACTERISTIC OF PV MODULE AND PV
GENERATOR ISOFOTON I106-12
Parameters VOC(V) ISC(A) VMPP(V) IMPP(A) PMPP(W)
PV Module 21.6 6.54 17.4 6.1 106
PV Sub-Array 324 13.08 261 12.2 3180 TABLE II. ELECTRICAL CHARACTERISTIC OF PVINVERTER
SMASUNNY BOY-3000TL-21 Parameters PAC Nominal VMPP range Efficiency max VAC range Frequency range Value 3 kVA 175-500 V 97% 180-280 V 49.5-50.5 Hz
III. DESCRIPTION OF MONITORING SYSTEM
The different PV monitoring solution can be classified according to information dependence that comes from the components constituting the PV system.
The integrated monitoring system, generally is coupled with irradiance and temperature sensors but does not require any additional electrical sensors. The manufacturers of this solution offer a full turnkey system, equipped with (DAQ hardware, software, web interface and manual) as an example: SMA monitoring, Solar-Log, WebdynSun, Victron GX COLOR. this kind of monitoring system gives reliable and continuous data with low maintenance, but is limited in terms of configuration, calibration, and personalization of the DAQ system.
For more flexibility, personalization and accuracy, it is recommended to use independent or external monitoring systems, where the user can select sensors, DAQ hardware and application software. Indeed, this PV monitoring system is fully customizable, it is based on the parameters measurement influencing on the PV performances, mainly the climatic and electrical quantities, using this solution an additional sensors or actuators can be added.
a) Description of SMA monitoring system
The monitoring of the GCPV system is ensured by SMA sunny webbox data logger [23] via RS485 communication bus, allowing to communicate with an external sensor system SMA sunny sensorbox to measures the meteorological data (in-plane irradiance, PV module Temperature, Ambient air Temperature and wind speed).
The electrical data of the three PV sub-systems (such as DC and AC rated currents, voltages and power, daily efficiency, network frequency and other performance parameters) are also retrieved from the PV inverters using SMA webbox via RS485 bus as shown in Figure 2. SMA sunny webbox provide CSV recorded file, which contains the average of the data measured during 5 minutes.
Fig 2. Synoptic diagram of SMA monitoring system
b) Description of external monitoring system
For external monitoring systems for PV application we can distinguish three class: (1) real-time embedded DAQ systems that really cost with high performance and reliability, they are used generally in large scale PV plant [9], (2) PC-based datalogger which costs less than the first that uses a combination with hardware and software to turn PC into a supervisory system defined by the user (figure 6). (3) low cost DAQ based on microcontroller development card [5].
To install a monitoring system, we used for data acquisition the available equipment at our center, it is a datalogger (Agilent 34970A). The monitoring is applied for one PV sub-system of the GCPV system, it’s carried out to require, display and analyze the measured data by the sensors, while these sensors have used to measure both meteorological and electrical parameters during the system operating (Table 3).
The different elements constituting our monitoring system are represented in Figure 3. Where the mounted sensors for measuring the electrical parameters are illustrated in Figures 4 and 5.
The 34901A and 34902A channel multiplexer modules are used for measuring the signal at the output of sensors. These modules are integrated into Agilent 34970a DAQ which has the following features [24].
• 3-slot mainframe with built-in GPIB and RS232 interfaces • 6 1/2-digit (22-bit) internal DMM, scanning up to 250
channels per second
• Built-in signal conditioning measures thermocouples, RTDs, AC/DC volts and current and other function.
However, 1min is the chosen sampling time according to standard norm IEC 61724 [15-16], which gives 1440 samples per day.
The recovery of instantaneous measurements is performed by a graphical code developed (figure 7) under LabVIEW [25] environment using a user-friendly interface.
Fig 4. Mounting voltage sensors (a) DC and (b) AC
Fig 5. Mounting current sensors (a) DC and (b) AC
Fig 6. Picture of Agilent 34970A with LabVIEW under PC
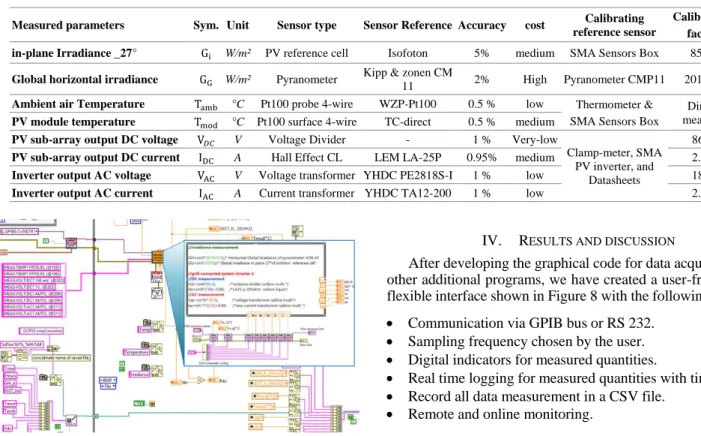
TABLE III. TECHNICAL CHARACTERISTIC FOR USED SNESORS Measured parameters Sym. Unit Sensor type Sensor Reference Accuracy cost Calibrating
reference sensor
Calibration factor in-plane Irradiance _27° Gi W/m² PV reference cell Isofoton 5% medium SMA Sensors Box 8550
Global horizontal irradiance GG W/m² Pyranometer Kipp & zonen CM 11 2% High Pyranometer CMP11 201613
Ambient air Temperature Tamb °C Pt100 probe 4-wire WZP-Pt100 0.5 % low Thermometer &
SMA Sensors Box
Direct measure
PV module temperature Tmod °C Pt100 surface 4-wire TC-direct 0.5 % medium
PV sub-array output DC voltage V𝐷𝐶 V Voltage Divider - 1 % Very-low
Clamp-meter, SMA PV inverter, and
Datasheets
86.3
PV sub-array output DC current IDC A Hall Effect CL LEM LA-25P 0.95% medium 2.54
Inverter output AC voltage VAC V Voltage transformer YHDC PE2818S-I 1 % low 18.3
Inverter output AC current IAC A Current transformer YHDC TA12-200 1 % low 2.53
Fig 7. Sample of diagram code used for create PV monitoring interface
IV. RESULTS AND DISCUSSION
After developing the graphical code for data acquisition and other additional programs, we have created a user-friendly and flexible interface shown in Figure 8 with the following features: • Communication via GPIB bus or RS 232.
• Sampling frequency chosen by the user. • Digital indicators for measured quantities.
• Real time logging for measured quantities with time stamp. • Record all data measurement in a CSV file.
• Remote and online monitoring.
(a) (b)
(b) (a)
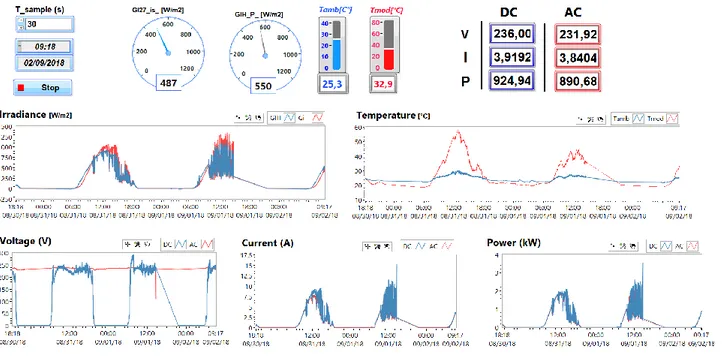
Fig 8. Designed monitoring interface under LabVIEW software
As an example we present the monitoring results of all PV system parameters during a typical day on 09/22/2018 using external sensors, Agilent 34970A and LabVIEW.
Figures 9 to 12 present the evolution of the measurements for each parameter characterizing the GCPV system.
Fig 9. Irradiance measurements (horizontal & inclined)
Fig 10. Temperature measurements (Ambient & PV module)
Fig 11. Current measurements (DC/AC)
Fig 12. Voltage measurements (DC/AC)
To evaluate the reliability and accuracy of the measurements of mounted electrical sensors, we took part of the day from 3:00 pm to 4:30 pm, there was no shading problem or other anomaly.
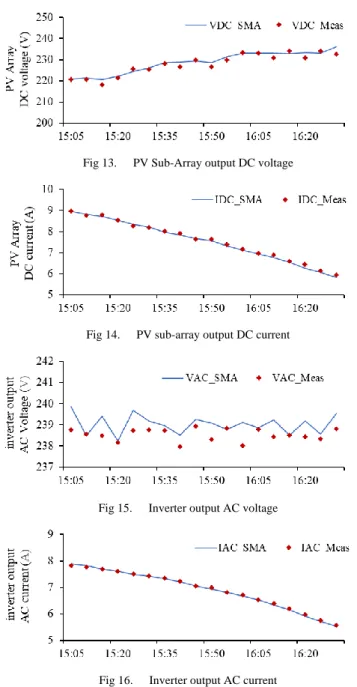
Indeed, SMA DAQ record data each five minutes, for this the measured data with agilent 34970A for t=1m, are averaged for t = 5 m, and then compared with the SMA data, and that to validate the measurements and optimize the calibration factor. Figures 13 to 16 display the evolution of the electrical measurement compared with SB 3000 TL inverter of the GCPV system, where:
The external electrical measures with Agilent and LabVIEW are represented in the waveform in red color with acronym (X_Meas), and the SMA data are shown in blue color with acronym (X_SMA).
Fig 13. PV Sub-Array output DC voltage
Fig 14. PV sub-array output DC current
Fig 15. Inverter output AC voltage
Fig 16. Inverter output AC current
The MAE and RMSE error indicators respectively presented in relationship (1) and (2), are used to prove the accuracy and reliability of the electrical sensors mounted versus those given by SB 3000 TL inverter (Table 4). 𝑀𝐴𝐸 =1 𝑛∑|𝑋_𝑆𝑀𝐴− 𝑋_𝑀𝑒𝑎𝑠| 𝑛 𝑖=1 (1) 𝑅𝑀𝑆𝐸 = √1 𝑛∑(𝑋_𝑆𝑀𝐴− 𝑋_𝑀𝑒𝑎𝑠) 2 𝑛 𝑖=1 (2)
TABLE IV. ERROR CALCULATION
Parameters 𝐕𝐃𝐂 𝐈𝐃𝐂 𝐕𝐀𝐂 𝐈𝐀𝐂
Max measures 350 V 25 A 300 V 8 A
MAE (%) 0.38 0.25 0.17 0.44
RMSE (%) 0.47 0.30 0.21 0.53
Fig 17. Errors deviation between SMA and Agilent electrical measurement
The irradiance measurements (figure 9) present good results and with good measurement accuracy, and with a lower error than 1%.
The both temperature measurements of PV module and ambient air using 4-wire method give a good result compared with FLUKE 52 II thermometer and with SMA PT 100 sensors. The installed current transformer cannot measure AC currents beyond 8A, which is why saturation is observed (figure 11), this sensor was replaced thereafter.
The external electrical measurements are well fitted with data measured by the SMA SB-3000 TL inverter as shown in Figures 13,14, 15 and 16, and with an error not exceeding 0.6% (figure 17).
Globally From the obtained results, the measurements by the sensors in the GCPV system give the desired values with best accuracy and minimum error. As can be seen a good agreement is found with SMA reference measurement.
V. CONCLUSION
The use of the Agilent 34970A with LabVIEW creates a virtual instrumentation system, useful for the data acquisition, analysis, and presentation of data measurement.
The designed monitoring system, presents reliable and accurate measurements especially for installed electrical sensors whose error does not exceed 0.6%, so in this work we were able to design a user-friendly interface under LabVIEW, this interface makes it possible to recover, display and record the measured data of climatic and electrical parameters that characterize the GCPV system.
However, comprehensive monitoring of all characteristic parameters adds value to the PV system to ensure extended system life, low maintenance requirements and low operating costs for optimum performance in a cost-effective and reliable way.
This interface is thus extensible for modeling, performance analysis, and fault detection. The use of the proposed monitoring platform is customizable, and can be applied for any PV system, while the GCPV system presents one of the best applications for the designed monitoring system.
0,0 0,2 0,4 0,6
VDC IDC VAC IAC
REFERENCES
[1] SNAPSHOT OF GLOBAL PHOTOVOLTAIC MARKETS Report IEA PVPS T1-33:2018, pp. 1–16, 2018.
[2] Gantner Instruments. (2015). Effective plant monitoring promotes efficient PV. Retrieved from https://www.gantner-environment.com/fileadmin/user_upload/downloads/02_papers_whitep apers/pv_monitoring_concept_by_gi_article.pdf.
[3] L. Bian, X. Zou, Y. Zhai, and H. Liu, “A multifunctional data acquisition system for photovoltaic plants,” in 2012 International Conference on Systems and Informatics (ICSAI2012), 2012, pp. 598–602.
[4] F. Shariff, N. A. Rahim, and W. P. Hew, “Zigbee-based data acquisition system for online monitoring of grid-connected photovoltaic system,” Expert Syst. Appl., vol. 42, no. 3, pp. 1730–1742, 2015.
[5] M. Fuentes, M. Vivar, J. M. Burgos, J. Aguilera, and J. A. Vacas, “Design of an accurate, low-cost autonomous data logger for PV system monitoring using Arduino that complies with IEC standards,” Sol. Energy Mater. Sol. Cells, vol. 130, pp. 529–543, 2014.
[6] M. J. Prieto, A. M. Pernía, F. Nuño, J. Díaz, and P. J. Villegas, “Development of a Wireless Sensor Network for Individual Monitoring of Panels in a Photovoltaic Plant,” pp. 2379–2396, 2014.
[7] A. Chouder, S. Silvestre, B. Taghezouit, and E. Karatepe, “Monitoring, modelling and simulation of PV systems using LabVIEW,” Sol. Energy, vol. 91, pp. 337–349, May 2013.
[8] M. Zahran, Y. Atia, A. Al-Hussain, and I. El-Sayed, “LabVIEW based monitoring system applied for PV power station,” Proc. 12th WSEAS Int. Conf. Autom. Control. Model. Simul., pp. 65–70, 2010.
[9] Isabel M. Moreno-Garcia et al., “Real-Time Monitoring System for a Utility-Scale Photovoltaic Power Plant ” MDPI Sensors 2016, 16, 770; doi:10.3390/s16060770.
[10] G. Bayrak, M. Cebeci, and x, “Monitoring a grid connected PV power generation system with labview,” Renew. Energy Res. Appl. (ICRERA), 2013 Int. Conf., no. October, pp. 562–567, 2013.
[11] B. Taghezouit, Y. Bakelli, O. Hazil, A. Gherbi, and A. Hadj Arab, “Pressure monitoring and control in a photovoltaic water pumping system test bench under LabVIEW,” 2ème Conférence Int. sur l’Electrotechnique, l’Electronique, l’Automatique la Maint. CIEEAM 2015, pp. 1–6, 2015.
[12] S. R. Madeti and S. N. Singh, “Monitoring system for photovoltaic plants: A review,” Renew. Sustain. Energy Rev., vol. 67, pp. 1180–1207, 2017.
[13] M. M. Rahman, J. Selvaraj, N. A. Rahim, and M. Hasanuzzaman, “Global modern monitoring systems for PV based power generation : A review,” Renew. Sustain. Energy Rev., no. November 2016, pp. 1–17, 2017.
[14] A. Triki-lahiani, A. B. Abdelghani, and I. Slama-belkhodja, “Fault detection and monitoring systems for photovoltaic installations : A review,” Renew. Sustain. Energy Rev., no. July, pp. 0–1, 2017. [15] P. K. Emery and R. Smith, “Monitoring System Performance
(Presentation), NREL (National Renewable Energy Laboratory),” 2011. [16] NREL/Sandia/Sunspec Alliance SuNLaMP PV O&M Working Group, “Best Practices in Photovoltaic System Operations and Maintenance 2 nd Edition ” no. December, 2016.
[17] M. Gostein, Atonometrics, Inc “Update on Edition 2 of IEC 61724 : PV System Performance Monitoring,” NREL PV Module Reliability Workshop. February, 2014.
[18] IEA PVPS “Guidelines for Monitoring Stand-Alone Photovoltaic Power Systems Report IEA PVPS T3-13 ,” october 2003.
[19] Mike Green, et al "Improving Efficiency of PV Systems Using Statistical Performance Monitoring". Report IEA-PVPS Task13 June 2017 [20] A. Woyte et al. “Analytical Monitoring of Grid-connected Photovoltaic
Systems - Good practices for monitoring and performance analysis,” Report IEA-PVPS T13-03: 2014.
[21] Gabi Friesen et al, “Photovoltaic Module Energy Yield Measurements: Existing Approaches and Best Practice,” Report IEA‐PVPS T13‐ 11:2018.
[22] A. Hadj Arab, S. Bouchakour, K. Abdeladim, S. O. Amrouche, S. Semaoui, B. Taghezouit, and N. Yassaa, “Connection of the CDER-Algiers photovoltaic system to low-voltage distribution grid,” Energy Procedia, vol. 136, pp. 145–150, 2017.
[23] SMA. “SUNNY WEBBOX Device for Plant Monitoring”. Retrieved from http://files.sma.de/dl/4253/SWebBox-BA-US-en-34.pdf. [24] Keysight 34970A Data Acquisition / Data Logger Switch Unit [Online].
Available: https://www.keysight.com/en/pd- 1000001313%3Aepsg%3Apro-pn-34970A/data-acquisition-data-logger-switch-unit?cc=DZ&lc=eng
[25] What Is LabVIEW? [Online]. Available: http://www.ni.com/en-lb/shop/labview.html