HAL Id: hal-01823328
https://hal.archives-ouvertes.fr/hal-01823328
Submitted on 25 Sep 2018
HAL is a multi-disciplinary open access
archive for the deposit and dissemination of
sci-entific research documents, whether they are
pub-lished or not. The documents may come from
teaching and research institutions in France or
abroad, or from public or private research centers.
L’archive ouverte pluridisciplinaire HAL, est
destinée au dépôt et à la diffusion de documents
scientifiques de niveau recherche, publiés ou non,
émanant des établissements d’enseignement et de
recherche français ou étrangers, des laboratoires
publics ou privés.
Novel three-dimensional carbon nanotube networks as
high performance thermal interface materials
Qinyu Kong, Laurence Bodelot, Bérengère Lebental, Yu Dian Lim, Li Lynn
Shiau, Boris Gusarov, Chong Wei Tan, Kun Liang, Congxiang Lu, Chuan
Seng Tan, et al.
To cite this version:
Qinyu Kong, Laurence Bodelot, Bérengère Lebental, Yu Dian Lim, Li Lynn Shiau, et al.. Novel
three-dimensional carbon nanotube networks as high performance thermal interface materials. Carbon,
Elsevier, 2018, 132, pp.359-369. �10.1016/j.carbon.2018.02.052�. �hal-01823328�
Novel three-dimensional carbon nanotube networks as high
performance thermal interface materials
Qinyu Kong1, Laurence Bodelot2, Bérengère Lebental3,4, Yu Dian Lim1, Li Lynn
Shiau1, Boris Gusarov2, Chong Wei Tan1, Kun Liang1, Chongxiang Lu1,5,6, Chuan
Seng Tan1, Coquet Philippe7, Beng Kang Tay1,7
1 NOVITAS, Nanoelectronics Center of Excellence, School of Electrical and Electronic
Engineering, Nanyang Technological University, 639798, Singapore
2Laboratoire de Mécanique des Solides, Ecole Polytechnique, CNRS, Université
Paris-Saclay, 91128 Palaiseau, France
3Université Paris-Est, IFSTTAR, COSYS, Marne-La-Vallée, France, 77447 4LPICM, CNRS, Ecole Polytechnique, Université Paris-Saclay, 91128 Palaiseau,
France
5School of Automotive Studies, Tongji University, Shanghai 201804, China 6Joyson Holding Group Co.Ltd, Ningbo Hi-Tech Park, Zhejiang 315000, China
7 CINTRA, CNRS International NTU THALES Research Alliance, Research Techno Plaza, 50 Nanyang Drive, Border X Block, Level 6, Singapore 637553
*Corresponding author, Email:[email protected], Tel:(+65)81464714
ABSTRACT
Vertically aligned carbon nanotube (VACNT) arrays are considered as promising thermal interface materials (TIMs) due to their superior out-of-plane thermal conductivities. However the air gaps between adjacent CNTs within the CNT array
hinder the in-plane heat transfer, thus significantly degrading the thermal performance of VACNT-based TIMs. To improve the inter-tube in-plane thermal conduction within of VACNT arrays, we propose a novel three dimensional CNT (3D CNT) network structure, where the CNTs in a VACNT array are cross-linked by randomly-oriented secondary CNTs. Three different catalyst preparation methods for the secondary CNT growth are compared in terms of their ability to produce a dense network of secondary CNTs. Among the tested methods, the chemical impregnation method shows a denser 3D CNT network structure. The 3D CNT network grown using this method and is thus chosen for further thermal characterization via a framework especially developed for the evaluation of in-plane thermal properties of such devices. The temperature fields of the corresponding 3D CNT network under different heating powers are recorded using a 15 μm-resolution infrared thermal imaging system. The in-plane thermal conductivity is then derived from these fields using numerical fitting with a 3D heat diffusion model. We find that the in-plane thermal conductivity of the 3D CNT network is 5.40±0.92 W/mK, at least 30 times higher than the thermal conductivity of the primary VACNT array used to grow the 3D CNT network.
Keywords: 3D CNT network, in-plane thermal conductivity, thermal imaging.
1. Introduction
Thermal interface materials (TIMs) play a significant role in the packaging of high power electronic devices. TIMs are generally positioned between heat generating devices and heat sinks to improve their thermal coupling via physical contact. For
state-of-the-art TIMs, such as thermal greases or phase change materials, the effective thermal conductivity ranges between 0.4 and 5 W/mK [1]. Although it is much better than air (~0.026W/mK), such thermal properties are still insufficient to satisfy the requirements of modern high power density devices.
Recent studies have investigated carbon nanotube (CNT) based TIMs in depth [2-4]. Carbon nanotubes possess superior thermal properties due to their strong sp2
carbon bonding and long phonon mean free path. The thermal conductivity of individual CNTs has been measured to be 600~3000W/mK [5, 6]. Various kinds of CNT-based TIMs have been developed, such as CNT/polymer composites [3, 7] and CNT array [8].Among the reported studies, vertically aligned CNT (VACNT) arrays stand out for their higher thermal conductivity [9] coupled with high mechanical compliance [10]. This helps in solving the issue of thermal stress caused by the mismatch in the coefficient of thermal expansion (CTE) between two contacting surfaces. Zhang et al. reported a reduction of 90% in the interfacial thermal resistance when replacing commercial TIMs with VACNT array-based TIM in high brightness light-emitting-diodes [11].
Despite the promising potential of VACNTs as TIMs, the thermal conductivity of a VACNT array is highly anisotropic. The air gap within the CNT array reduces the heat transfer between adjacent CNTs, which limits the in-plane thermal conductivity of VACNT arrays. From molecular dynamics (MD) simulations, Che et al. predicted that the in-plane thermal conductivity of VACNT array is as low as 0.056W/mK [12]. It reduces the applicability of VACNT as TIMs, as high in-plane thermal conductivity
is required when the sizes of the devices and their corresponding heat sources decrease. However, compared with the out-of-plane thermal measurements of VACNT-based TIMs, very few tools are available for the in-plane thermal characterizations of VACNT-based TIMs [13], which slows down the progress of improving the in-plane thermal properties of VACNT-based TIMs.
Considering the low in-plane thermal conductivity of the current state-of-the-art VACNT arrays as well as the lack of dedicated tools to evaluate this thermal property, the objective of the present work is two-fold: improving the in-plane thermal properties of VACNT array-based TIMs and developing a reliable framework for the quantitative evaluation of their in-plane conductivity. To this end, In this work a novel three dimensional (3D) CNT network is proposed, where to enhance the in-plane thermal conductivity of VACNT array-based TIMs. In this novel structure, CNTs in a VACNT array are cross-linked by randomly-oriented secondary CNTs :thus forming a three dimensional (3D) CNT network. The secondary CNTs provide an extra path for heat conduction in the in-plane direction and thus are expected to enhance the in-plane thermal conductivity of VACNT array-based TIMs. To verify this, The in-plane thermal conductivity of the 3D CNT network is evaluated by a method coupling infrared thermal imaging with 3D thermal modeling is developed so as to characterize the in-plane thermal conductivity of the proposed structure.
In what follows, three different catalyst preparation methods for the secondary CNT growth are compared in terms of their ability to produce a dense network of secondary CNTs. The 3D CNT network grown using the method yielding the denser
network is then chosen for further thermal characterization. Real-time temperature fields of the corresponding 3D CNT network heated by a metal wire are recorded using a high-resolution infrared thermal camera. A 3D thermal model of the system is then solved by finite element analysis. The obtained temperature data is fitted with the model outcome to yield the in-plane thermal conductivity of the material. The in-plane thermal conductivities of the 3D CNT network and the primary VACNT array used to grow the 3D CNT network are finally compared.
2. Experimental Details
2.1 Sample preparation
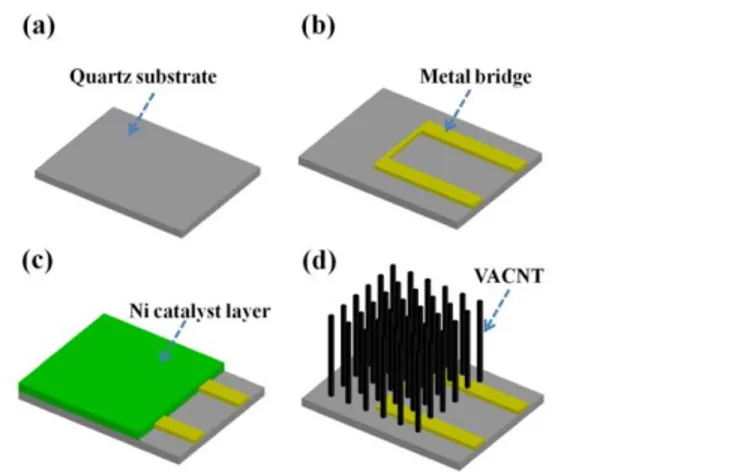
Figure 1 shows the preparation procedure for the samples. Quartz is chosen as substrate for its good heat insulation property (see Fig.1(a)). The thermal conductivity of the quartz substrate is measured to be 1.77 W/mK by the 3ω technique [14]. To serve as a heater, a metal bridge composed of a wire and two contact pads is deposited on top of a rectangular quartz sample (15 mm × 20 mm) (see Fig.1(b)). The metal bridge is 6 mm in length and 40 μm in width. Each contact pad measures 12.5 mm in length and 1.8 mm in width. Both the bridge and the contact pads are made of a 150 nm-thick Ti layer topped with a 30 nm-thick TiN layer. The high electrical resistivity of Ti enables a large electrical resistance (up to 3000Ω). The TiN layer protects Ti from oxidizing. A 20 nm Ni layer is then evaporated on top of the substrate and of the metal bridge as the catalyst for VACNT growth (see Fig. 1(c)). The contact pads of the metal bridge are protected with thermal tape during the evaporation.
The primary VACNT array is then grown by Aixtron Blackmagic Plasma Enhanced Chemical Vapor Deposition (PECVD) system. A detailed study about the VACNT growth has been reported previously [15]. The chamber pressure is kept as 5 mbar. A radio frequency (RF) electric field biased at 700V is applied with a power of 90W. After 5mins pre-growth annealing under 250sccm NH3, the VACNT growth is
conducted at 750°C under 250sccm NH3 and 50sccm C2H2 for 30mins. The resulting
“VACNT/heater/quartz” structure is depicted in Fig. 1(d).
Fig. 1 Preparation procedure of the primary VACNT array: (a) the quartz substrate; (b) the metal bridge deposited on top of quartz as heater; (c) the Ni catalyst layer deposition; and (d) VACNT array/heater/quartz substrate structure.
To achieve the cross-linked structure of the 3D CNT network, the Ni catalysts for the secondary CNTs growth within the primary VACNT array structure are prepared. In this study, three catalyst preparation methods are compared: (1) the sputtering method, (2) the direct transfer method, and (3) the chemical impregnation method:
(1) In the sputtering method (see Fig. 2(a)), the Ni catalyst is deposited onto the
primary VACNTs through magnetic sputtering;
(2) In the direct transfer method (see Fig. 2(b)), a Ni foil is transferred onto the top of
the primary VACNTs. Then the foil is annealed under H2 atmosphere to break it
down into Ni particles;
(3) In the chemical impregnation method (see Fig. 2(c)), the primary VACNT array is
impregnated with 0.01mol/L Ni(NO3)2.6H2O in acetone and then annealed under
H2 atmosphere. During the annealing, the Ni precursors contained in the
above-mentioned solution are transformed into Ni particles. The reactive equations are described in Eq. 1 and Eq. 2:
Ni(NO3)2=NiO+2NO2+O2 (1)
NiO+H2=Ni+H2O (2)
After the Ni catalyst preparation (see Fig. 2(d)), the secondary CNTs are grown in a thermal furnace using an ethanol bubbler as the carbon source. The growth is carried out under 700°C for 10mins, and the 3D CNT network is formed (see Fig.2(e)).
The electrical resistance of the metal wire is measured before and after the growth process of the VACNT array and of the secondary CNTs. Little change (<0.5%) is observed, suggesting that the presence of CNTs on top of the metal bridge does not induce significant parasitic conducting paths.
Fig.2 Preparation procedure of secondary CNTs using three different Ni catalyst
preparation methods: (a) the sputtering method; (b) the transfer method; and (c) the impregnation method. (d) The Ni catalyst attached on the sidewall of VACNT; and (e) the final 3D CNT network/heater/quartz substrate structure.
2.2 Infrared thermography characterization
Figure 3(a) shows the schematic diagram of the set-up for infrared thermal imaging of the samples. The temperature map of the sample surface is obtained using a FLIRX8400sc infrared camera equipped with a G1 lens and operating in the infrared wavelength range between 1.5 μm and 5μm. This system offers a spatial resolution of 15 μm and a temperature sensitivity of 25 mK. A black box surrounds the sample and the lens of the camera to minimize the noise from the radiation of surrounding objects
(see Fig. 3(b)). The sample is maintained vertically in front of the camera by a holder made of aluminum alloy. The two contact pads of the metal bridge deposited on the quartz substrate are connected to a precision power supply (Keithley 2612B), as shown in Fig. 3(c). When a DC current is applied to the pads of the bridge, the bridge wire would act as a heater by Joule heating effect.
Fig.3(a) Diagram of the set-up for the infrared thermal imaging, (b) image of the
system inside the black box, and (c) image of the sample clipped to the holder with electrical wire connections in place.
To convert the infrared radiation collected by the camera into temperature data, the emissivity value of each sample in the range of 1.5 μm to 5.1 μm is required. The
emissivities of the primary VACNT and the 3D CNT network are both measured to be 0.99 using an Perkin-Elmer Frontier FTIR system with an integrating sphere. The procedure has been well described elsewhere [16].
Temperature maps of sample surfaces are recorded under three different heating powers: 23mW, 47mW and 99mW. Temperature profiles corresponding to the thermal steady state are extracted for further thermal property analysis (see Section 3.3 for details).
3 Results and Discussion 3.1 Primary VACNT array
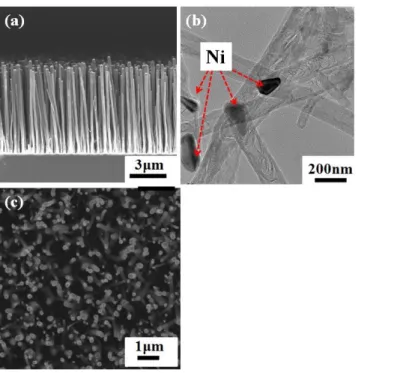
Figure 4(a) presents a cross-sectional SEM image of the primary VACNT array. It exhibits a high degree of vertical alignment, similar to other PECVD-grown CNTs such as those reported by Abdi et al. [17]. According to the TEM image shown in Fig. 4(b), Ni clusters are observed at the tips of the CNTs. This suggests the tip-growth mechanism of VACNTs by PECVD system [18]. From the top view (see Fig. 4(c)), sparsely-grown CNTs are observed, with visible air gaps between CNTs. This feature is expected from PECVD-grown CNTs, as described in our previous study [19]. This sparsely-grown nature of PECVD-grown CNT may exhibit inferior in-plane thermal properties, as discussed earlier.
Fig. 4 (a) Cross-sectional view of the primary VACNT array; (b) TEM image of the
primary VACNT array ; and (c) top view of the primary VACNT array.
3.2 3D CNT network
To explore the possibilities in improving the in-plane thermal conductivity of the VACNT array presented in Fig.4, secondary CNTs are grown within the VACNT array to provide additional thermal conducting pathways. As described in Section 2.1, three different methods for Ni catalyst preparation have been investigated for the secondary CNTs growth within the primary VACNT array. The obtained 3D CNT networks using these three methods are compared in this section.
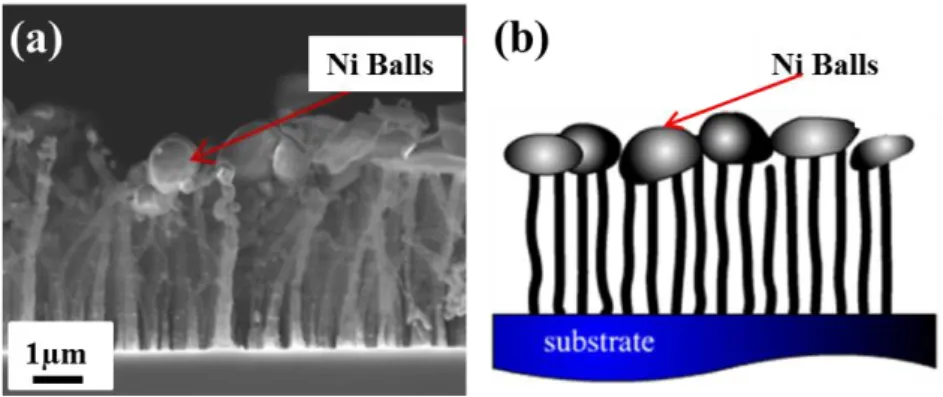
Figure 5(a) shows the SEM image of the 3D CNT network grown using the sputtering method. It can be observed that Ni nanoballs of 200 to 1000 nm in diameter
are accumulated on the tips of the VACNTs, which can be explained by Cassie-Baxter model [20]. The presence of Ni nanoballs can possibly shield the underneath part of the primary VACNTs (see Fig. 5(b)), blocking the carbon feed stock gas to diffuse below the tips. As a result, minimal secondary CNTs are grown, as observed in Fig. 5(a).
Fig. 5 3D CNT network grown using the sputtering method: (a) the cross-sectional
SEM image; and (b) the schematic image.
Since the formation of Ni nanoballs hinders secondary CNT growth, an alternative method is needed to incorporate Ni catalyst source on VACNTs for the growth of secondary CNTs. Therefore, we attempted to incorporate Ni catalyst using direct nickel foil transfer method. Figure 6 shows the SEM images of the 3D CNT network grown using the direct Ni foil transfer method. From Figure 6(b) and (d), it is observed that secondary CNTs are grown and bridged between adjacent primary VACNTs. This indicates that the Ni foil has been de-wetted into small nickel particles, scattering around VACNT to form catalytic particles for secondary CNT growth. As
compared to Fig. 5(a), a more significant growth of secondary CNTs can be observed in Fig. 6(d). However, the grown secondary CNTs are still sparse, and provide limited thermal pathways to bridge adjacent VACNTs. This can limit the enhancement in its thermal conductivity along the in-plane direction.
Fig. 6 SEM images of a 3D CNT network grown using the direct transfer method: (a)
top view of the 3D CNT network; (b) zoom image of the red rectangular area in (a); (c) cross-sectional view of the 3D CNT network; and (d) zoom image of the red rectangular area in (c).
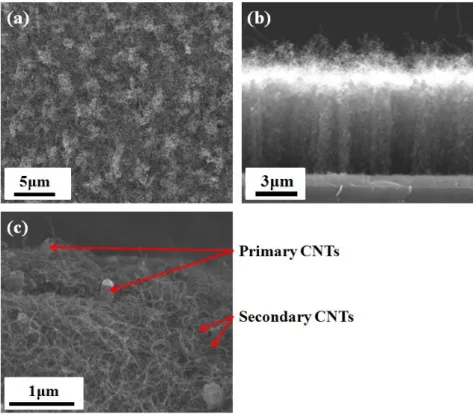
To explore further improvement in the growth density of secondary CNTs, VACNTs are impregnated with Ni(NO3)2 solution as a catalyst source for secondary
CNTs growth. Figure7 shows the SEM images of the 3D CNT network obtained using the chemical impregnation method. Randomly oriented secondary CNTs are grown, filling up the gaps between adjacent VACNTs. As compared to direct transfer of Ni foil, this method provides Ni particles in solution state, which can be speculated to be
penetrated more readily through the VACNT film. As a result, dense secondary CNTs are obtained from the chemical impregnation technique.
Fig. 7 SEM images of a 3D CNT network grown using the impregnation method: (a)
top view SEM image of the 3D CNT network; (b) cross-sectional view of the 3D CNT network; and (c) zoom image of the 3D CNT network.
To further investigate the morphological properties of 3D CNT network grown using the chemical impregnation method, we perform TEM imaging on the 3D CNT network (see Fig. 8). As shown in Fig. 8(a), the diameter of primary VACNT is around 150 nm. The diameter of the secondary CNT cross-linking the primary CNTs is around 20 nm. From the magnified TEM image (see Fig. 8(b)), both primary
VACNTs and secondary CNTs show multi-walled structure. To investigate the interface between primary VACNTs and secondary CNTs further, the zoom image of the red rectangle region in Fig. 8(b) is shown as Fig. 8(c). The spacing between each wall is 0.34 nm for both primary and secondary CNTs, which is in agreement with the wall spacing in MWCNTs [21]. It can be observed seems (zone circled in Fig. 8(c)) that the wall structure of secondary CNT is embedded into the wall pattern of primary CNT. Such a This smooth continuation of CNT walls would suggest that the secondary CNT is grown directly from the sidewall of the primary CNT.
Fig. 8 (a) TEM image of 3D CNT network grown using the chemical impregnation
method, (b) HRTEM image of the rectangular region in (a), and (c) HRTEM image of the rectangular region in (b).
From the obtained results, the 3D CNT network grown using the chemical impregnation method shows a network structure with the densest secondary CNTs among all three different methods. Since secondary CNTs can enhance the in-plane thermal conductivity of VACNT array, the 3D CNT network sample grown using the chemical impregnation method is the most desirable for superior in-plane thermal conductivity. Therefore, for the thermal property study conducted in what follows, we
will only focus on the 3D CNT network sample synthesized using the chemical impregnation method.
3.3 Thermal imaging characterization
A comparison of the high resolution thermal maps of the 3D CNT network as well as the primary VACNT array, which serves as a reference sample, are shown in Fig.9 for different input powers. The temperature profiles along a segment perpendicular to the center of the wire heater (marked by the blue dotted line in Fig. 10(a)) are also extracted from the above-mentioned maps and shown in Fig.10(b). Under different heating powers, the temperature of the 3D CNT network near the heating wire is always lower than that of the primary VACNT array. As the heating power increases, the surface temperature difference between the 3D CNT network and the VACNT array increases. Under the heating power of 99 mW, the temperature of the 3D CNT network at a distance of 0.5 mm away from the heating wire is 10 K lower than that of the VACNT array. This indicates that the 3D CNT network has a much better heat dissipation capability than the primary VACNT array. Compared to the primary VACNT array, the slopes of the temperature profiles for the 3D CNT network are much smaller, which indicates that the 3D CNT network has a lower in-plane thermal resistance than the primary VACNT array.
At a distance of 6 mm from the heater, the sample is clipped by an aluminum alloy holder (see Fig. 3(c)). This aluminum alloy holder acts as heat sink for the system, due to its high thermal conductivity. As a result, the temperature of the sample
Mis en forme : Anglais (États-Unis)
Mis en forme : Anglais (États-Unis) Mis en forme : Anglais (États-Unis) Mis en forme : Anglais (États-Unis)
Mis en forme : Anglais (États-Unis) Mis en forme : Anglais (États-Unis)
surface near the heat sink is close to the ambient temperature. During the thermal measurements, the ambient temperatures are slightly different: 296.35K for the 3D CNT network and 295.45K for the VACNT array. This give an explanation of the slightly higher temperature for the 3D CNT network than for the VACNT array at 5.1 mm from the wire.
Fig.9 Left: Primary VACNT array under 23mW(a), 47mW(b), 99mW(c); Right: 3D
CNT network under 23mW(d), 47mW(e), 99mW(f).
Fig.10 (a) Model for the thermal system: the blue dotted line is perpendicular to the
center of the wire heater, and (b) the temperature profile (extracted from the temperature maps of Fig. 9) along the blue dotted line as a function of the distance from the heater.
3.4 Extraction of the in-plane thermal conductivity of the CNT films 3.4.1 Thermal model
To extract the in-plane thermal conductivity of the CNT films from the temperature profiles given in Fig. 10(b), we use the following governing 3D heat equations for the thermal heater, the quartz substrate, the top and bottom parts of the holder, and the CNT film:
𝜕 𝜕𝑥(𝐾𝐻 𝜕𝑇𝐻 𝜕𝑥)+ 𝜕 𝜕𝑦(𝐾𝐻 𝜕𝑇𝐻 𝜕𝑦)+ 𝜕 𝜕𝑧(𝐾𝐻 𝜕𝑇𝐻 𝜕𝑧)+ 𝑃 = 𝜌𝐻𝐶𝐻 𝜕𝑇𝐻 𝜕𝑡(3) 𝜕 𝜕𝑥(𝐾𝑆 𝜕𝑇𝑆 𝜕𝑥) + 𝜕 𝜕𝑦(𝐾𝑆 𝜕𝑇𝑆 𝜕𝑦)+ 𝜕 𝜕𝑧(𝐾𝑆 𝜕𝑇𝑆 𝜕𝑧)= 𝜌𝑆𝐶𝑆 𝜕𝑇𝑆 𝜕𝑡 (4) 𝜕 𝜕𝑥(𝐾𝐴 𝜕𝑇𝑡ℎ 𝜕𝑥 )+ 𝜕 𝜕𝑦(𝐾𝐴 𝜕𝑇𝑡ℎ 𝜕𝑦)+ 𝜕 𝜕𝑧(𝐾𝐴 𝜕𝑇𝑡ℎ 𝜕𝑧 )= 𝜌𝐴𝐶𝐴 𝜕𝑇𝑡ℎ 𝜕𝑡 (5) 𝜕 𝜕𝑥(𝐾𝐴 𝜕𝑇𝑏ℎ 𝜕𝑥 )+ 𝜕 𝜕𝑦(𝐾𝐴 𝜕𝑇𝑏ℎ 𝜕𝑦 )+ 𝜕 𝜕𝑧(𝐾𝐴 𝜕𝑇𝑏ℎ 𝜕𝑧 )= 𝜌𝐴𝐶𝐴 𝜕𝑇𝑏ℎ 𝜕𝑡 (6) 𝜕 𝜕𝑥(𝐾𝐶𝑁𝑇,𝑖𝑛 𝜕𝑇𝐶𝑁𝑇 𝜕𝑥 )+ 𝜕 𝜕𝑦(𝐾𝐶𝑁𝑇,𝑖𝑛 𝜕𝑇𝐶𝑁𝑇 𝜕𝑦 )+ 𝜕 𝜕𝑧(𝐾𝐶𝑁𝑇,𝑜𝑢𝑡 𝜕𝑇𝐶𝑁𝑇 𝜕𝑧 )= 𝜌𝐶𝑁𝑇𝐶𝐶𝑁𝑇 𝜕𝑇𝐶𝑁𝑇 𝜕𝑡 (7)
In Eq. 3 to Eq. 7, the subscript H refers to the metal heater, S to the quartz substrate, A to the aluminum alloy holder, th to the top part of the holder, bh to the bottom part of the holder, P to the heat generation rate of the metal wire, ρ to the density, C to the heat capacity, and K to the thermal conductivity. Since CNT films show high anisotropy in their thermal property [22], we define𝐾𝐶𝑁𝑇,𝑖𝑛 and 𝐾𝐶𝑁𝑇,𝑜𝑢𝑡 to represent respectively the in-plane and the out-of-plane thermal conductivity of the CNT film. For the holder, the quartz substrate, and the metal heater, 𝐾𝐴, 𝐾𝑆, and 𝐾𝐻
represent their thermal conductivities, assumed to be isotropic.
In the thermal steady state, the time derivatives of the temperature in the different domains are null; so the right-hand side of Eq.3 to Eq.7 turns out to be 0.
Therefore, the 3D heat diffusion equations under thermal steady state are no longer dependent on the density (ρ) and the heat capacity (C) of the materials.
Regarding boundary conditions:
As the bottom part of the holder is placed on a large steel stage, the temperature of the bottom surface of the bottom holder is fixed at ambient temperature 𝑇0:
𝑇 = 𝑇0 . (8) For all the remaining external (exposed to air) boundary surfaces, there is heat flux caused by natural convection. The heat flux 𝑞⃗⃗⃗ 𝑐 of natural convection is:
−𝑛⃗ ∙ 𝑞⃗⃗⃗ 𝑐= ℎ(𝑇0− 𝑇), (9)
where 𝑇0 is the ambient temperature; 𝑇 is the temperature of the boundary
surface; h is the heat transfer coefficient for natural convection.
In addition to the natural convection, there is also heat loss due to the radiation on all the remaining boundary surfaces. The heat flux 𝑞⃗⃗⃗⃗ 𝑟 caused by radiation is described as:
−𝑛⃗ ∙ 𝑞⃗⃗⃗⃗ 𝑟= εσ(T04− T4), (10)
where 𝜀 is the sample emissivity; σ is the Stefan-Boltzman constant, σ = 5.67 × 10⁻⁸W/m2K4. Since quartz is transparent in the mid-infrared range
where the thermal camera operates, its emissivity at mid-infrared range is extremely low (10-7~10-5) and the radiation rate is negligible (around 10-5 mW)
[23]. Based on our measurements, the temperature of the holder is close to the
Mis en forme : Anglais (États-Unis)
Mis en forme : Anglais (États-Unis)
ambient temperature 𝑇0. The radiation rate of the holder is calculated from Eq.10 to be around 10-3 mW, which is three orders of magnitude lower than
the heat generation rate of metal heater and is considered negligible too. The radiation loss of the whole system is thus dominated by the radiation from the CNT film.
Since the sample is clipped to the holder, there is thermal contact resistance between the sample surface and the holder. The heat flux 𝑞⃗⃗⃗ 𝑐 across the contact surfaces is:
−𝑛⃗ ∙ 𝑞⃗⃗⃗ 𝑐= −∆𝑇 𝑅𝑐, ⁄ (11) where ∆𝑇 is the temperature jump between the two contact surfaces.
3.4.2 Solver
We perform the thermal simulations by solving Eq. 3 to Eq. 11 in 3D via the finite element method using software COMSOL MultiphysicsTM. The element size is
set as 15μm, which is the same as the spatial resolution of the infrared thermal camera.
3.4.3 Parameter sensitivity check by numerical simulation
Numerical simulations are done to investigate the effect of various parameters on the temperature profiles. The values used in the simulations can be found in the Supplementary Table S1. The surface temperature profiles along a segment perpendicular to the center of the wire heater (marked as the blue dotted line in Fig.
10(a)) are plotted as a function of the distance from the heater. Variations in the holder thermal conductivity, in the contact resistance between holder and samples, and in the ambient temperature only induce a homogeneous shift of temperature by ∆T (see Supplementary Fig.S1, S2 and S3).
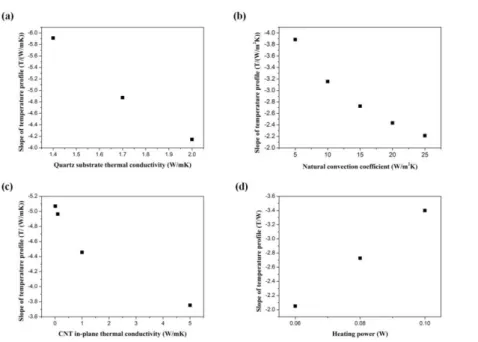
By contrast, a change in the slope of the temperature profile is observed when the quartz substrate thermal conductivity, the natural convection coefficient, the in-plane thermal conductivity of the CNT film, and the heating power vary. The relationships between the slope of the temperature profile versus these four parameters are shown in Fig. 12. The original temperature profiles can be found in Supplementary Fig. S4, S5, S6, S8.
Fig. 12 Slope of temperature profile versus (a) quartz substrate thermal conductivity;
(b) natural convection coefficient; (c) CNT in-plane thermal conductivity; and (d)
Mis en forme : Anglais (États-Unis)
Mis en forme : Anglais (États-Unis)
heating power. (The original temperature profiles can be found in Supplementary Fig. S4, S5, S6, S8).
The surface temperature profile is not sensitive to the out-of-plane thermal conductivity of the CNT film (see Supplementary Fig. S7). It is because when the whole system is under thermal steady state, the net heat flux in the CNT film happens in the in-plane direction towards the holder (heat sink). Thus, the measured temperature distribution at the surface of the 3D CNT network is mainly governed by the in-plane thermal conductivity of the CNT film, and not sensitive to the out-of-plane thermal conductivity of the CNT film.
3.4.4 Derivation of the in-plane thermal conductivity
As discussed in Section 3.4.3, the variation in the CNT in-plane thermal conductivity will lead to a slope change in the surface temperature profile with a function of the distance from the heater (see Fig. 11(a)). However, the value of the natural convection coefficient, another unknown parameter, also has an influence on the slope of the temperature profile (see Fig. 11(b)). Therefore, both the CNT in-plane thermal conductivity and the natural convection coefficient need to be derived from the temperature profiles. The temperature profiles obtained at three different heating powers (23 mW, 47 mW, and 99 mW) are perfect candidates for the derivation, as they are non-linearly correlated to the heating power, as shown in supplementary Fig. S8.
convection coefficient, both of them are varied iteratively until the simulation matches the experimental data for the three different heating powers. The profile matching is achieved using the least mean-square fitting tool of COMSOL MultiphysicsTM.
Note that the thermal conductivity of the holder 𝐾𝐴 and the contact resistance
𝑅𝑐 are also not known during the measurements. However, the simulations show that the change in 𝐾𝐴 and 𝑅𝑐 only induce a homogeneous shift of the temperature by ∆𝑇 (as discussed in Section 3.4.3), and do not influence the slope of the temperature profiles. Thus, there is no impact on the derivation of the in-plane thermal conductivity.
3.4.5 Results for the in-plane thermal conductivity
Figures 13 (a) and (b) show the fitting curves of the temperature profiles for the 3D CNT network and the primary VACNT array. Under different heat generation rates, the fitting curves are in very good agreement with the temperature profiles obtained by the infrared thermal camera, with all the R-squared coefficient larger than 0.99.
The resulting in-plane thermal conductivities for the 3D CNT network and the primary VACNT array are respectively 5.40W/mK and 0.10W/mK. The thermal conductivity of the 3D CNT network is much higher than that of the primary VACNT array. The enhancement in the thermal conductivity is attributed to the extra thermal pathways provided by the secondary CNTs, which directly grown from the walls of the primary VACNTs. The natural convection coefficient h for the 3D CNT network
Mis en forme : Anglais (États-Unis)
and the primary VACNT array are both found to be 2.0 W/m2K, which is comparable
to the conventional natural convection coefficient reported (2~25 W/m2K) [24].
The uncertainty in the derivation of the in-plane thermal conductivity of the CNT films is mainly related to the uncertainty on the values of the quartz substrate thermal conductivity (1.2%) and the heat generating rate (1.6%), since the variation of these two parameters may lead to changes in the slope of the temperature profile (as discussed in Section 3.4.3). The total uncertainty for the thermal conductivity estimation can be calculated using:
δ𝐾𝐶𝑁𝑇,𝑖𝑛 𝐾𝐶𝑁𝑇,𝑖𝑛 =√[ ∂f (𝐾𝐶𝑁𝑇,𝑖𝑛) ∂𝐾𝑆 δ𝐾𝑆] 2 +[∂f (𝐾𝐶𝑁𝑇) ∂P δP] 2 , (12) where 𝐾𝑆 is the thermal conductivity of the quartz substrate, and P is the heat
generation rate. For the 3D CNT network, the total uncertainty is 17%. While for primary VACNT array, the total uncertainty is calculated to be 51%, which is due to the low sensitivity of the surface temperature profile to low KCNT,in around 0.10W/mK.
Taking these uncertainties in the measurements into account, the thermal conductivities of the VACNT array and the 3D CNT network are, respectively, 0.10±0.05 W/mK and 5.40±0.92W/mK, which corresponds to an the improvement in the in-plane thermal conductivity is of at least 30 times higher.
3.4.6 Additional characterizationsOut-of-plane thermal conductivities
For the sake of completeness
The previous result shows clearly the advantage of using 3D CNT network to enhance the in-plane thermal conductivities. However, as the secondary CNTs appear to branch out from the primary CNTs, the possibility exists that they have a
detrimental effect on the thermal conductivity of the primary CNTs, and thus on the
out-of-plane thermal conductivity of the 3D CNT network. To address this issue, , the
out-of-plane conductivities of the VACNT array and the 3D CNT network were evaluated via a method derived from the 3ω method [14] and reported fully here [].
The out-of plane thermal conductivity were found to be, respectively, 17.9 W/mK for
the VACNT array and 21.5 W/mK for the 3D CNT network, corresponding to an
improvement by 20% of the thermal conductivity thanks to the addition of secondary CNTs. This may be due to the random orientation of the secondary CNTs. Indeed, as they are not growing orthogonally to the VACNTs, but with a random angle to the CNT surface (as can be seen from the TEM pictures), they are also expected to create additional out-of-plane (vertical) thermal pathways. via a method derived from the
3ω method [14]. More details on the method and results are the subject of a separate
study to be published elsewhere).
3.4.7. Mechanical softness
Furthermore, nanodynamic mechanical analyses were performed on the VACNT array and the 3D CNT network using a Dynamic Mechanical Analysis (DMA) setup Q800 from TA instrument. No significant difference was observed in the viscoelastic properties (loss and storage moduli) of the two samples, thus indicating that the gain in in-plane thermal conductivity in the newly proposed 3DCNT network was obtained without degrading the softness of the system, an important point for its further use as a TIM.
Commenté [BL1]: Put the ref with the title and author of your paper specifying under review
Commenté [BL2]: Please put the error here to show that the 20% increase is significant.
Commenté [BL3]: Put the reference of the corresponding paper. Also, you should confirm that the work in the paper from Edwin has been done with a CNT array grown by the same process. If not, the paragraph has to be written differently in the response to reviewer and the paragraph should be written differently in this paper (not as a conclusion, for instance in the literature section: you can write that 3D CNT materials are expected to be very interesting, as TIM, as they have similar mechanical features than VACNT array [paper Edwin], but with additional thermal pathways). .
Fig.13 Fitting of the experimental temperature profile based on the 3D thermal model
for different heating powers for (a) the 3D CNT network and (b) the primary VACNT array.
4 Conclusion
A novel 3D CNT network structure is proposed to improve the thermal performances of CNT-based TIMs. In the 3D CNT network structure, the primary VACNTs are cross-linked by randomly-oriented secondary CNTs grown directly from the walls of the primary VACNTs. Both VACNT and 3D CNT network structures are integrated with a local heating element and the temperature distributions of the 3D CNT network and the VACNT array heated under different heating powers are recorded in real time by a 15μm-resolution thermal imaging system. These profiles show that, the surface temperature of the 3D CNT network is much lower than that of the VACNT array, showing a much better thermal dissipation capability. The in-plane thermal conductivities of both types of material are further obtained bya full 3D numerical thermal model of the system. The in-plane thermal conductivity of 3D CNT network is found to be 5.40±0.92 W/mK, which is at least 30 times higher than that of the VACNT array (0.10±0.05 W/mK). The thermal conductivity enhancement is attributed to the extra thermal pathways provided by the secondary CNTs. The direct growth of these CNT from the walls of the primary VACNTs is thought to minimize the thermal resistance between primary and secondary CNTs. The obtained outcomes in this study demonstrate an effective approach in enhancing the in-plane thermal conductivity of CNT films, which gives an insightful view on the applications of CNTs as TIM materials.
Acknowledgements
This work was supported by MOE Tier 2 (MOE2014-T2-2-105) and SIM Tech-NTU PA RCA_16/174.We thank Dr. Ibos for performing the emissivity measurements from
References
[1] K.C. Otiaba, N.N. Ekere, R.S. Bhatti, S. Mallik, M.O. Alam, E.H. Amalu, Thermal interface materials for automotive electronic control unit: Trends, technology and R&D challenges, Microelectronics Reliability 51(12) (2011) 2031-2043. [2] S. Kaur, N. Raravikar, B.A. Helms, R. Prasher, D.F. Ogletree, Enhanced thermal transport at covalently functionalized carbon nanotube array interfaces, Nature communications 5 (2014) 3082.
[3] S.Y. Kwon, I.M. Kwon, Y.-G. Kim, S. Lee, Y.-S. Seo, A large increase in the thermal conductivity of carbon nanotube/polymer composites produced by percolation phenomena, Carbon 55 (2013) 285-290.
[4] A.J. McNamara, Y. Joshi, Z.M. Zhang, Thermal resistance of thermal conductive adhesive anchored carbon nanotubes interface material, International Journal of Thermal Sciences 96 (2015) 221-226.
[5] P. Kim, L. Shi, A. Majumdar, P. McEuen, Thermal transport measurements of individual multiwalled nanotubes, Physical review letters 87(21) (2001) 215502. [6] T.Y. Choi, D. Poulikakos, J. Tharian, U. Sennhauser, Measurement of thermal conductivity of individual multiwalled carbon nanotubes by the 3-ω method, Applied physics letters 87(1) (2005) 013108.
[7] S. Choi, H. Im, J. Kim, The thermal conductivity of embedded nano-aluminum nitride-doped multi-walled carbon nanotubes in epoxy composites containing micro-aluminum nitride particles, Nanotechnology 23(6) (2012) 065303.
[8] M.B. Jakubinek, M.A. White, G. Li, C. Jayasinghe, W. Cho, M.J. Schulz, V. Shanov, Thermal and electrical conductivity of tall, vertically aligned carbon nanotube arrays, Carbon 48(13) (2010) 3947-3952.
[9] A.J. McNamara, Y. Joshi, Z.M. Zhang, Characterization of nanostructured thermal interface materials–a review, International Journal of Thermal Sciences 62 (2012) 2-11.
[10] R. Cross, B.A. Cola, T. Fisher, X. Xu, K. Gall, S. Graham, A metallization and bonding approach for high performance carbon nanotube thermal interface materials, Nanotechnology 21(44) (2010) 445705.
[11] K. Zhang, Y. Chai, M.M.F. Yuen, D. Xiao, P. Chan, Carbon nanotube thermal interface material for high-brightness light-emitting-diode cooling, Nanotechnology 19(21) (2008) 215706.
[12] J. Che, T. Cagin, W.A. Goddard III, Thermal conductivity of carbon nanotubes, Nanotechnology 11(2) (2000) 65.
[13] T. Borca-Tasciuc, S. Vafaei, D.-A. Borca-Tasciuc, B. Wei, R. Vajtai, P. Ajayan, Anisotropic thermal diffusivity of aligned multiwall carbon nanotube arrays, Journal of applied physics 98(5) (2005) 054309.
[14] D.G. Cahill, Thermal conductivity measurement from 30 to 750 K: the 3ω method, Review of scientific instruments 61(2) (1990) 802-808.
[15] M. Shanahan, The brain's connective core and its role in animal cognition, Philos. Trans. R. Soc. Lond. B Biol. Sci. 367(1603) (2012) 2704-2714.
Investigation of the directional emissivity of materials using infrared thermography coupled with a periodic excitation, QIRT 2016, 2016.
[17] Y. Abdi, J. Koohsorkhi, J. Derakhshandeh, S. Mohajerzadeh, H. Hoseinzadegan, M. Robertson, J. Bennett, X. Wu, H. Radamson, PECVD-grown carbon nanotubes on silicon substrates with a nickel-seeded tip-growth structure, Materials Science and Engineering: C 26(5) (2006) 1219-1223.
[18] M. Chhowalla, K. Teo, C. Ducati, N. Rupesinghe, G. Amaratunga, A. Ferrari, D. Roy, J. Robertson, W. Milne, Growth process conditions of vertically aligned carbon nanotubes using plasma enhanced chemical vapor deposition, Journal of Applied Physics 90(10) (2001) 5308-5317.
[19] Y.D. Lim, Q. Kong, S. Wang, C.W. Tan, B.K. Tay, S. Aditya, Enhanced field emission properties of carbon nanotube films using densification technique, Applied Surface Science.
[20] K.K. Lau, J. Bico, K.B. Teo, M. Chhowalla, G.A. Amaratunga, W.I. Milne, G.H. McKinley, K.K. Gleason, Superhydrophobic carbon nanotube forests, Nano letters 3(12) (2003) 1701-1705.
[21] Z.-c. Tu, Z.-c. Ou-Yang, Single-walled and multiwalled carbon nanotubes viewed as elastic tubes with the effective Young’s moduli dependent on layer number, Physical Review B 65(23) (2002) 233407.
[22] I. Ivanov, A. Puretzky, G. Eres, H. Wang, Z. Pan, H. Cui, R. Jin, J. Howe, D.B. Geohegan, Fast and highly anisotropic thermal transport through vertically aligned carbon nanotube arrays, Applied Physics Letters 89(22) (2006) 223110.
[23] R. Kitamura, L. Pilon, M. Jonasz, Optical constants of silica glass from extreme ultraviolet to far infrared at near room temperature, Applied optics 46(33) (2007) 8118-8133.
[24] T.L. Bergman, F.P. Incropera, Fundamentals of heat and mass transfer, John Wiley & Sons2011.